All Projects → frewsxcv → Graphosaurus

frewsxcv / Graphosaurus

Licence: mpl-2.0
3D graph viewer powered by WebGL (three.js)

Programming Languages

javascript
184084 projects - #8 most used programming language

Projects that are alternatives of or similar to Graphosaurus

Patches
Patches is a visual programming editor for building WebVR and WebGL experiences.
Stars: ✭ 164 (-51.76%)
Mutual labels:  graph, webgl, threejs
Enable3d
🕹️ Standalone 3D Framework / Physics for three.js (using ammo.js) / 3D extension for Phaser 3
Stars: ✭ 271 (-20.29%)
Mutual labels:  webgl, threejs
Three.phenomenon
⭐️ A tiny wrapper around three.js built for high-performance WebGL experiences.
Stars: ✭ 338 (-0.59%)
Mutual labels:  webgl, threejs
Livecodelab
a web based livecoding environment
Stars: ✭ 276 (-18.82%)
Mutual labels:  webgl, threejs
Three Elements
Web Components-powered custom HTML elements for building Three.js-powered games and interactive experiences. 🎉
Stars: ✭ 331 (-2.65%)
Mutual labels:  webgl, threejs
React Three Editable
👀 ✏️ Edit your react-three-fiber scene with a visual editor without giving up control over your code.
Stars: ✭ 261 (-23.24%)
Mutual labels:  webgl, threejs
Vivagraphjs
Graph drawing library for JavaScript
Stars: ✭ 3,442 (+912.35%)
Mutual labels:  graph, webgl
Pygraphistry
PyGraphistry is a Python library to quickly load, shape, embed, and explore big graphs with the GPU-accelerated Graphistry visual graph analyzer
Stars: ✭ 1,365 (+301.47%)
Mutual labels:  graph, webgl
Glmaps
Data visualization examples and tutorials from scratch. 数据可视化示例代码集与新手学习教程。
Stars: ✭ 288 (-15.29%)
Mutual labels:  webgl, threejs
Moonrider
🌕🏄🏿 Surf the musical road among the stars. Side project built by two people in a few months to demonstrate WebXR.
Stars: ✭ 292 (-14.12%)
Mutual labels:  webgl, threejs
Cga.js
CGA 3D 计算几何算法库 | 3D Compute Geometry Algorithm Library webgl three.js babylon.js等任何库都可以使用
Stars: ✭ 313 (-7.94%)
Mutual labels:  webgl, threejs
3dio Js
JavaScript toolkit for interior apps
Stars: ✭ 255 (-25%)
Mutual labels:  webgl, threejs
Map33.js
A JavaScript library to make 3D maps with three.js.
Stars: ✭ 317 (-6.76%)
Mutual labels:  webgl, threejs
Dino3d
🦖 Google Chrome T-Rex Run! in 3D (WebGL experiment)
Stars: ✭ 263 (-22.65%)
Mutual labels:  webgl, threejs
Sdf Ui
WebGL node editor for Signed Distance Functions
Stars: ✭ 101 (-70.29%)
Mutual labels:  graph, webgl
Three Globe
WebGL Globe Data Visualization as a ThreeJS reusable 3D object
Stars: ✭ 270 (-20.59%)
Mutual labels:  webgl, threejs
Vizceral
WebGL visualization for displaying animated traffic graphs
Stars: ✭ 3,871 (+1038.53%)
Mutual labels:  graph, webgl
Graph Visualization
3D graph visualization with WebGL / Three.js
Stars: ✭ 507 (+49.12%)
Mutual labels:  graph, webgl
Glas
WebGL in WebAssembly with AssemblyScript
Stars: ✭ 278 (-18.24%)
Mutual labels:  webgl, threejs
React Postprocessing
📬 postprocessing for react-three-fiber
Stars: ✭ 311 (-8.53%)
Mutual labels:  webgl, threejs

Graphosaurus

Build Status npm version

A three-dimensional static graph viewer.

(click the image to try it out)

Demos

Documentation

JSDoc generated API documentation can be found here.

Twenty second tutorial

<html>
  <head>
    <style>
    #graph {
      width: 500px;
      height: 500px;
      border: 1px solid grey;
    }
    </style>
  </head>
  <body>
    <div id="graph"></div>

    <script src="graphosaurus.min.js"></script>
    <script>
      // JavaScript will go here
    </script>
  </body>
</html>

If you open this up in your web browser, you'll see something that looks like this:

Look at that amazing square! Now let's create a graph, a couple nodes, and an edge between the nodes:

var graph = G.graph()

// Create a red node with cartesian coordinates x=0, y=0, z=0
var redNode = G.node([0, 0, 0], {color: "red"});
graph.addNode(redNode);

// You can also use the addTo method to add to the graph
var greenNode = G.node([1, 1, 1], {color: "green"}).addTo(graph);

var edge = G.edge([redNode, greenNode], {color: "blue"});
graph.addEdge(edge);  // or edge.addTo(graph)

// Render the graph in the HTML element with id='graph'
graph.renderIn("graph");

After inserting this JavaScript in the <script> block, you should see this:

While this is a very basic example, I hope I've demonstrated how simple it is to create graphs with Graphosaurus.

Build

  1. Run git clone https://github.com/frewsxcv/graphosaurus.git to clone this repository
  2. Install node, npm, and grunt-cli
  3. Run npm install to install all the build requirements
  4. Run grunt to build Graphosaurus. The resulting compiled JavaScript will be in dist/ and the docs will be in doc/

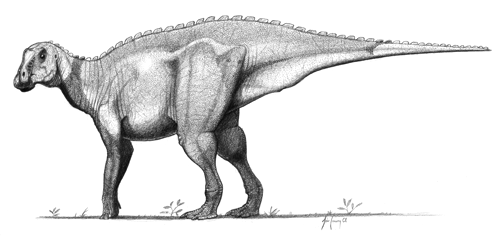
Mascot

gryposaurus

John Conway's illustration of our glorious leader, the gryposaurus graphosaurus.

Similar projects

Copyright

All files in this repository are licensed under version two of the Mozilla Public License.

Graphosaurus has some third party dependencies listed in the package.json file in the devDependencies and dependencies sections. Their licenses can be found on their respective project pages.

Note that the project description data, including the texts, logos, images, and/or trademarks, for each open source project belongs to its rightful owner. If you wish to add or remove any projects, please contact us at [email protected].