hijiangtao / Glmaps
Programming Languages
Projects that are alternatives of or similar to Glmaps

glmaps
Spatio-temporal data visualization example codes and tutorials from scratch.


![]()


README
What is glmaps?
glmaps is a project full of bunch of earth and map visualization examples based on Three.js and Deck.gl, as well as some tutorials for visualization beginners. Easy to learn and use.
Watch online demo video at YouTube or Tencent Video.
A brief introduction of thie project is now available at Meidum, Zhihu and my blog.
Table of Contents
-
Overview - Check all visualization types that
glmapscontains. - ZERO - Some thoughts from me that you may pay attention before have future reading.
- Demo - Open browser and enter https://localhost:8080 to check the demo locally.
- Tutorials - A series of tutorials that guide you how to code these visualization examples step by step. TBD.
-
Install - Installation guide for developers. Just have a try,
glmapshas not get ready for industry applications. -
Usage - Usage for how to include
glmapsin your application. -
Documents - API document for
glmaps. TBD. - Stories - Stories behind this repositry.
- Resources - Resources for further learning in Spatio-temporal Data Visualization, WebGL, etc.
Overview
Check all visualization types that glmaps contains, 2.5D means you can draw 3D geometries on a 2D map, 3D means a total 3D data visualization approach.
| Type | Description | Demo | Animation | Cluster |
|---|---|---|---|---|
| 3D / Curve | THREE.BufferGeometry() | 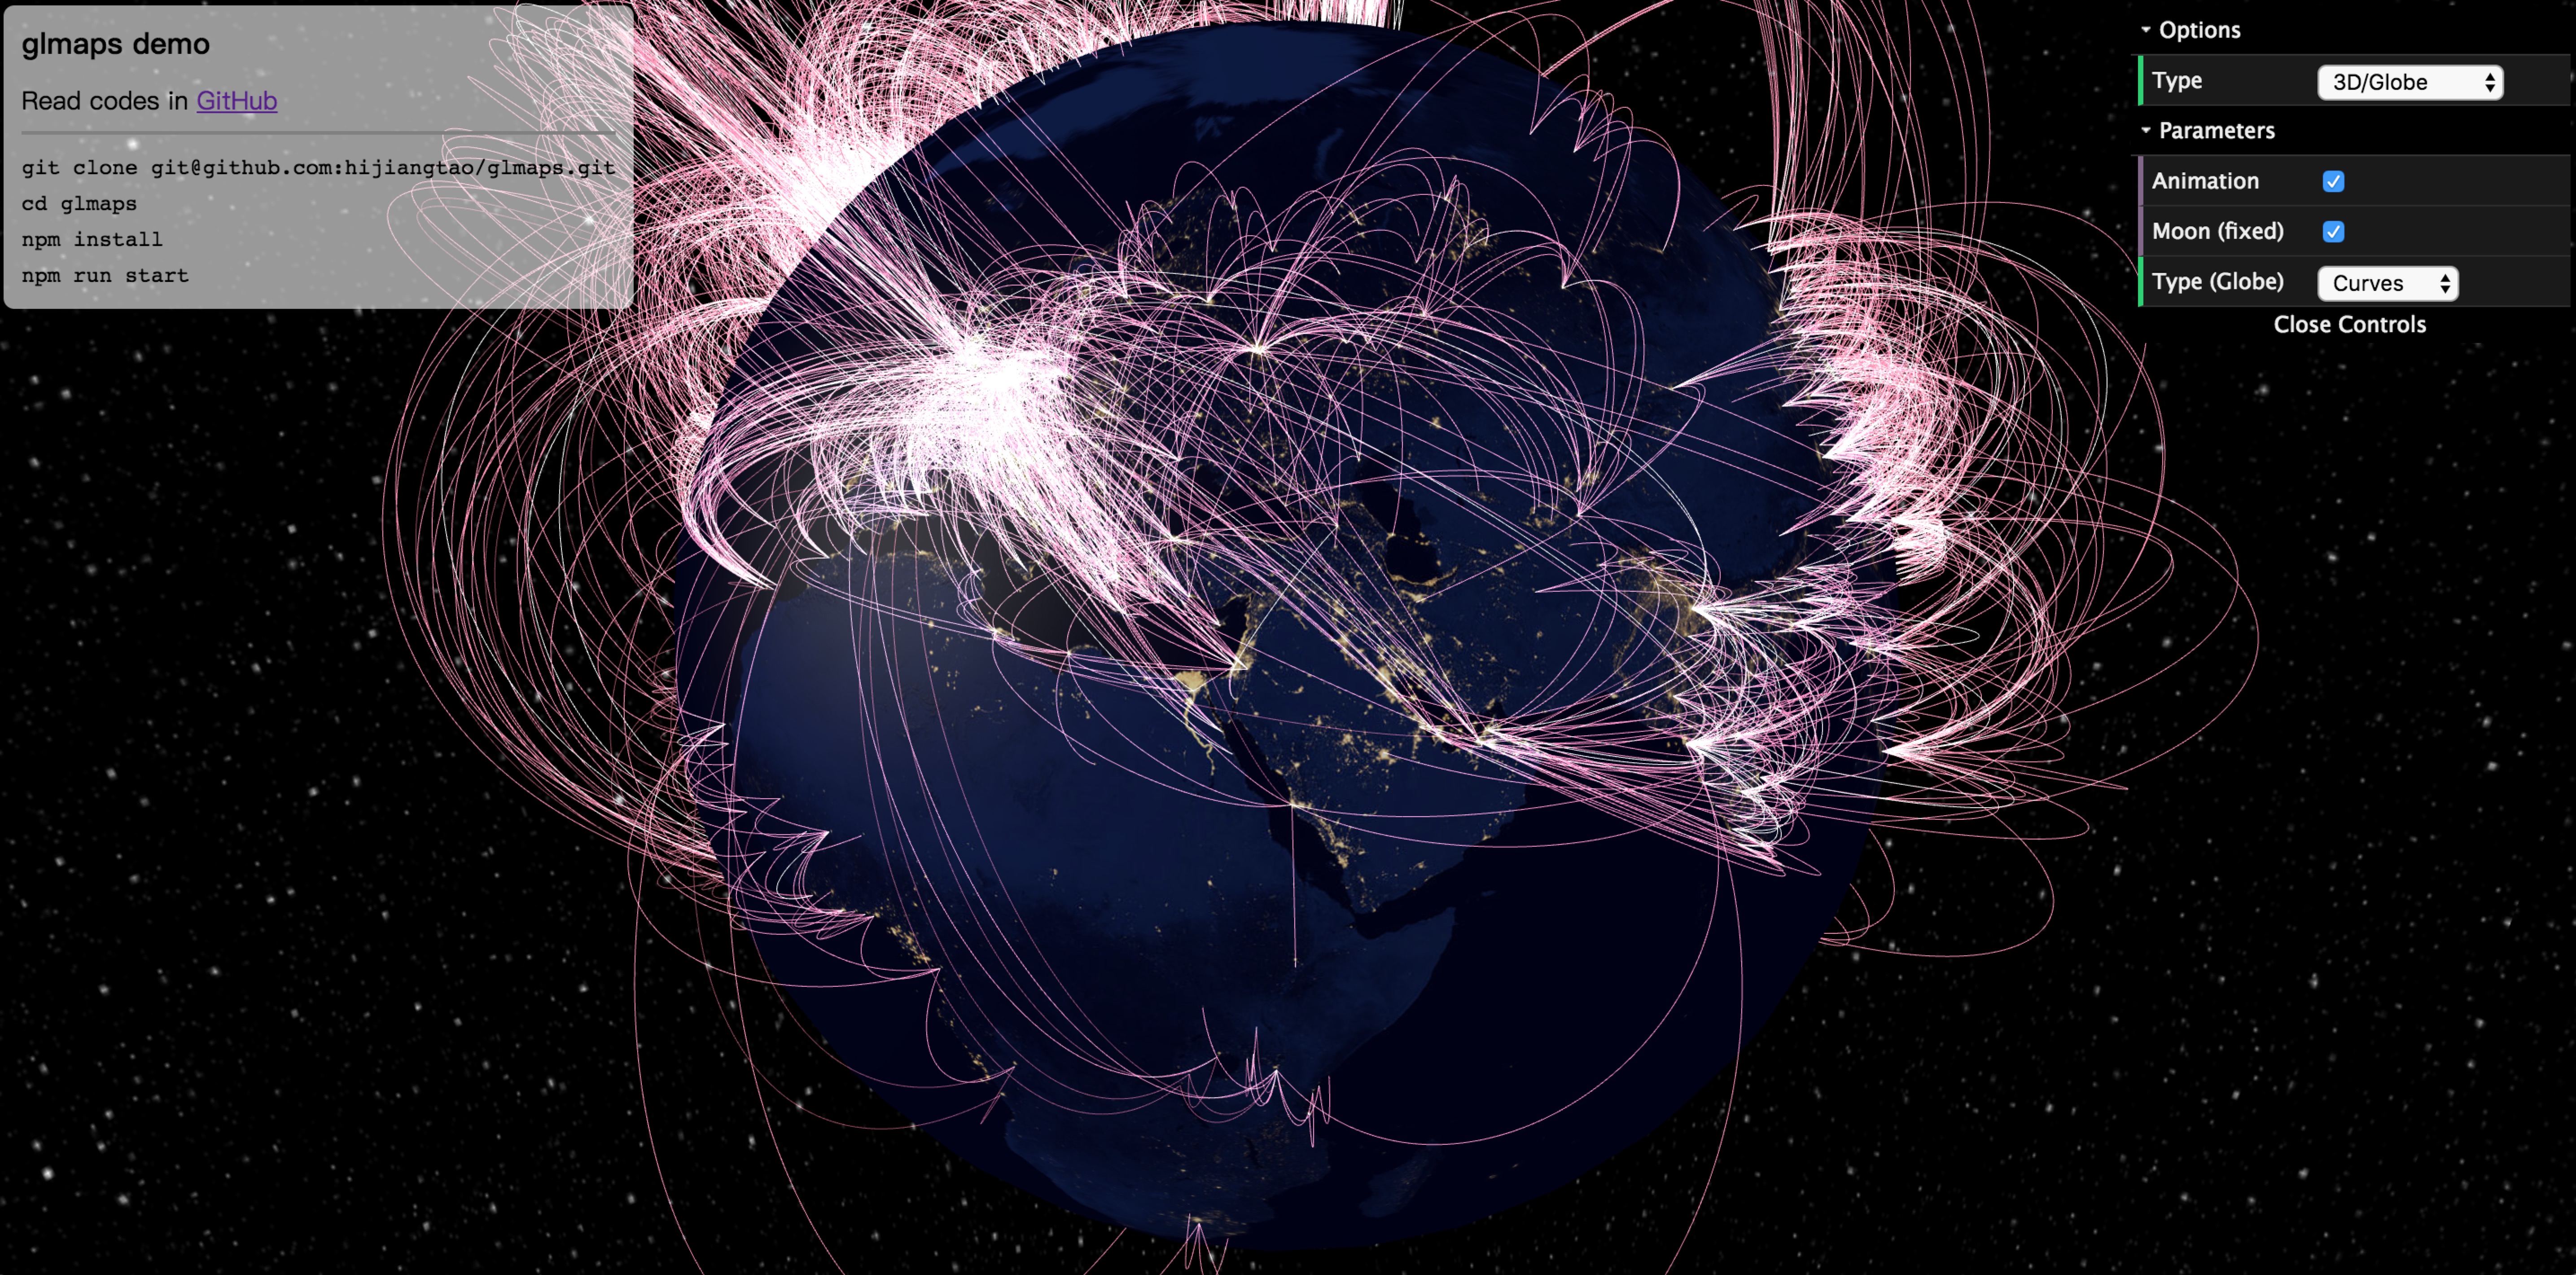 |
Yes | No |
| 3D / Mover | THREE.SphereGeometry() | 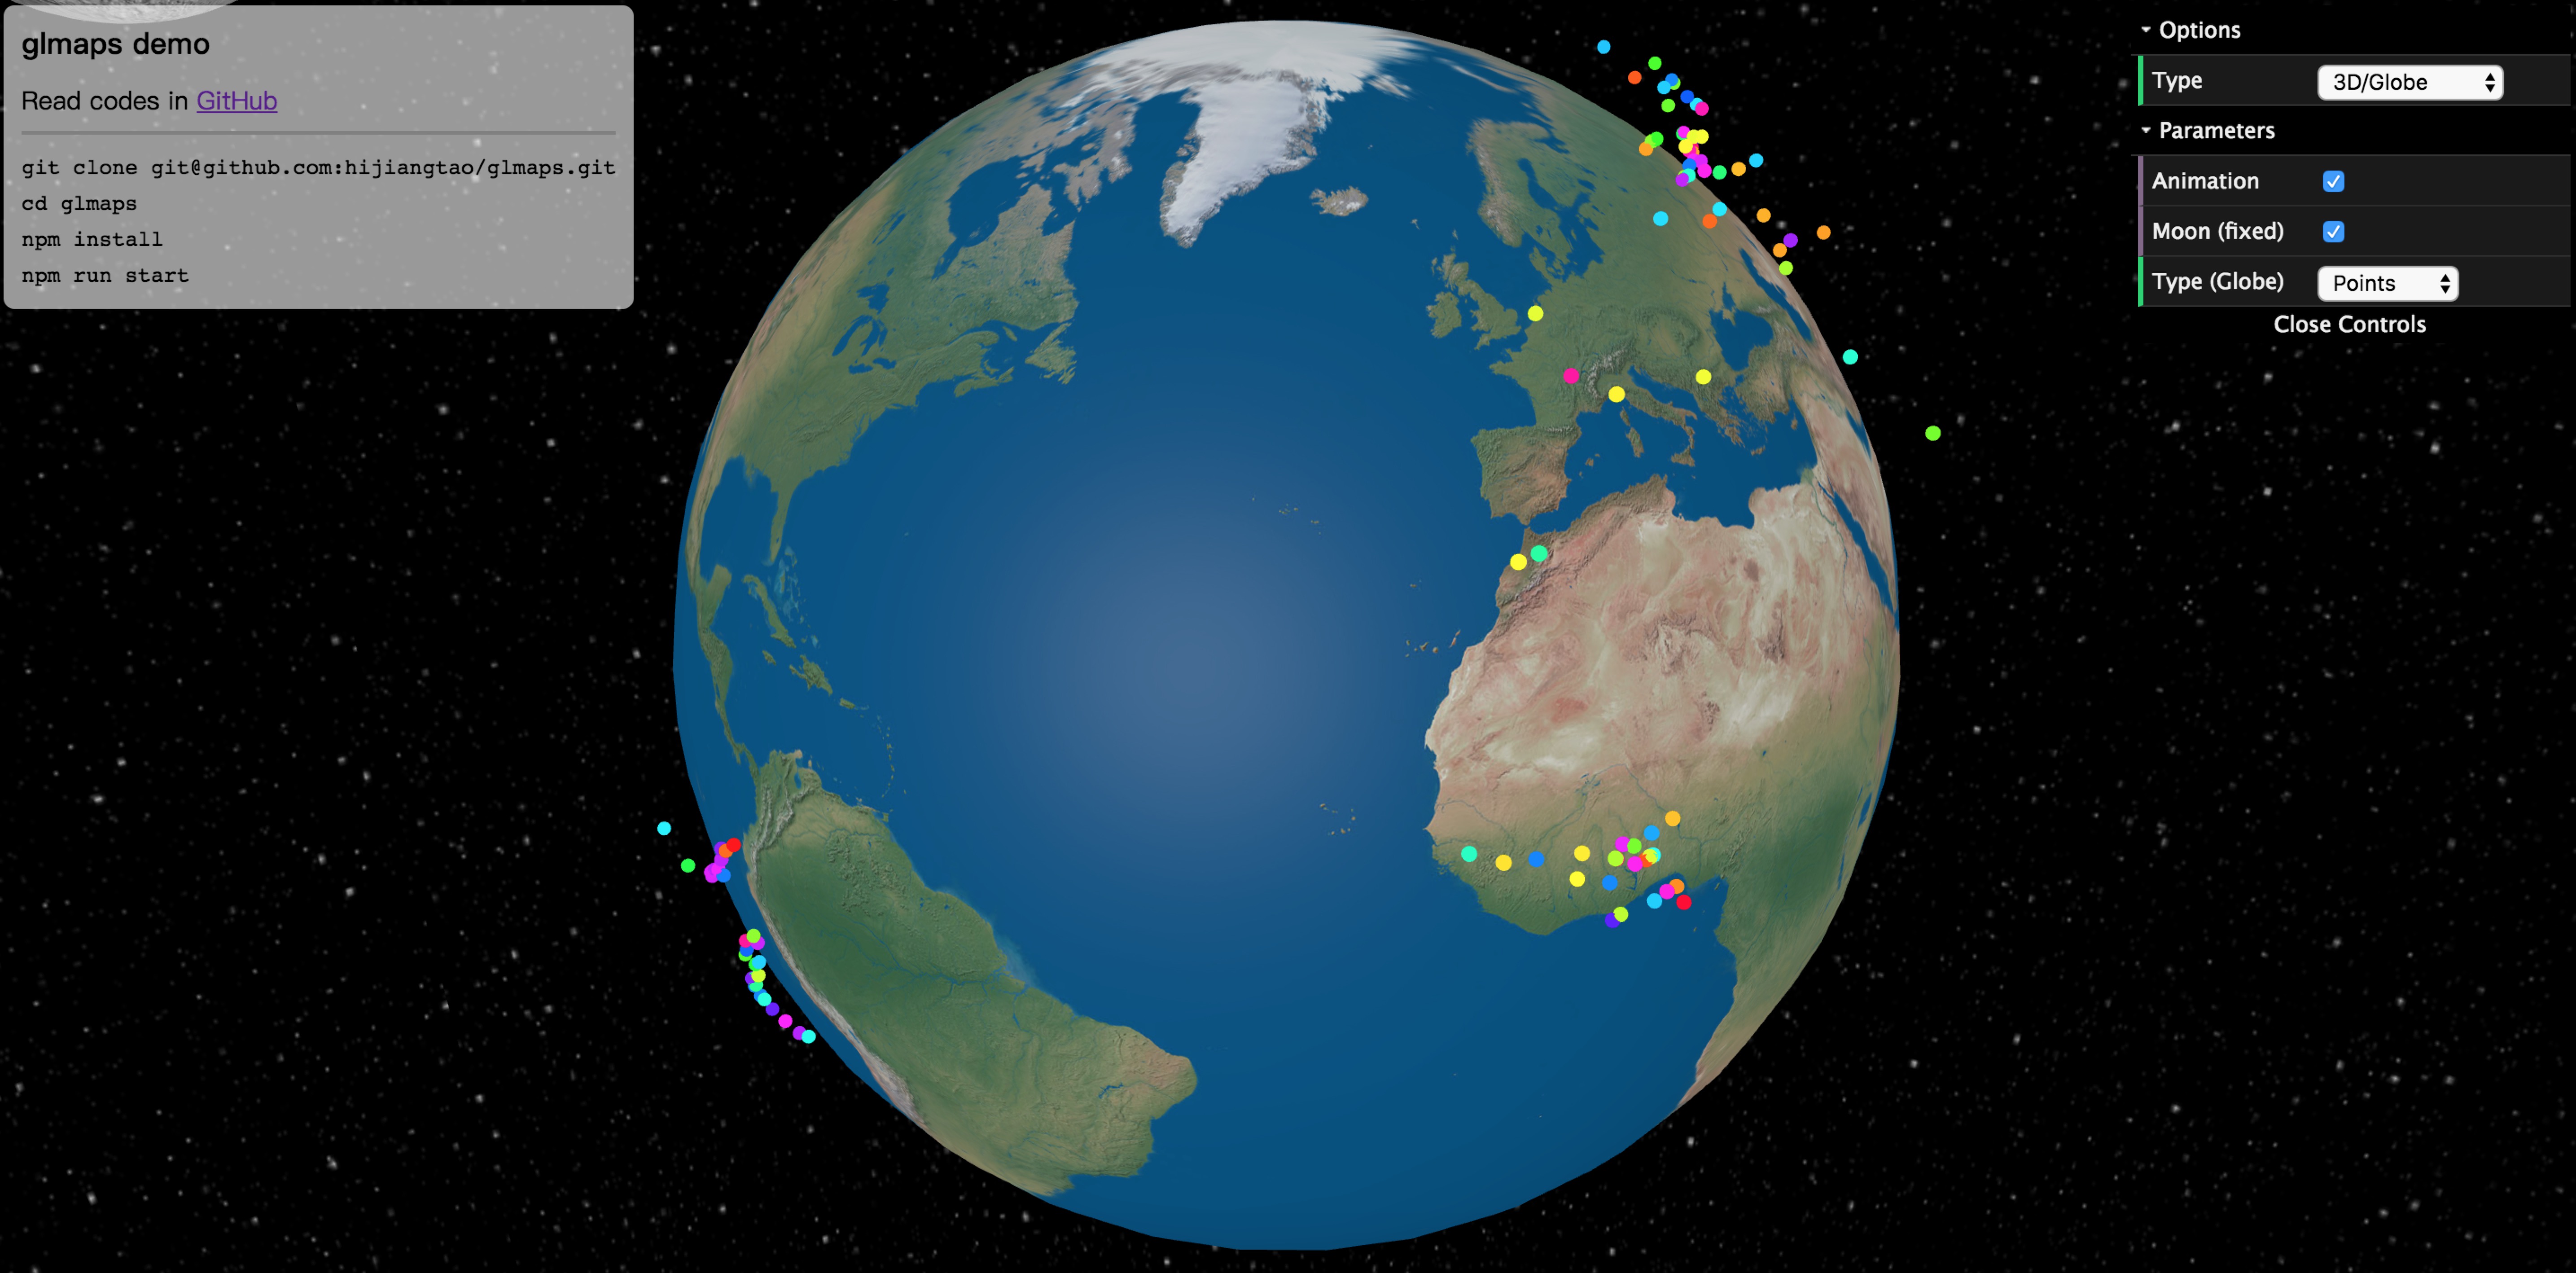 |
Yes | No |
| 3D / Cube | THREE.BoxGeometry() | 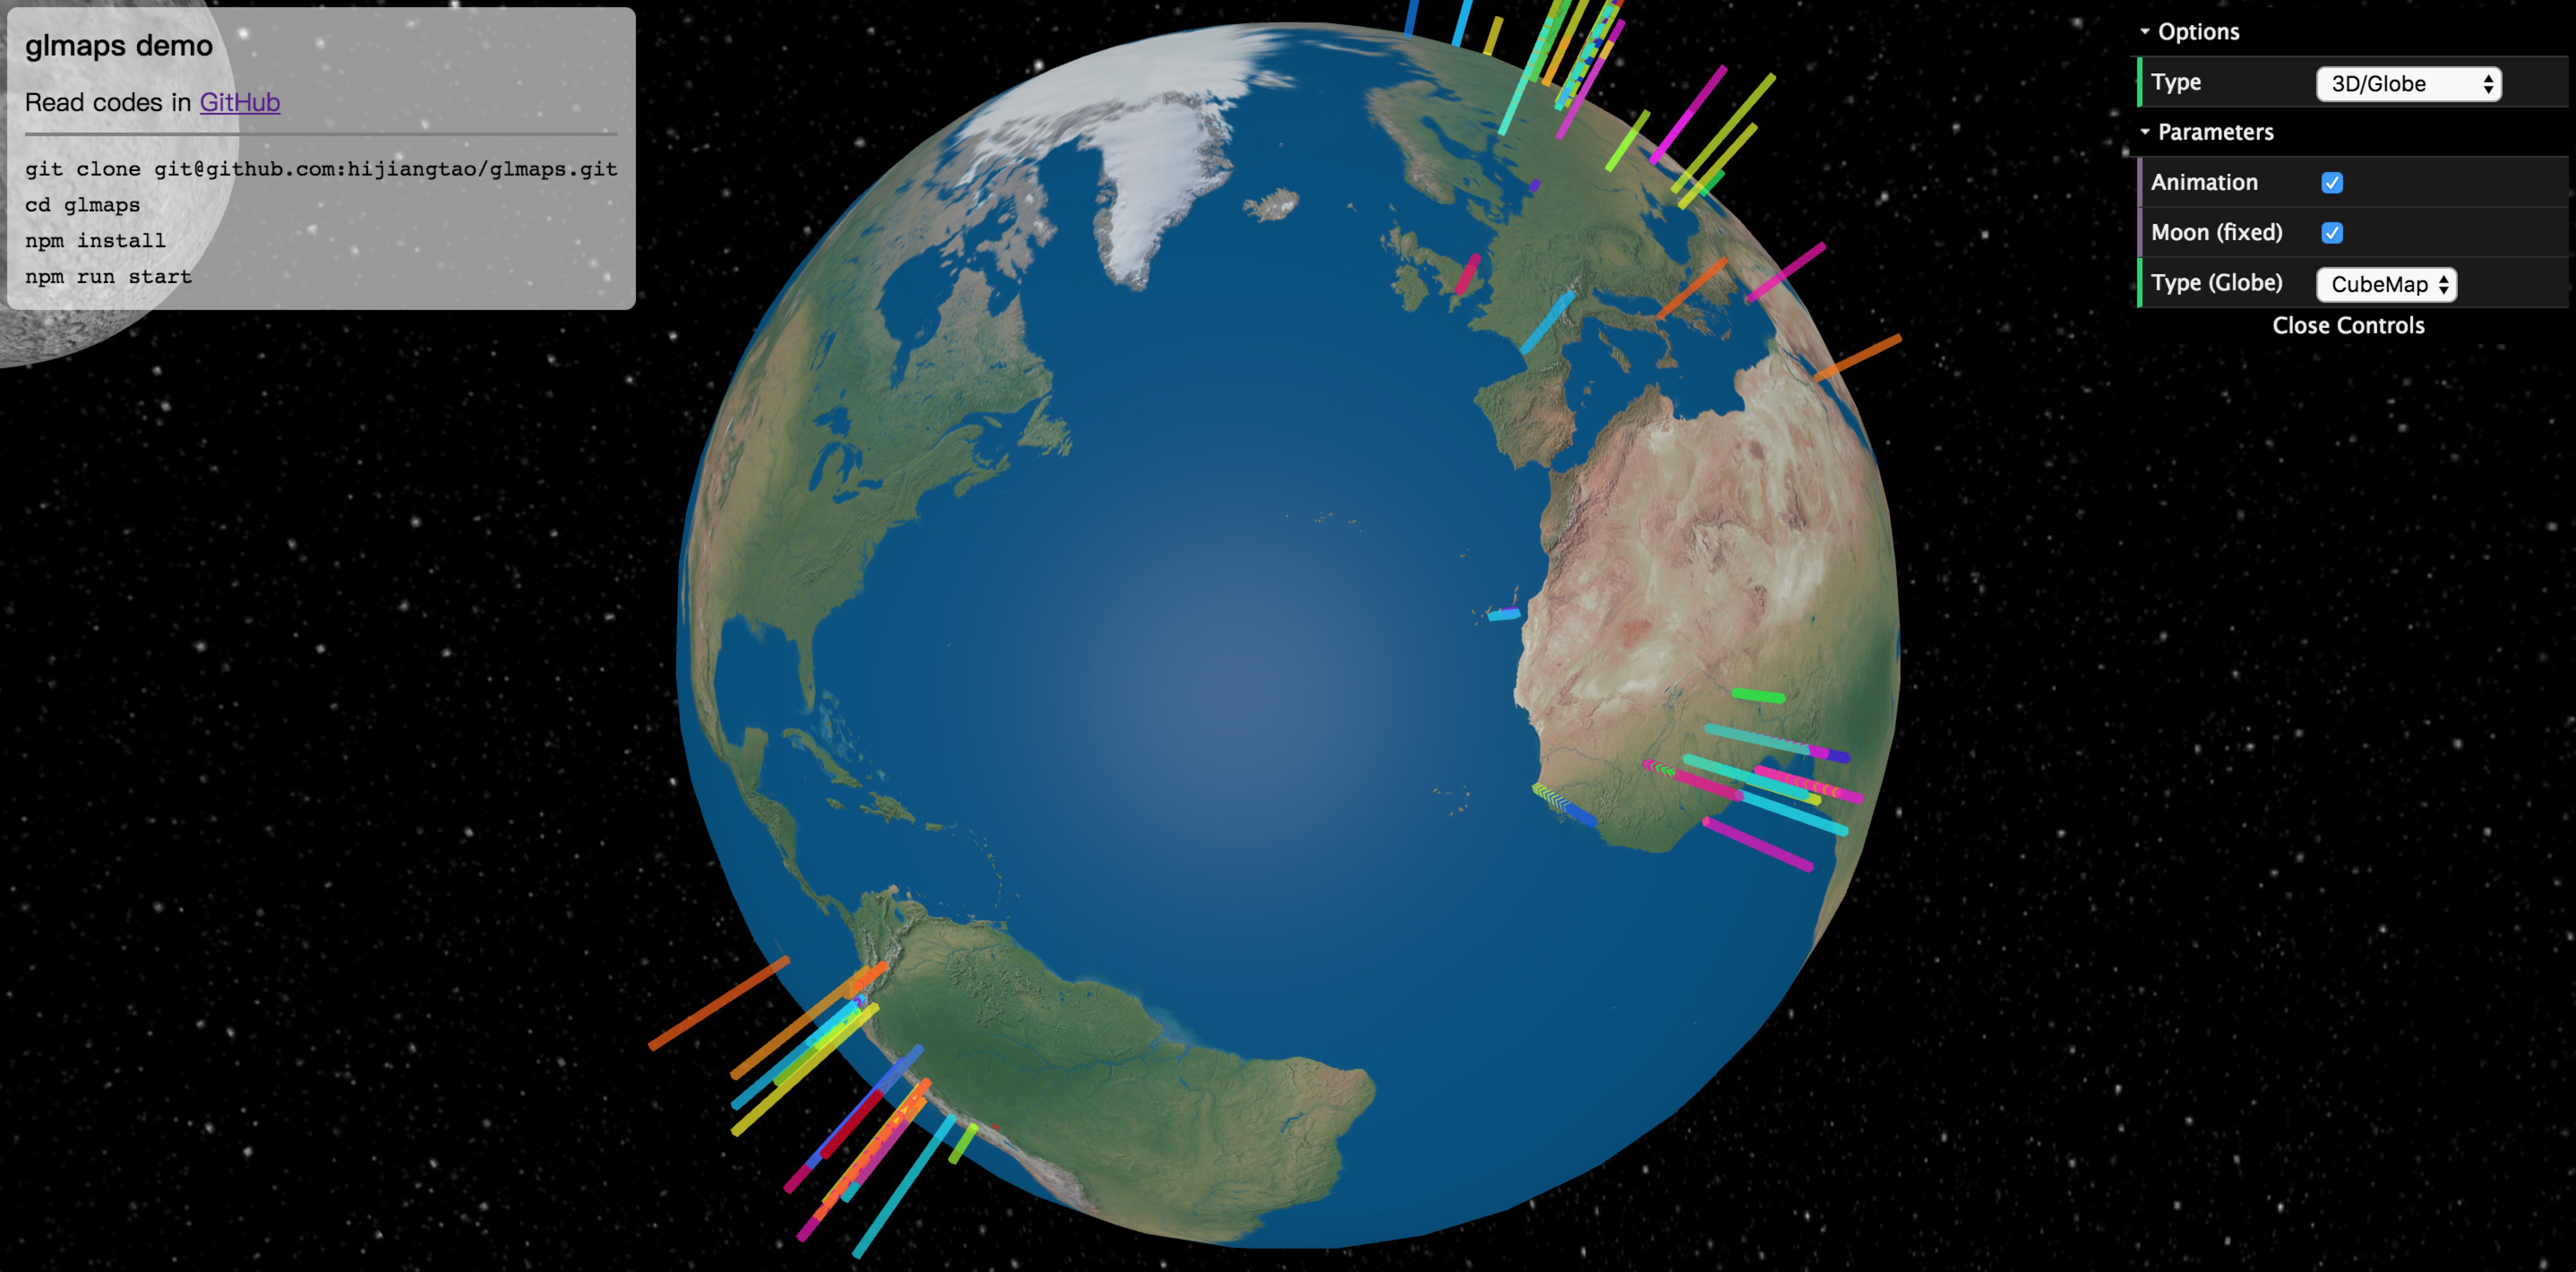 |
No | No |
| 2.5D / Icon | No modification from deck | 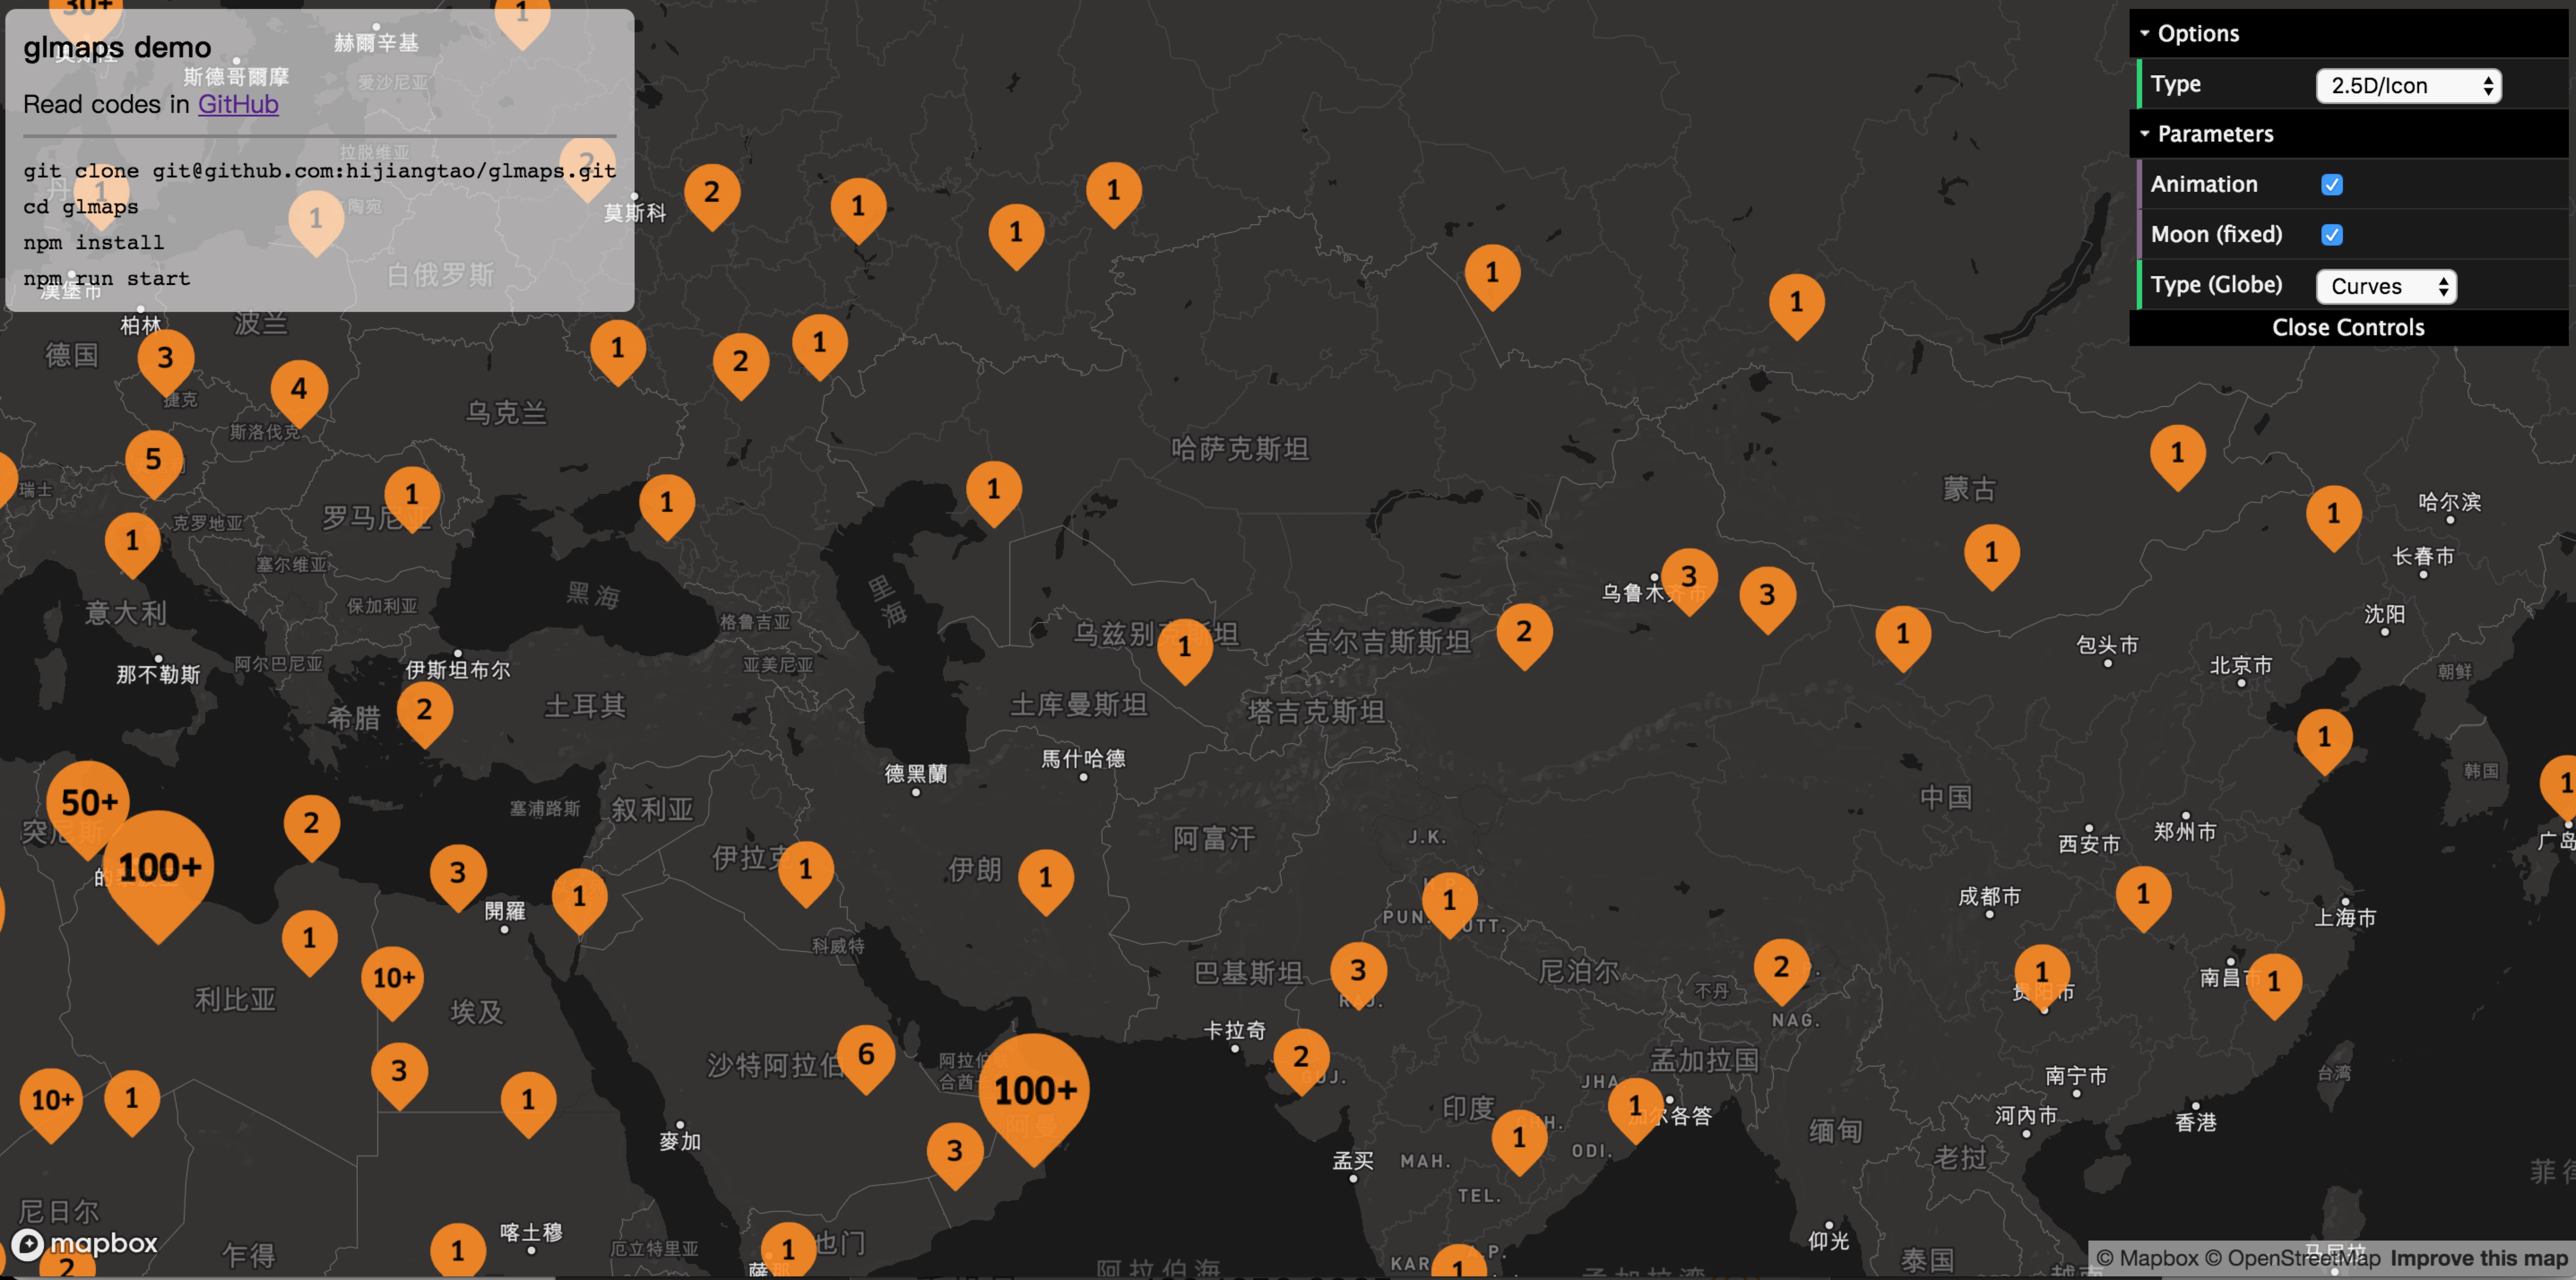 |
No | Yes |
| 2.5D / Brush | Support OD Arc Animation | 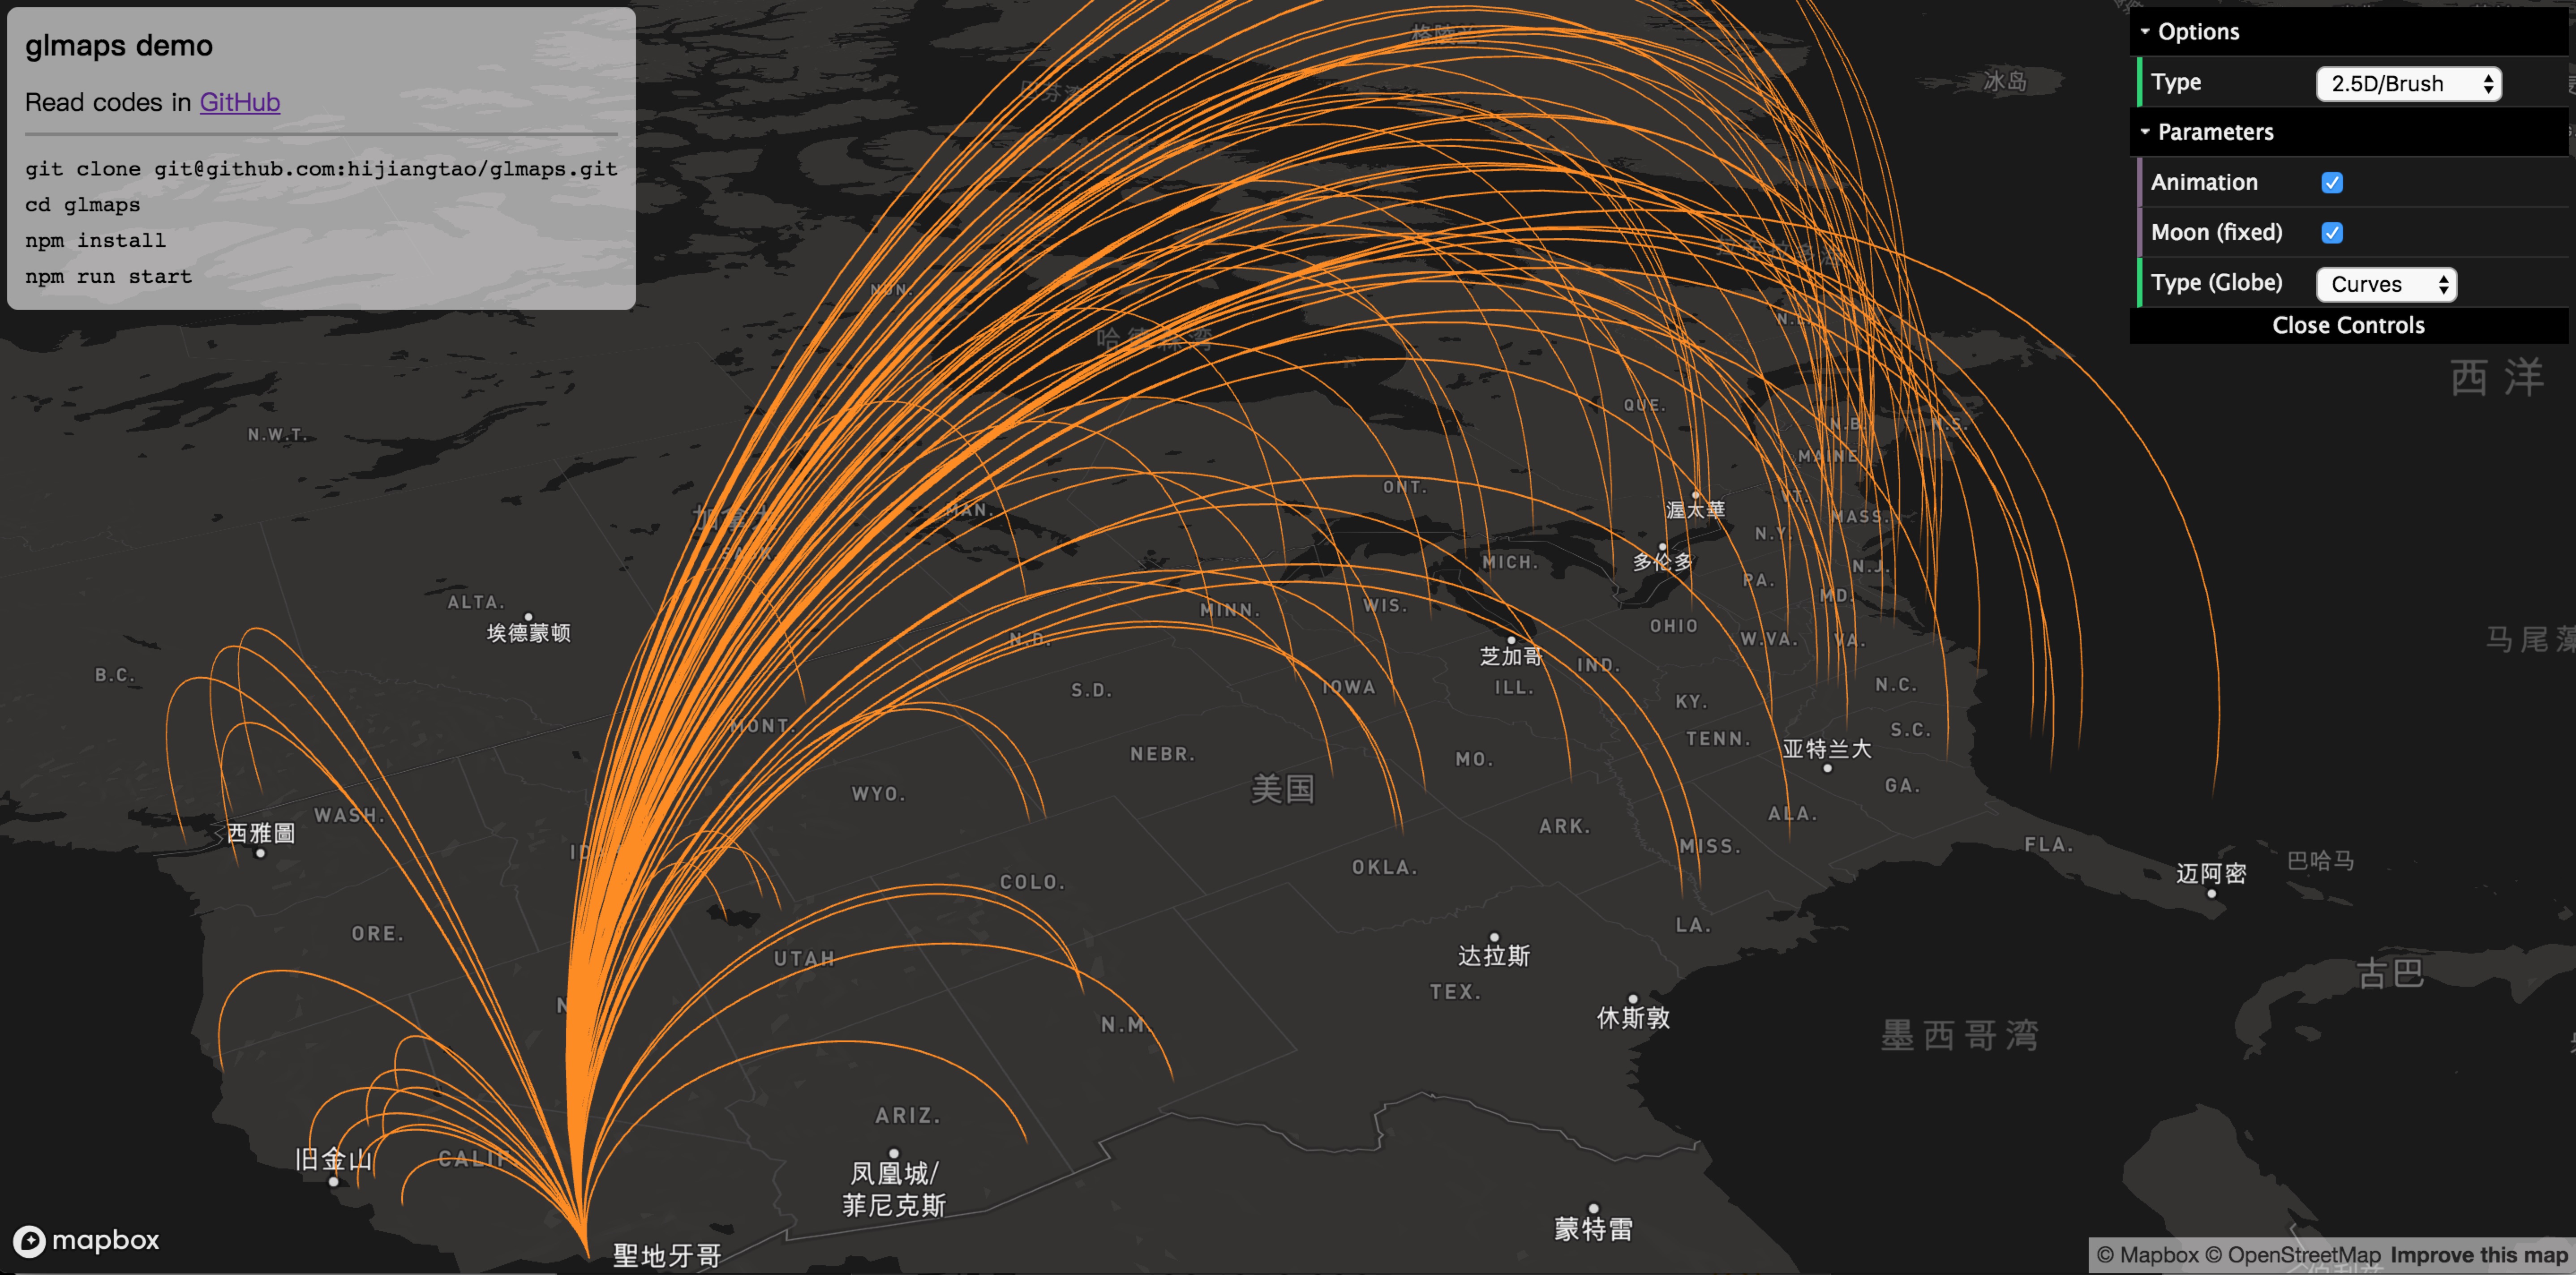 |
Yes | No |
| 2.5D / Scatter | Support Fade-out Animation | 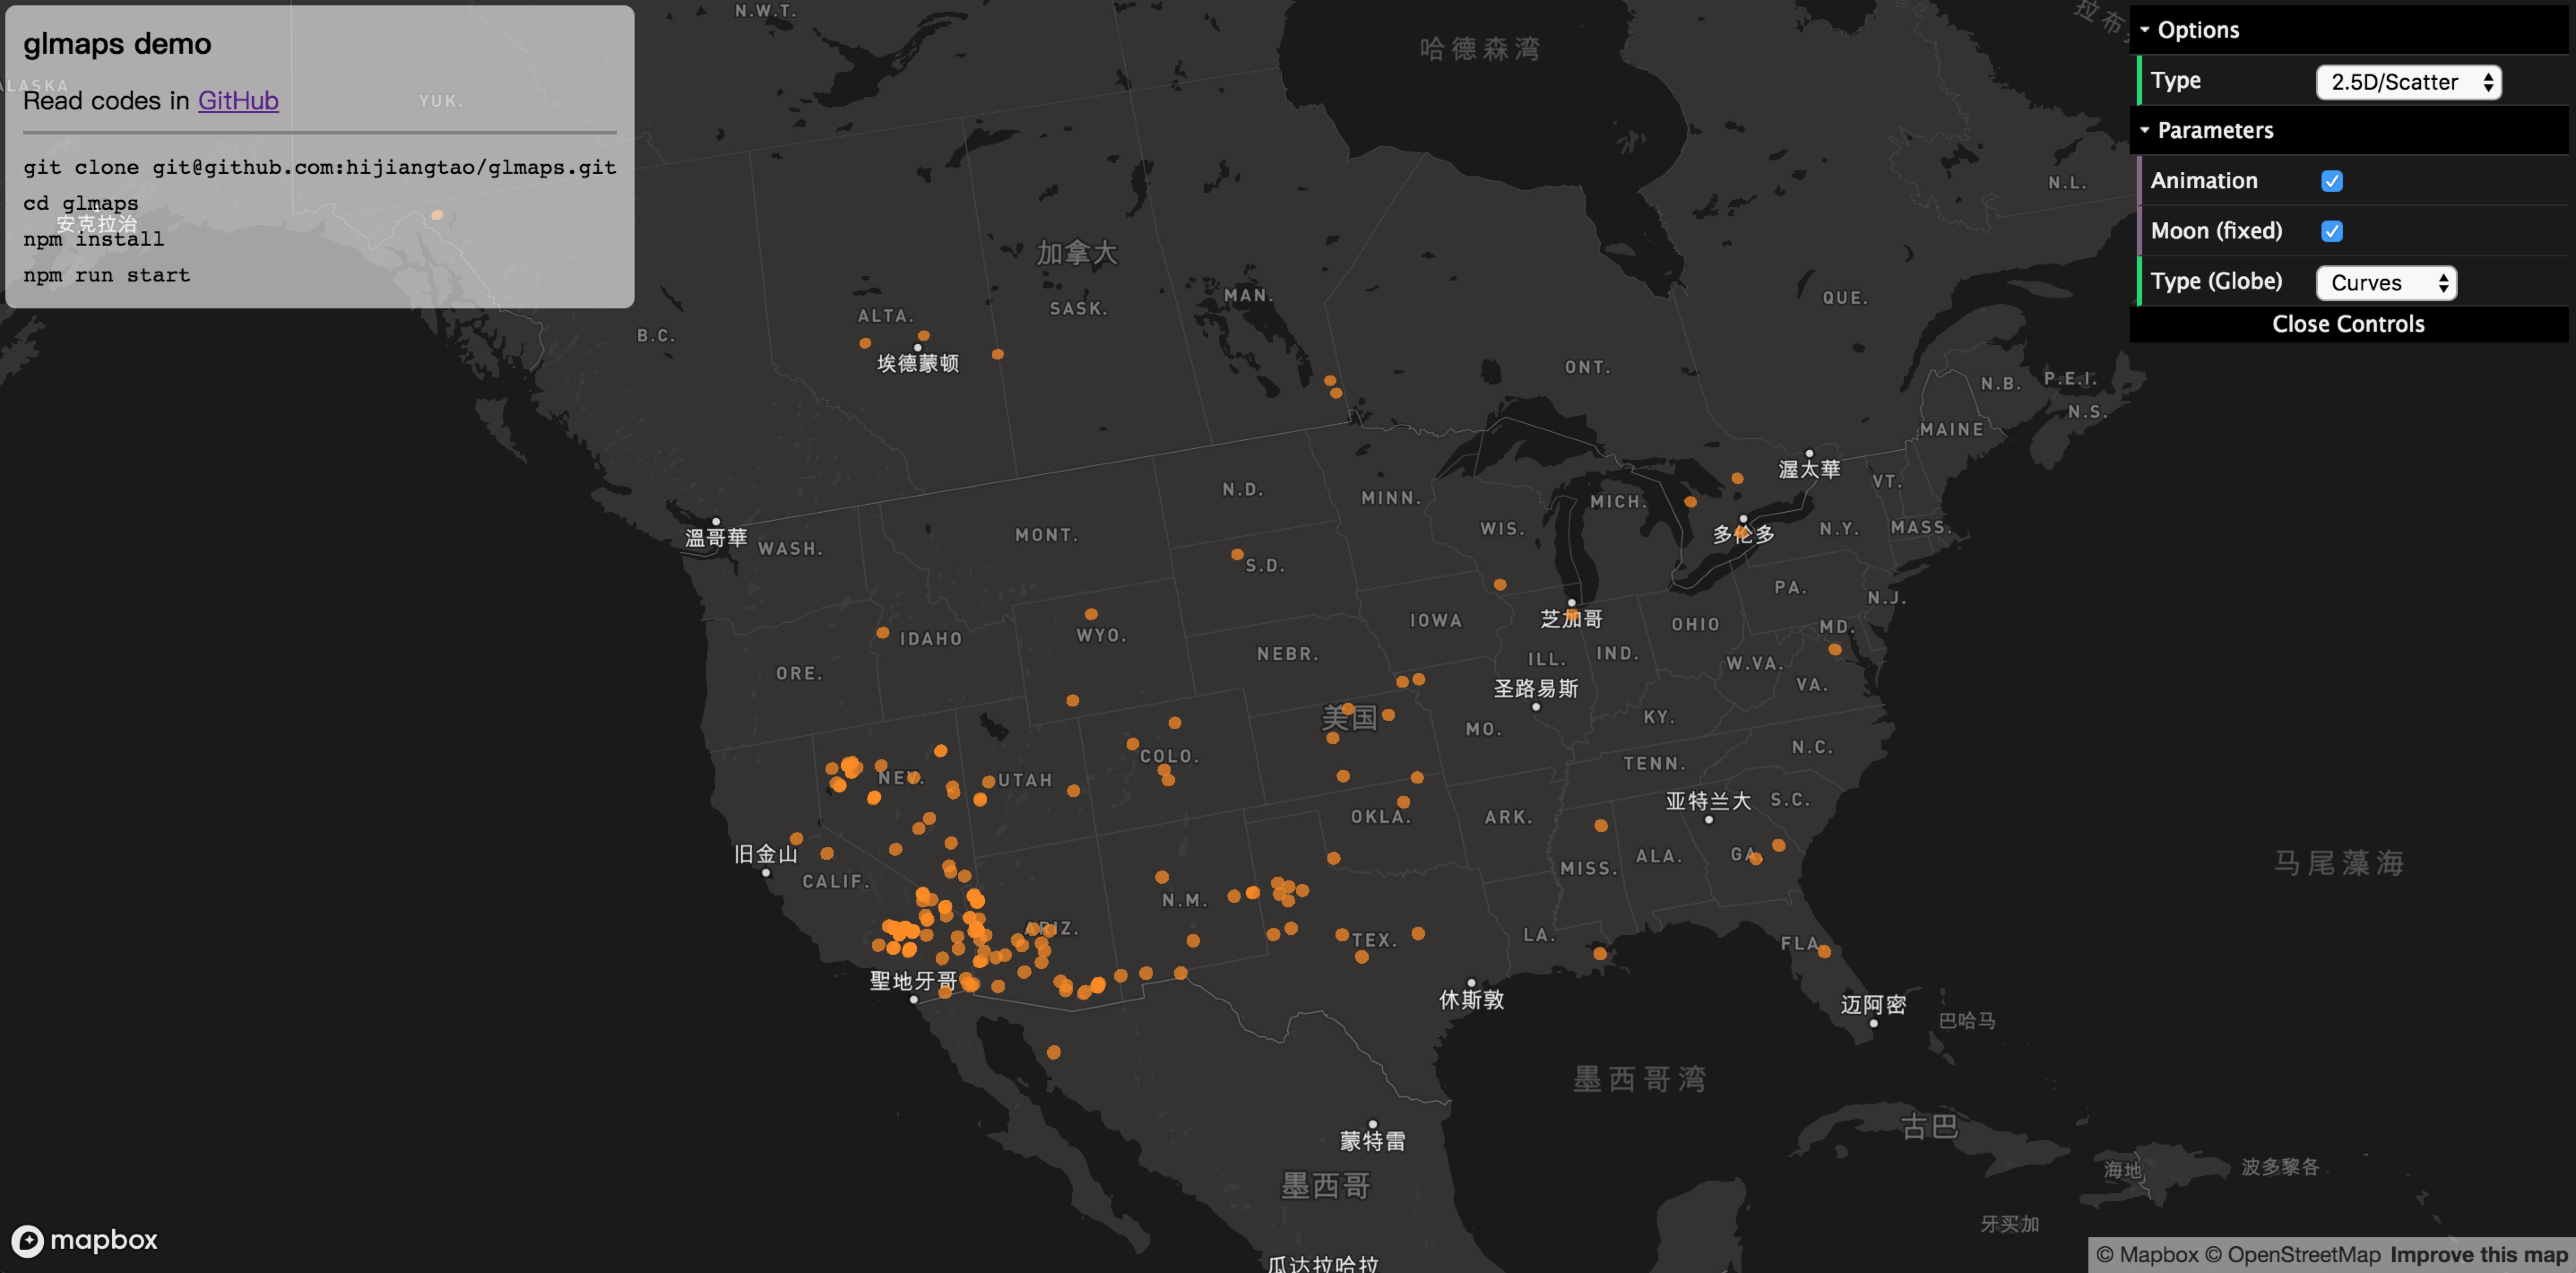 |
Yes | No |
| 2.5D / Hexagon | Support Coverage Filter Conditions | 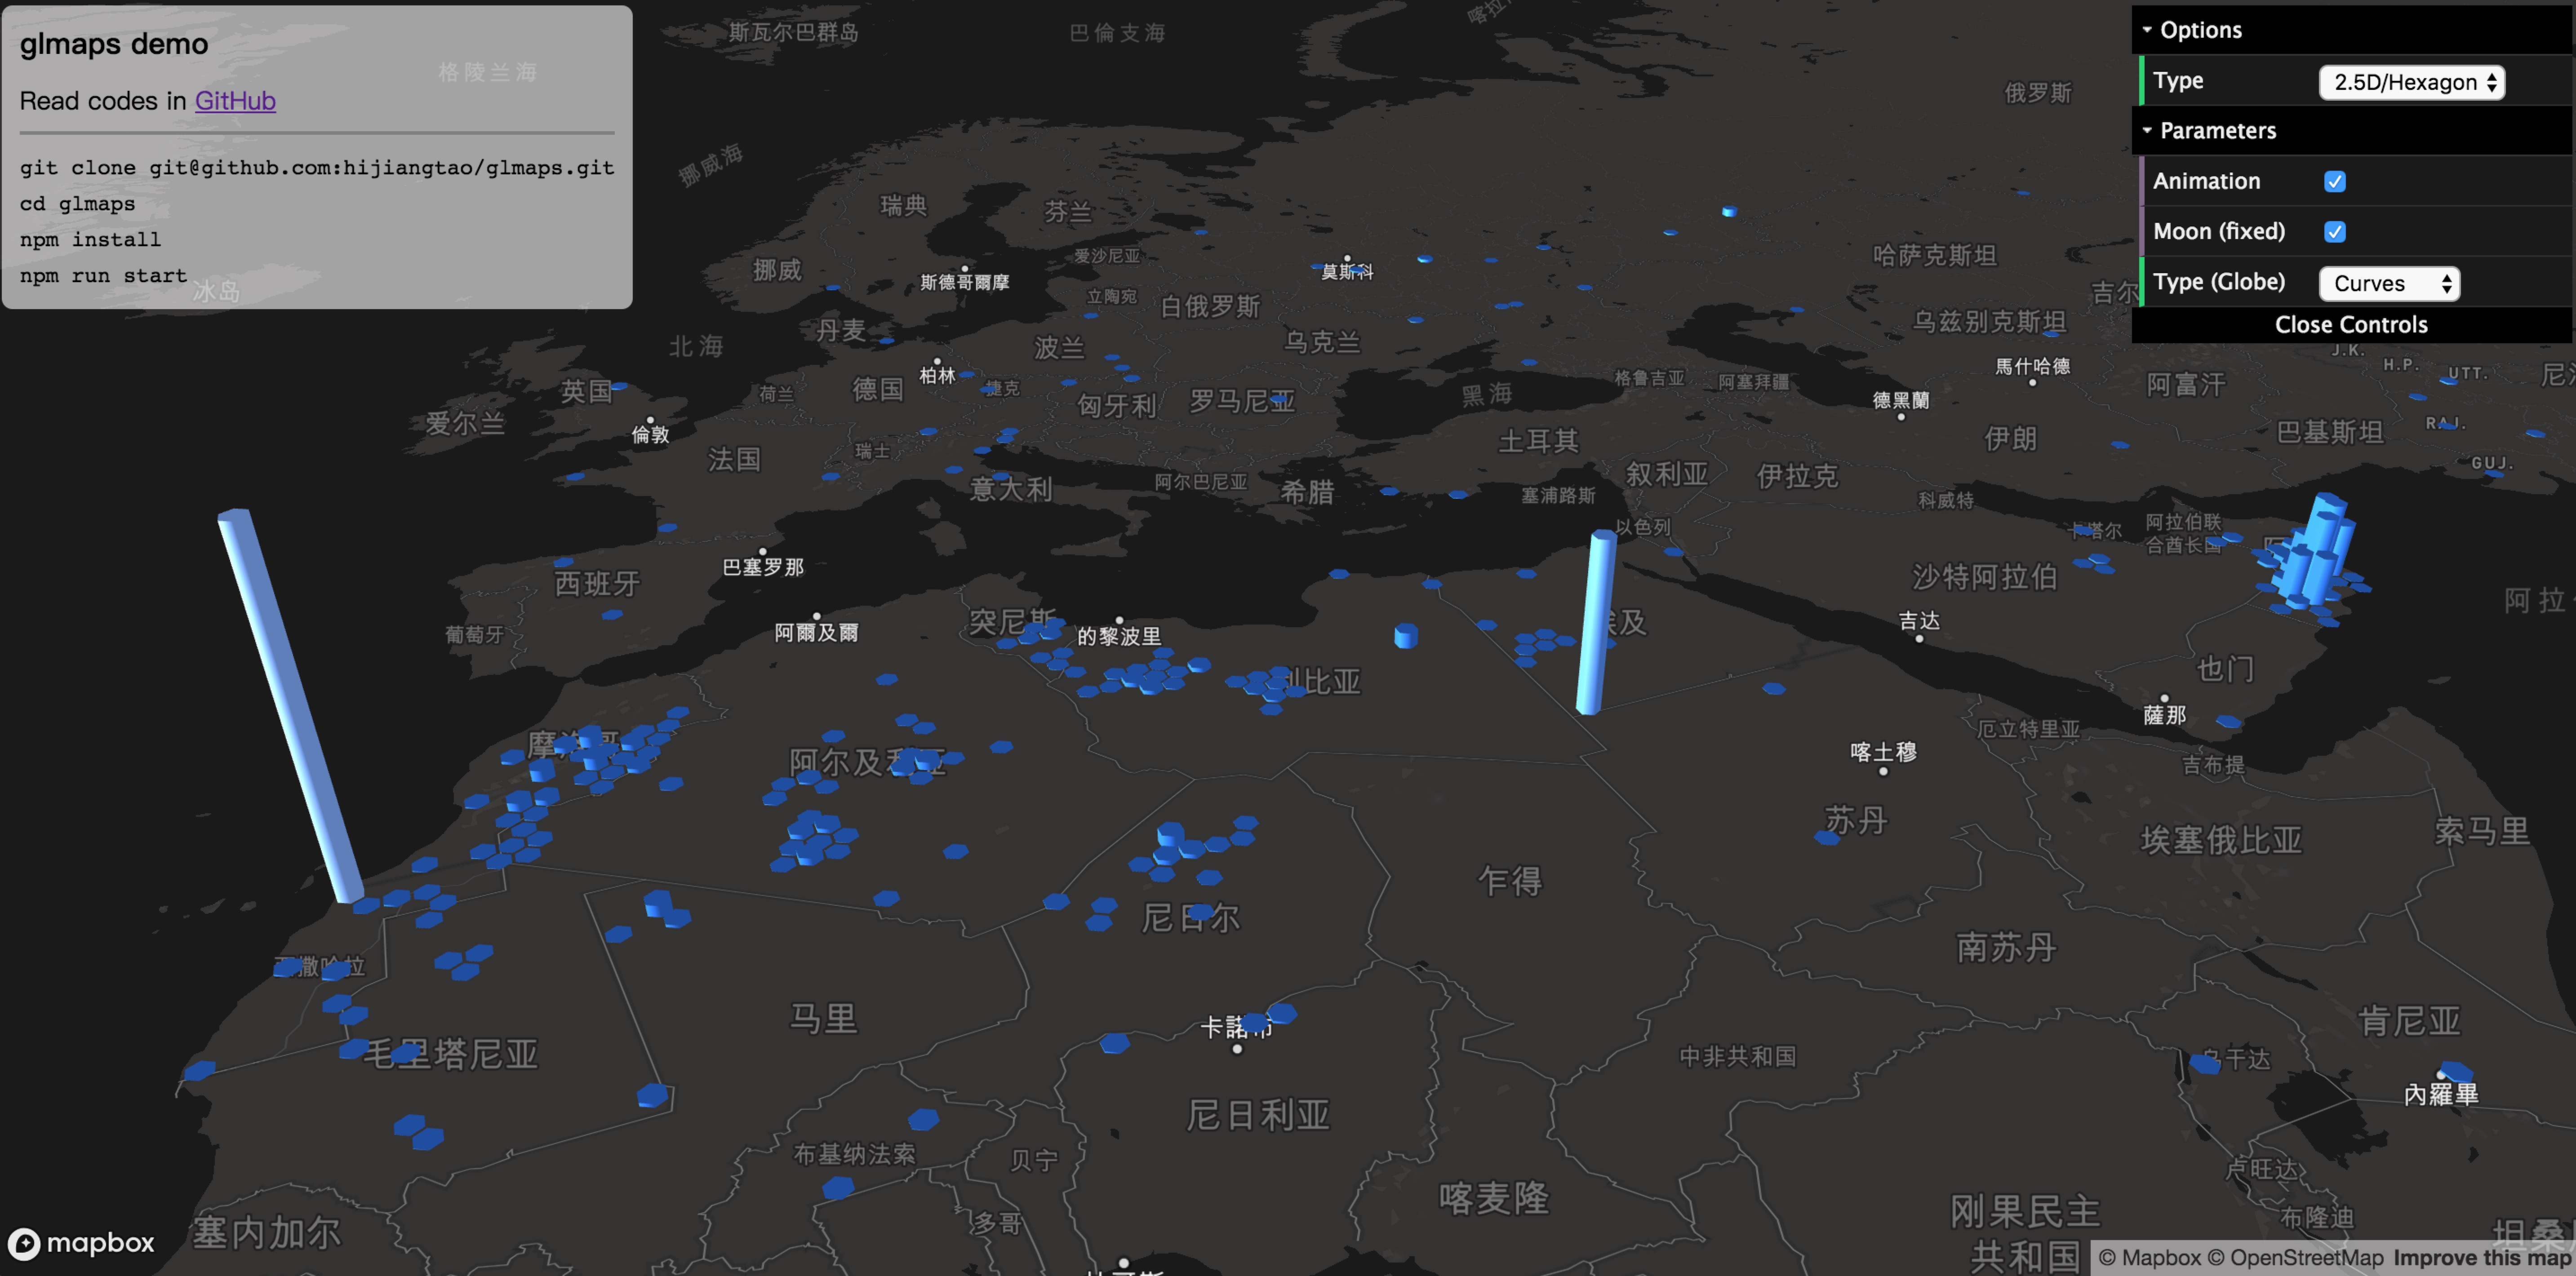 |
Yes | Yes |
| 2.5D / Grid | Support Coverage Filter Conditions | 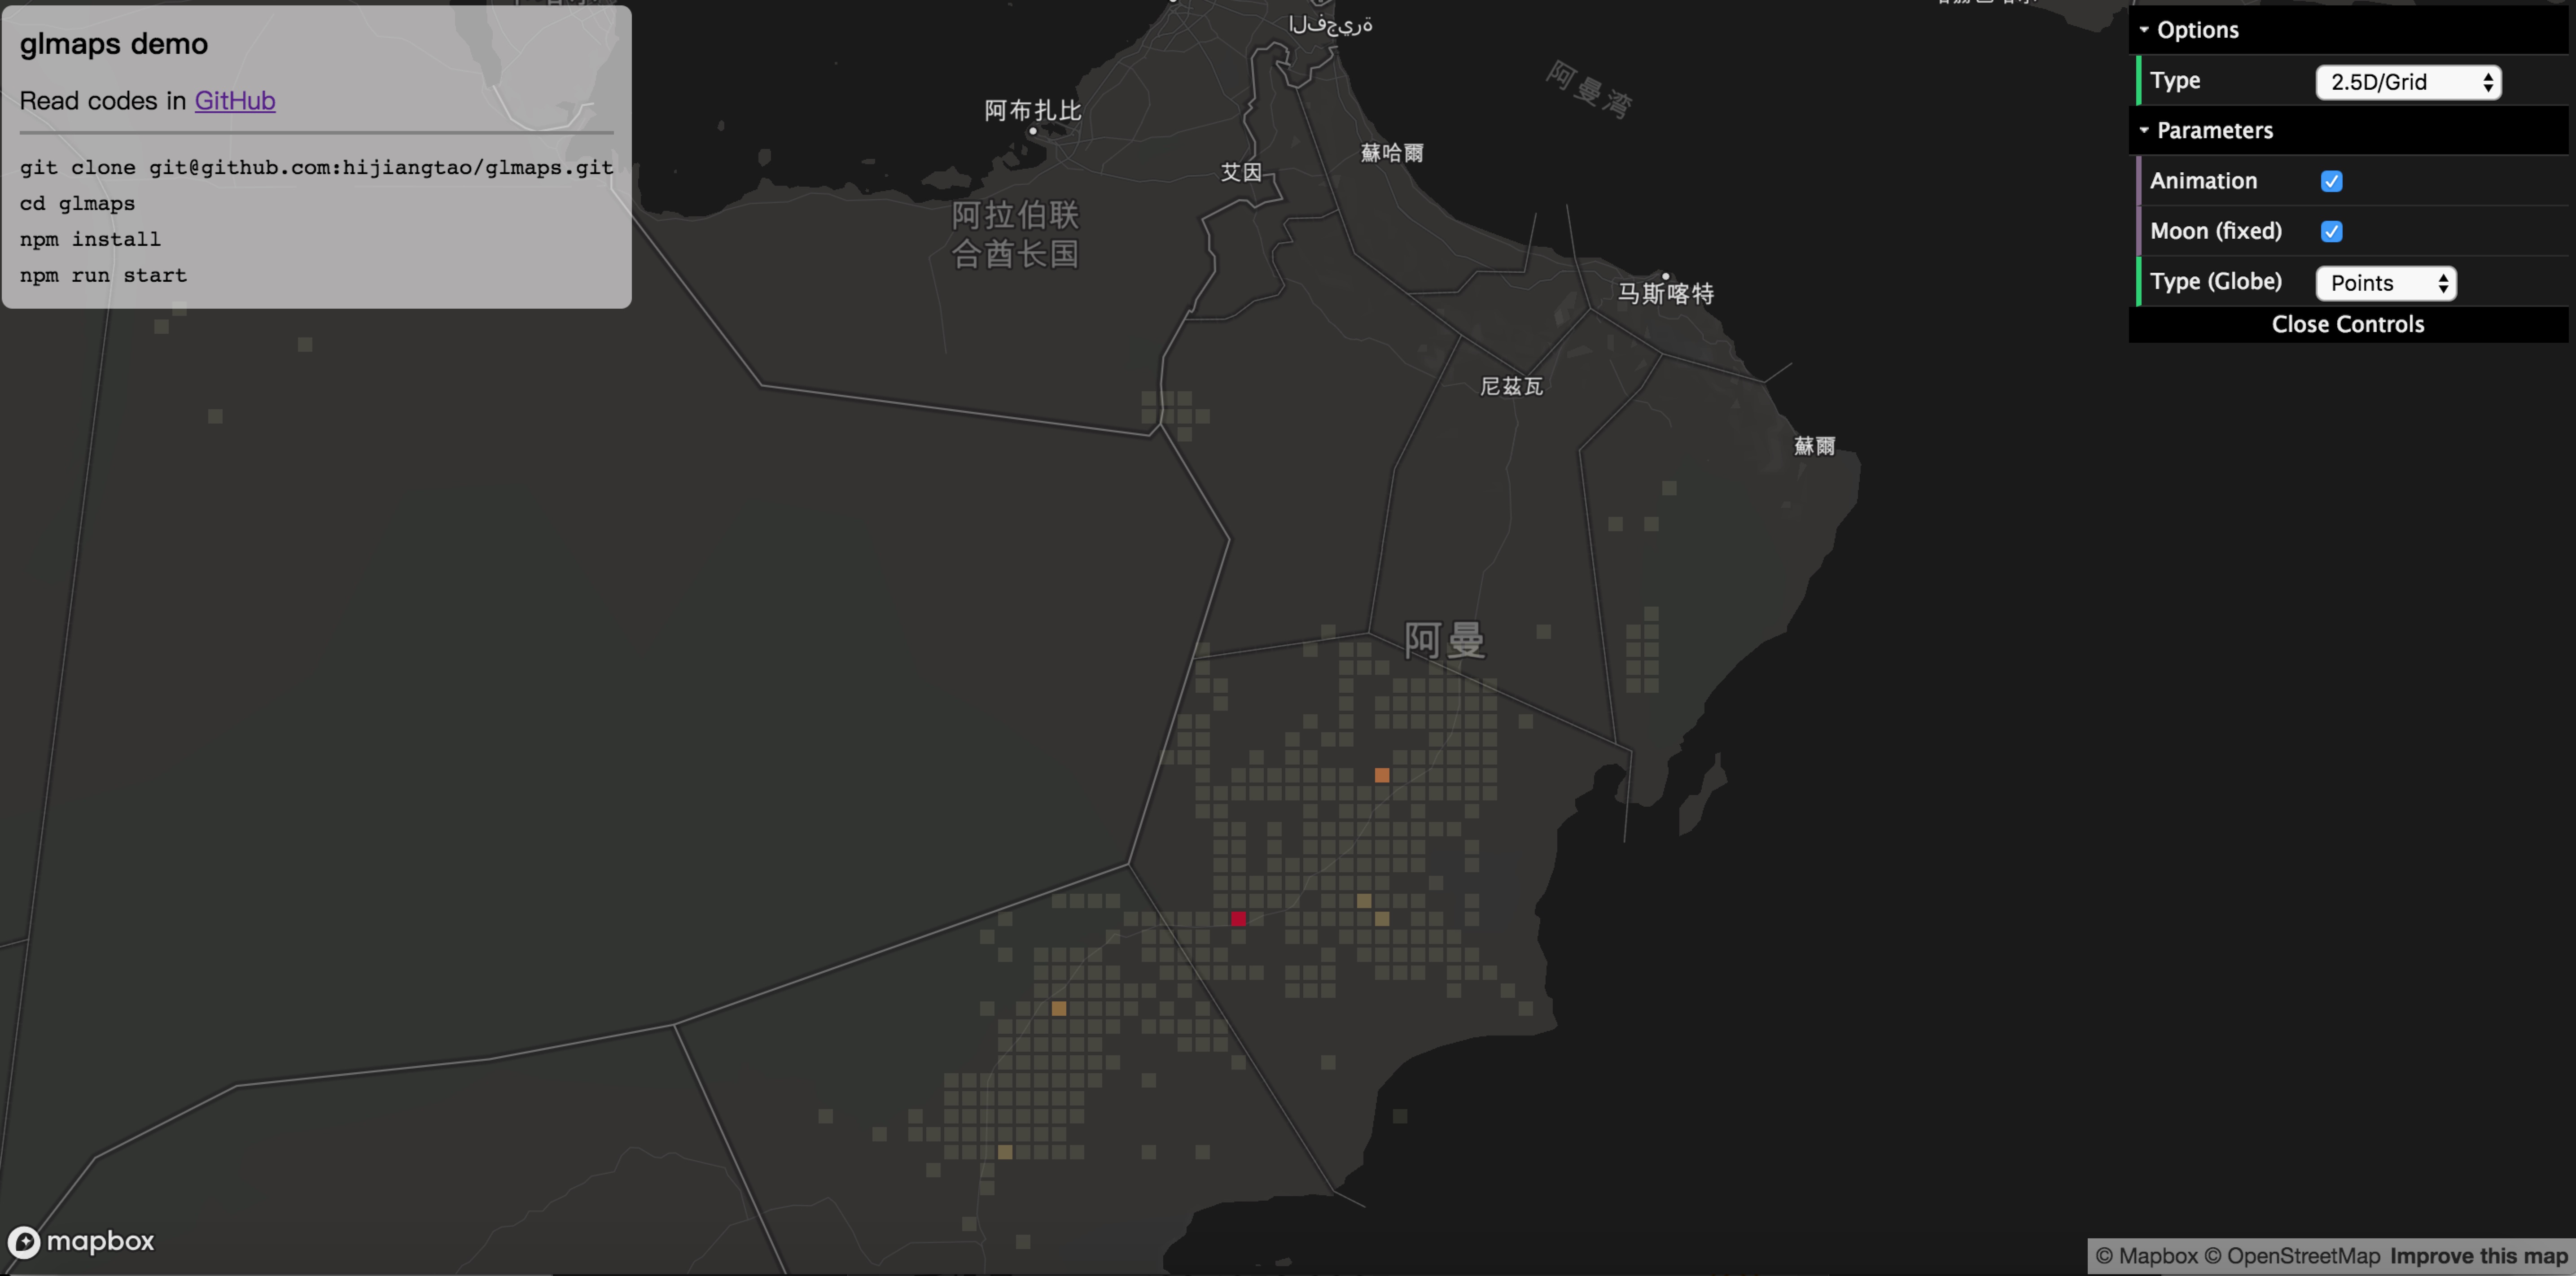 |
No | Yes |
| 2.5D / Trip | No modification from deck | 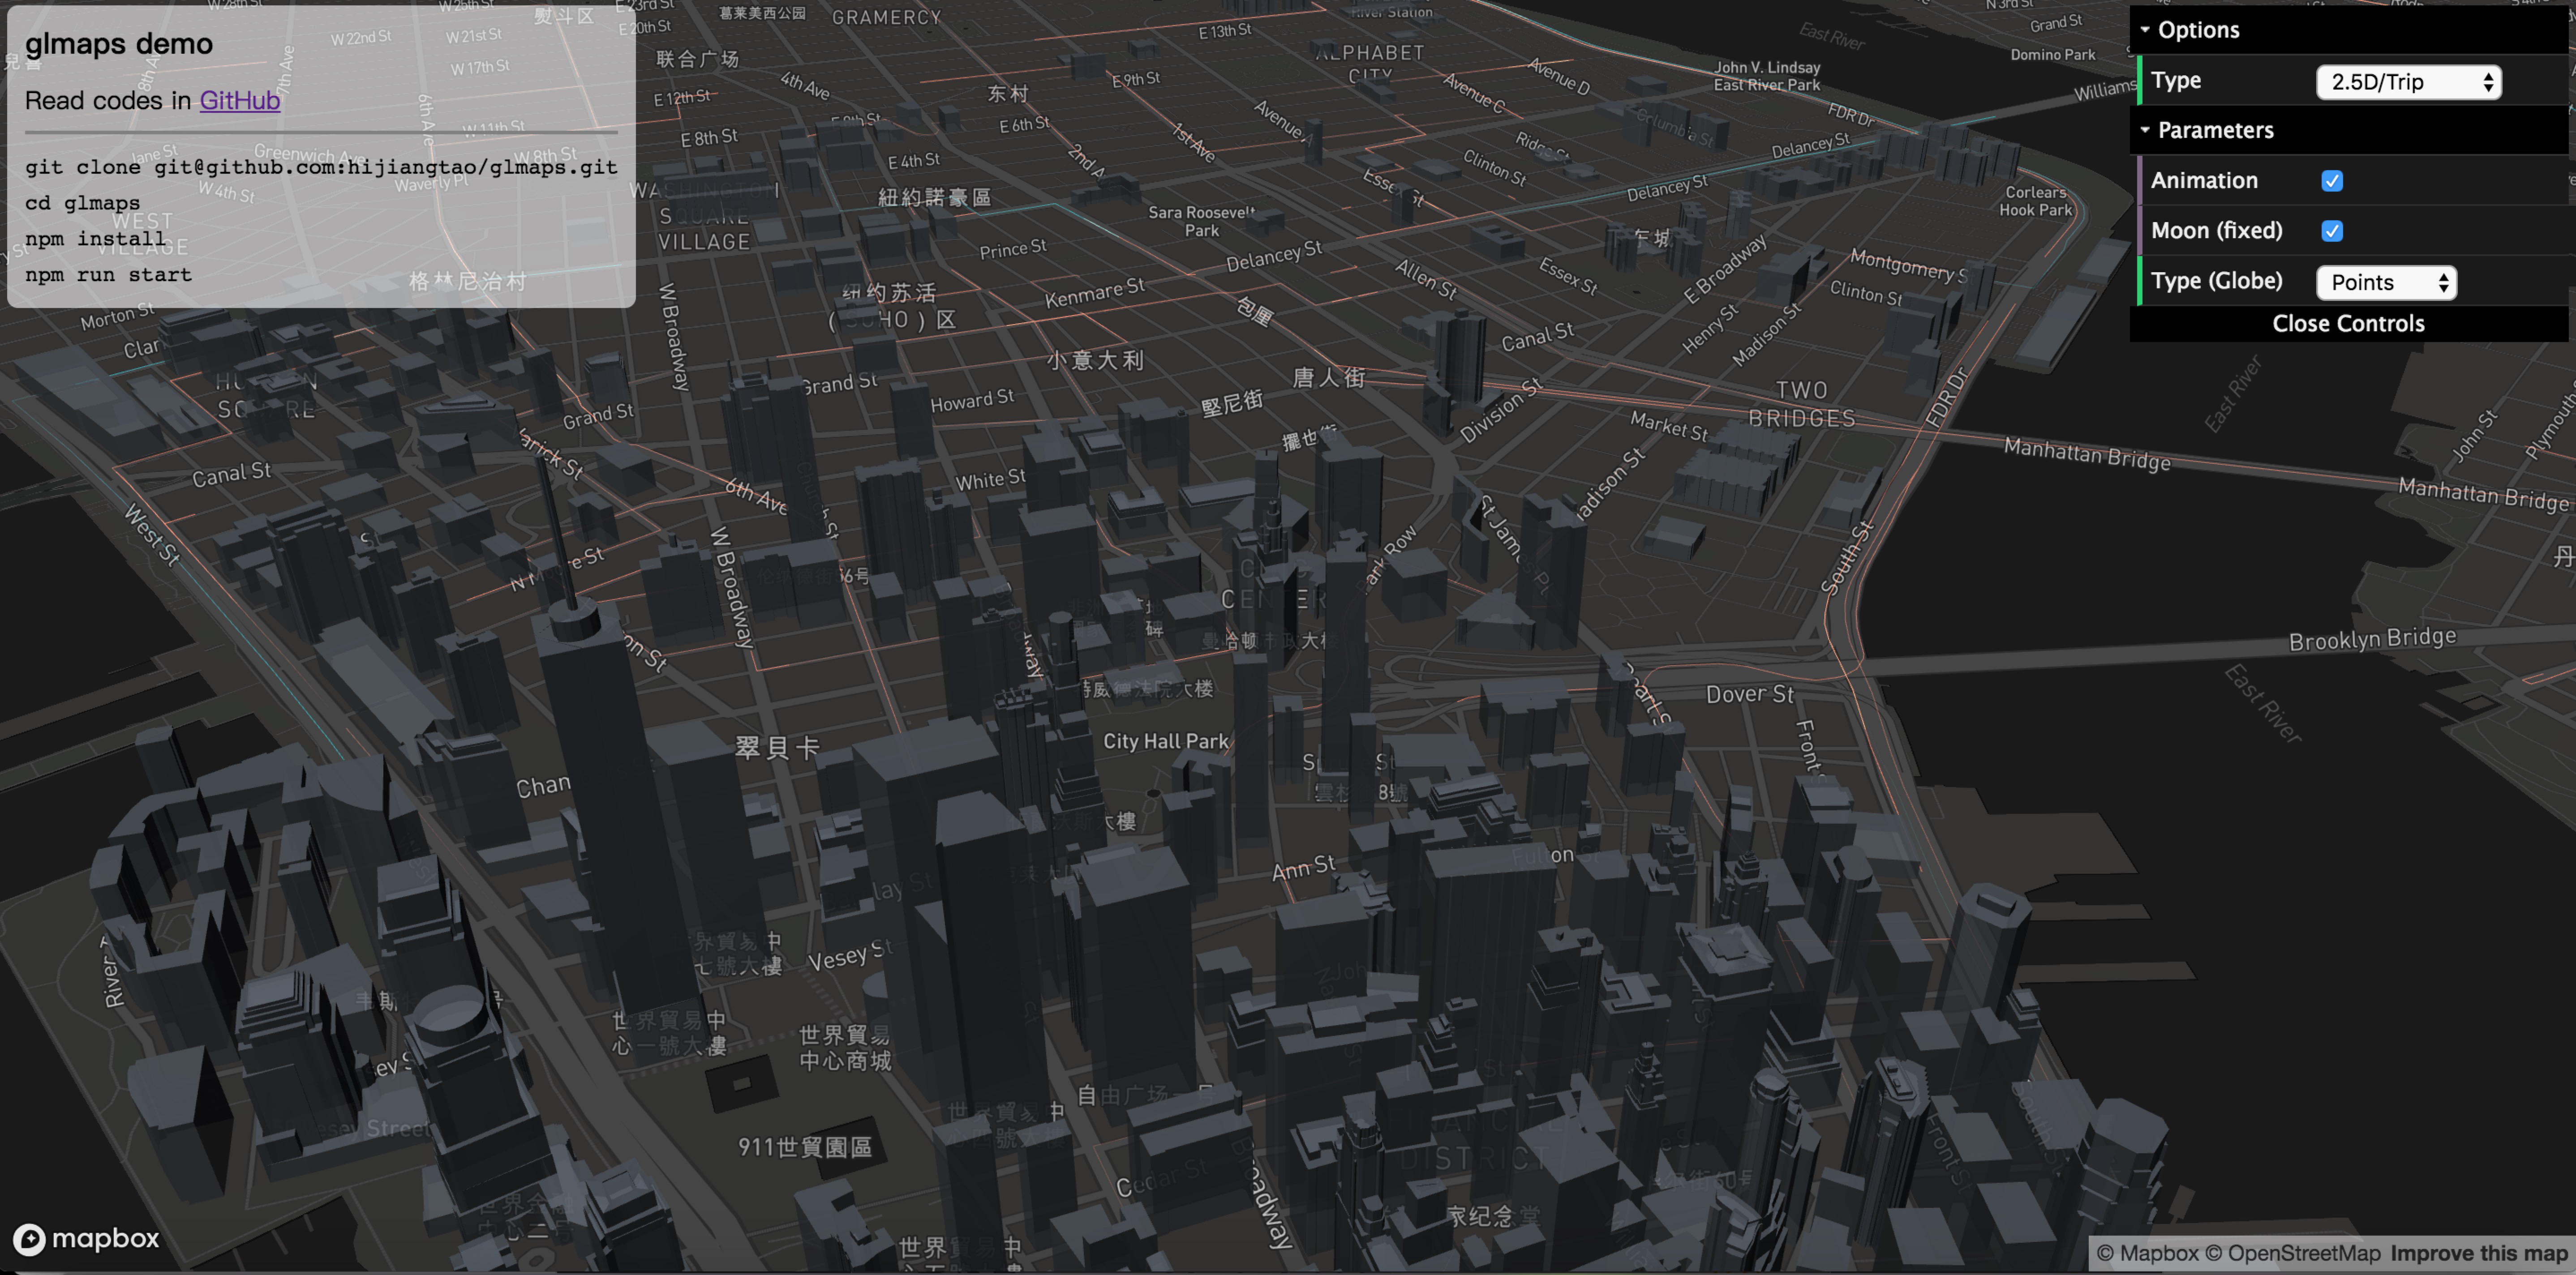 |
Yes | No |
| 2.5D / Cube | No modification from deck | No | No | |
| Other / Segment | The same as curve animation | 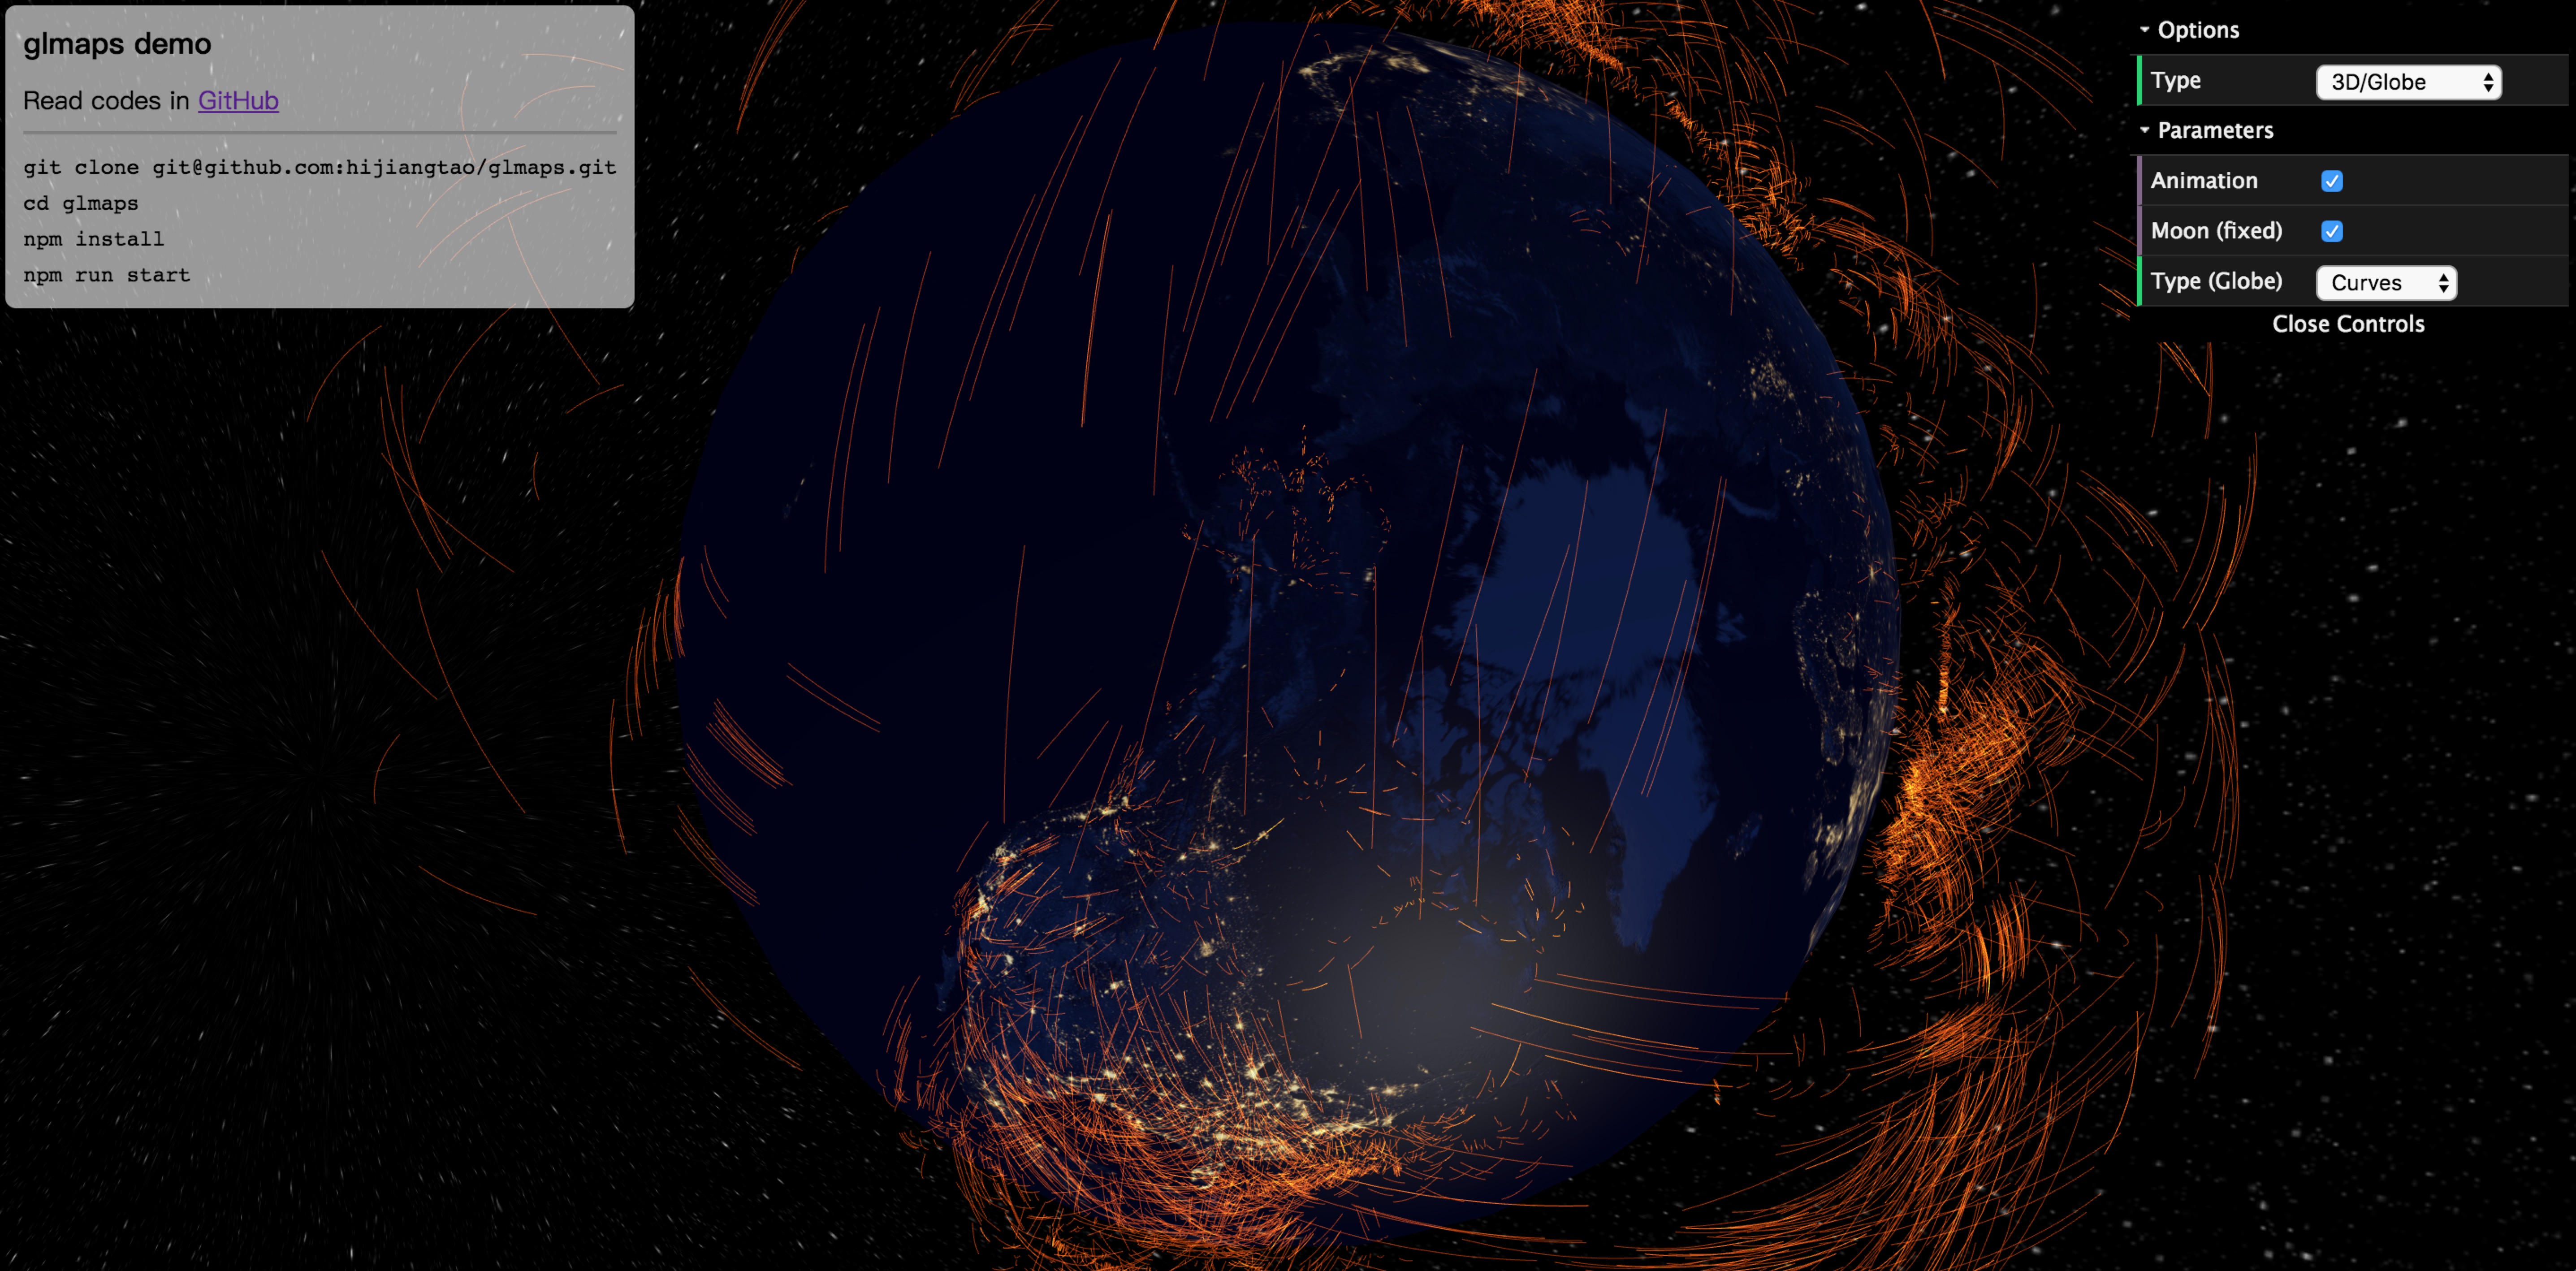 |
No | No |
| Other / Moon | Earth-Moon System | 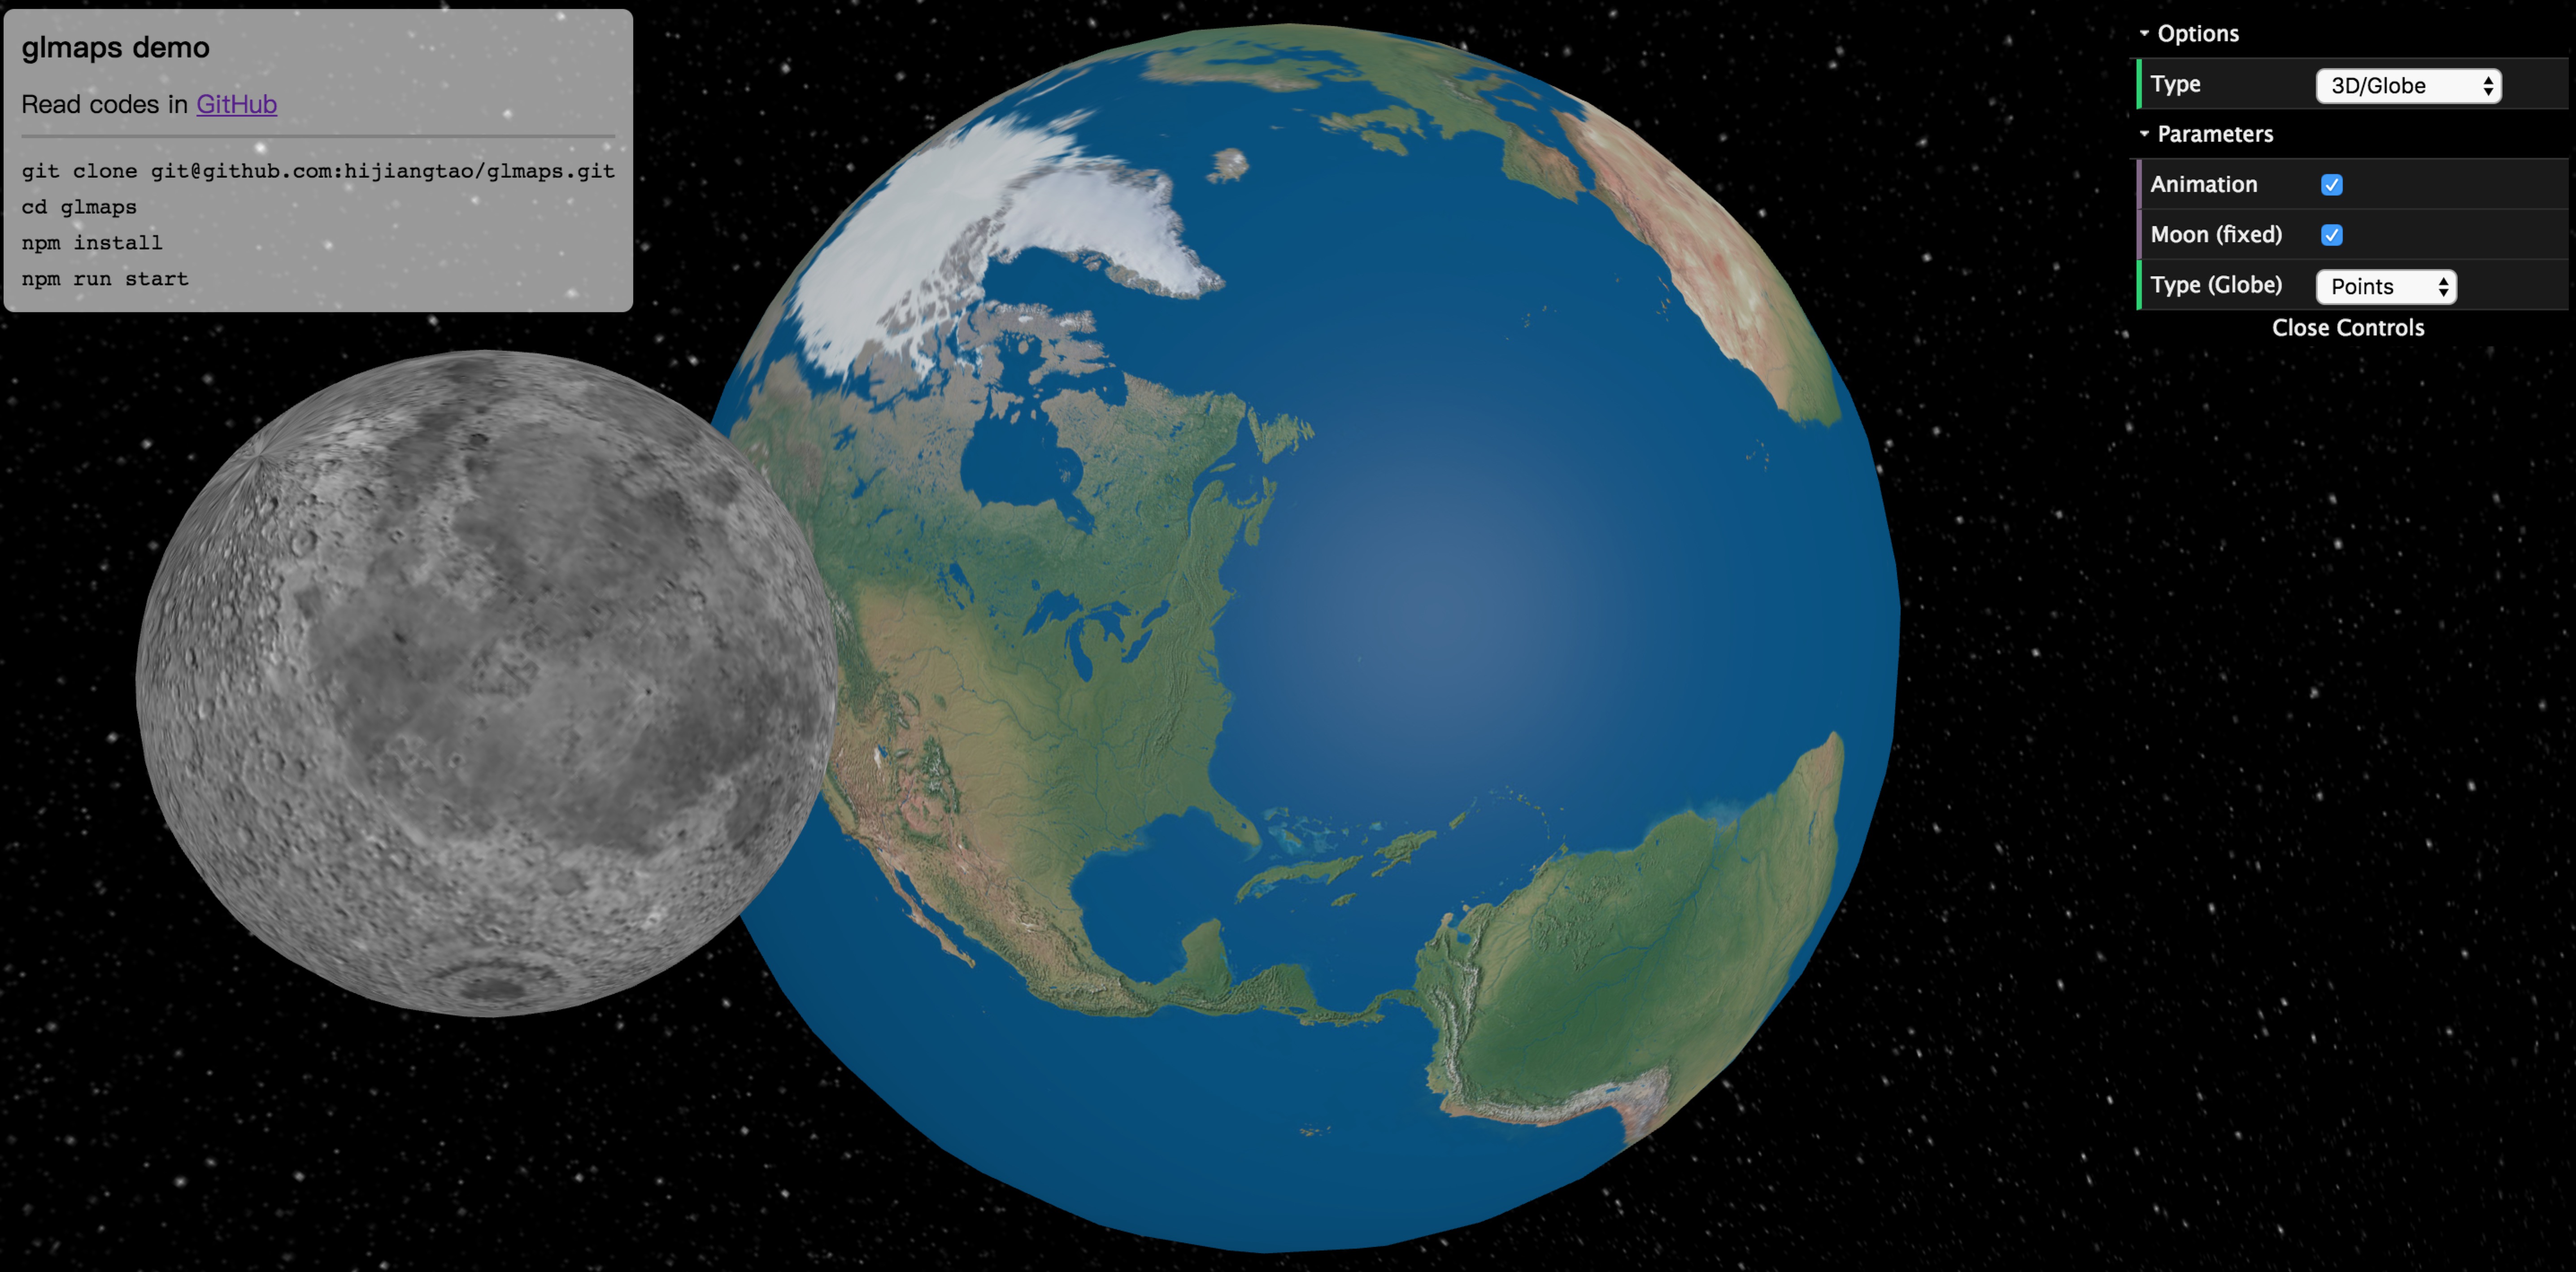 |
No | No |
ZERO
Thanks for your attention in this project, there are some thoughts from me that you may pay attention before have future reading.
Q: What frameworks are used in glmaps?
React Hooks is ready in 16.8.0, and glmaps get benefits from it at once, if you are not familiar with it, please check Introducing Hooks first; On the other hand, deck.gl is WebGL2 powered geospatial visualization layers, so please make sure your browser support WebGL2. To find out if WebGL(2) is enabled in your browser, go to http://get.webgl.org/ or https://get.webgl.org/webgl2/.
Besides, if you meet any errors when depoly it locally, you can describe your problem with issues, because that's most likely a problem of glmaps rather than yourself, since glmaps organizes local development environment from scratch, such as webpack, babel, etc.
Q: Guidance for visualization beginners?
I highly recommend you follows these steps in using glmaps:
- Learn how to install three.js and deck.gl from scratch, and code your first "Hello World" with them;
- Run official demos and get familiar with their API;
- Follow the tutorials step by step to make your visualization examples more powerful, or check
glmapscodes insrcfolder directly; - (Optional) Use
glmapsin your demo application, start withnpm install glmaps --save; - Rewrite
glmapsexample with your own codes; - Congratulations on mastering basics of spatio-temporal visualization, you can use
three.jsanddeck.glto draw a more fantastic world with spatio-temporal data!
Q: How to participate in glmaps project?
glmaps is still at the very beginning period of my thoughts, you are welcome to oepn ISSUE, PR or email me, if you have any ideas on how to make glmaps better for visualization beginners:
- Participate in implementing tutorials together;
- Contribute codes to
glmapswith PR (such as imporvemoveranimation inGlobe); - Speak out your doubts in learning data visualization with issues;
- Tell me your advice on how to make
glmapsbetter with issues; - Other aspects not included yet.
Demo
Open browser and enter https://localhost:8080 to check the demo locally. Please enjoy the power of three.js and deck.gl.
git clone [email protected]:hijiangtao/glmaps.git
cd glmaps
npm install
touch devconfigs.js
To use any of Mapbox's APIs, you'll need a Mapbox access token. Mapbox uses access tokens to associate requests to API resources with your account. Since TOKEN is a private key, glmaps doesn't provide it in codes, you need to specify it in file devconfigs.js.
Here's what an access token looks like (focus on the string starts with pk., replace it with your own token. You can create your mapbox Token here) and the devconfigs.js file format:
// devconfigs.js
const MAPBOX_TOKEN = 'pk.eyJ1IjoiaGlqaWFuZ3RhbyIsImEiOiJjampxcjFnb3E2NTB5M3BvM253ZHV5YjhjIn0.WneUon5qFigfJRJ3oaZ3Ow';

export {
  MAPBOX_TOKEN,
}
Tips: You can utilize Search engine to get other's mapbox tokens if you don't want to create a new one, here's one token I got from GitHub Search: 'pk.eyJ1IjoiY3NuIiwiYSI6ImNpdnRvam1qeDAwMXgyenRlZjZiZWc1a2wifQ.Gr5pLJzG-1tucwY4h-rGdA', though it's not recommend to "steal" other's token…
Save changes in devconfigs.js and go on:
npm run start
When glmaps is ready, it will open browser automatically, and render demos for you.
Tutorials
A series of spatio-temporal data visualization tutorials that guide you how to code these visualization examples step by step. TBD.
- Visualization Tutorials from scratch (I) - Introduction of data visualization with three.js
- Visualization Tutorials from scratch (II) - Introduction of data visualization with deck.gl
- Visualization Tutorials from scratch (III) - Manage your three.js application with React
- Visualization Tutorials from scratch (IV) - Draw a earth-moon system with three.js from scratch
- Visualization Tutorials from scratch (V) - How to draw curve, mover and cube with three.js
- Visualization Tutorials from scratch (VI) - Animate your layers with props and transitions
- Visualization Tutorials from scratch (VII) - Animate your deck.gl with customized shaders
- Visualization Tutorials from scratch (VIII) - Some tips in data visualization with deck.gl and three.js
Install
The installation is for developers who wants to use glmaps in their demos.
cd YOUR_REPO
npm install glmaps --save
Usage
This is a package mainly designed for visualization lovers in learning Three.js and Deck.gl, however, you can use them as a normal package as other packages in npm.
import React from 'react';
import {Globe} from 'glmaps';

/**
 * Data format:
 * [
 *   [
 *      source.lat,
 *      source.lng,
 *      target.lat,
 *      target.lng,
 *   ],
 *   ...
 * ]
 */
const Demo = (props) => {
  return (
    <Globe
      data={props.data}
      id={YOUR_MOUNT_DOM_ID}
      animate={true}
      moon={true}
      visType={'curve'}
    />
  )
};
More examples and detailed usage guidances can be found in documents.
Documents
This part is still under constructing, however, you can access full codes in src folder right now.
-
Layers (2.5D Map)
- ArcLayer
- HexagonLayer
- IconLayer
- ScatterplotLayer
- ScreenGridLayer
- TripLayer
-
Globe (3D Space)
- Curve
- Mover
- Cube
- Moon
src
├── globe
│   ├── CubeMesh.js
│   ├── Curve.js
│   ├── Mover.js
│   ├── README.md
│   ├── SceneManager.js
│   ├── Tube.js
│   ├── constants.js
│   ├── index.js
│   ├── index.less
│   └── utils.js
├── index.js
└── layers
    ├── AnimationLayer
    │   └── index.js
    ├── ArcLayer
    │   ├── animate.js
    │   └── index.js
    ├── HexagonLayer
    │   └── index.js
    ├── IconLayer
    │   ├── cluster.js
    │   ├── icon-mapping.js
    │   └── index.js
    ├── README.md
    ├── ScatterplotLayer
    │   └── index.js
    ├── ScreenGridLayer
    │   └── index.js
    └── TripLayer
        └── index.js
Resources
You are welcome to raise PR to add more contents of this part, let's contribute together to make it more valuable.
1. Online Book/Series
2. Video Tutorials
TBD
Stories
Q: Why I create this repositry?
A: I am really impressed by many open source developers when I learning how to visualize data on Web. They had contributed a lof of codes and resources in guiding beginners. This year, I want to take visualization as a serious work to do in my spare time. I will keep on record what I learned in my blog, at the same time I want to share more and hope my notes and codes can raise your interests in data visualization, too. Keep Simple and Love Visualization.
Contact
LICENSE
MIT