EdgeOS
Description
Provides an integration between EdgeOS (Ubiquiti) routers to Home Assistant.
How to
Installation
Look for "Integration with EdgeOS (Ubiquiti)" and install
Requirements
- EdgeRouter with at least firmware version 2.0
- EdgeRouter User with 'Operator' level access or higher
- Traffic Analysis set to 'Enabled' (both
dpiandexportenabled undersystem/traffic-analysis)
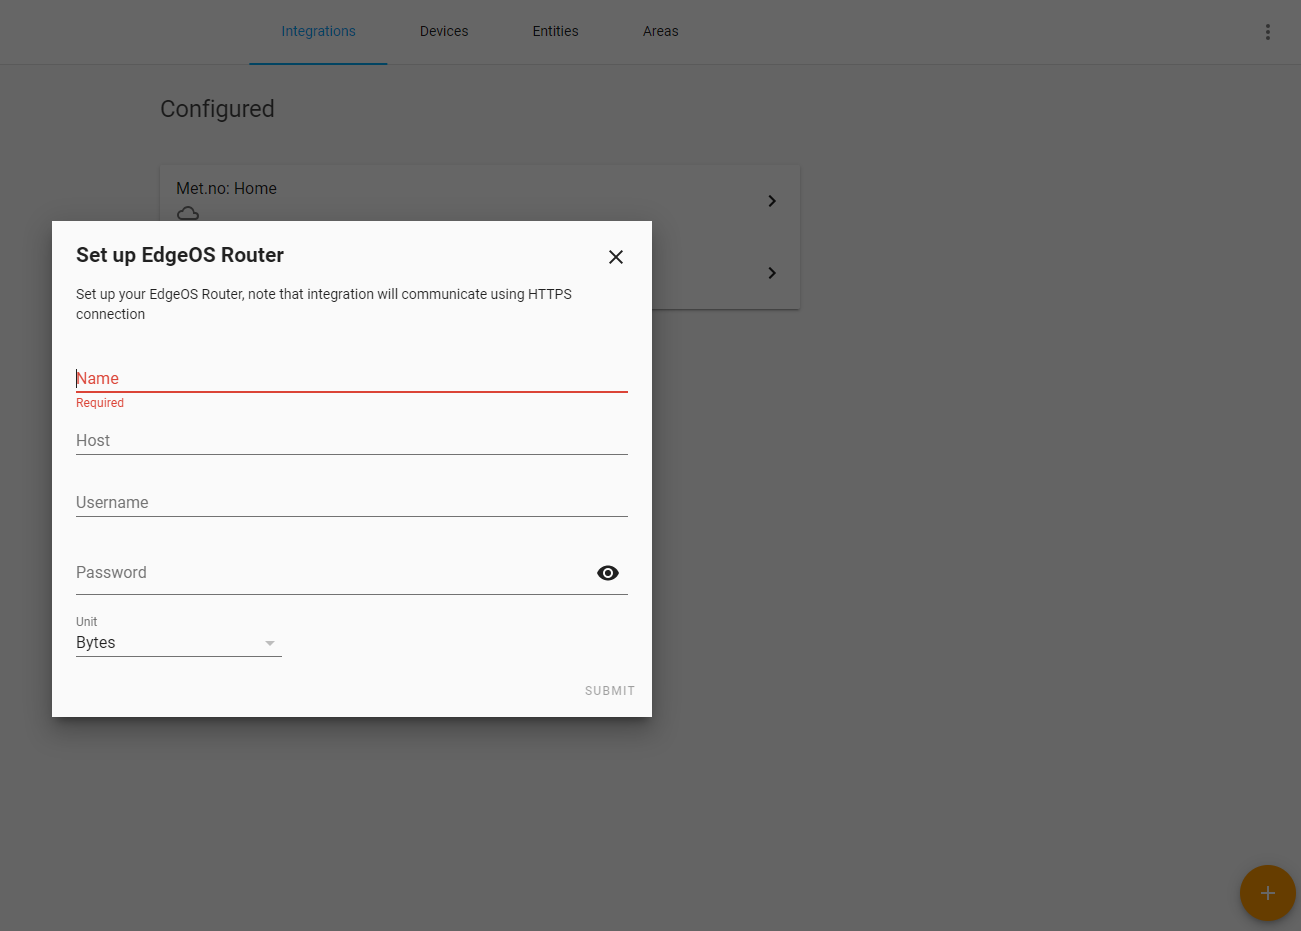
Setup
To add integration use Configuration -> Integrations -> Add EdgeOS
Integration supports multiple EdgeOS devices
| Fields name | Type | Required | Default | Description |
|---|---|---|---|---|
| Name | Textbox | + | - | Represents the integration name |
| Host | Textbox | + | - | Hostname or IP address to access EdgeOS device |
| Username | Textbox | + | - | Username of user with Operator level access or higher, better to create a dedicated user for that integration for faster issues identification |
| Password | Textbox | + | - | |
| Unit | Drop-down | + | Bytes | Unit for sensors, available options are: Bytes, KiloBytes, MegaBytes |
EdgeOS Device validation errors
| Errors |
|---|
| Cannot reach device (404) |
| Invalid credentials (403) |
| General authentication error (when failed to get valid response from device) |
| Could not retrieve device data from EdgeOS Router |
| Export (traffic-analysis) configuration is disabled, please enable |
| Deep Packet Inspection (traffic-analysis) configuration is disabled, please enable |
| Unsupported firmware version |
Encryption key got corrupted
If a persistent notification popped up with the following message:
Encryption key got corrupted, please remove the integration and re-add it
It means that encryption key was modified from outside the code, Please remove the integration and re-add it to make it work again.
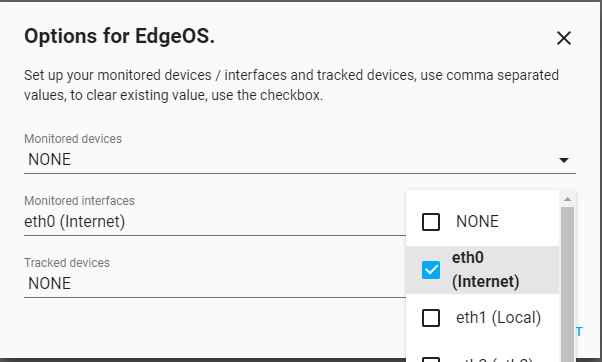
Options
Configuration -> Integrations -> {Integration} -> Options
| Fields name | Type | Required | Default | Description |
|---|---|---|---|---|
| Host | Textbox | + | - | Hostname or IP address to access EdgeOS device |
| Username | Textbox | + | - | Username of user with Operator level access or higher, better to create a dedicated user for that integration for faster issues identification |
| Password | Textbox | + | - | |
| Clear credentials | Check-box | + | Unchecked | Will reset username and password (Not being stored under options) |
| Unit | Drop-down | + | Bytes | Unit for sensors, available options are: Bytes, KiloBytes, MegaBytes |
| Consider away interval | Textbox | + | 180 | Consider away interval in seconds |
| Monitored devices | Drop-down | + | NONE | Devices to monitor using binary_sensor and sensor |
| Monitored interfaces | Drop-down | + | NONE | Interfaces to monitor using binary_sensor and sensor, |
| Track | Drop-down | + | NONE | Devices to track using device_trac |
| Update API Interval | Textbox | + | 60 | Number of seconds to update new devices and router settings |
| Update Entities Interval | Textbox | + | 1 | Number of seconds to update entities |
| Save debug file | Check-box | + | Unchecked | Will store debug file, more details below (Not being stored under options) |
| Log level | Drop-down | + | Default | Changes component's log level (more details below) |
| Log incoming messages | Check-box | + | Unchecked | Whether to log as DEBUG incoming web-socket messages or not |
Log Level's drop-down
New feature to set the log level for the component without need to set log_level in customization: and restart or call manually logger.set_level and loose it after restart.
Upon startup or integration's option update, based on the value chosen, the component will make a service call to logger.set_level for that component with the desired value,
In case Default option is chosen, flow will skip calling the service, after changing from any other option to Default, it will not take place automatically, only after restart
Save debug file
Will store debug data from the component to .storage/edgeos.debug.json
Debugging
To set the log level of the component to DEBUG, please set it from the options of the component if installed, otherwise, set it within configuration YAML of HA:
logger:
  default: warning
  logs:
    custom_components.edgeos: debug
Components
Default
| Name | Type | State | Attributes |
|---|---|---|---|
| {Integration Name} System Status | Binary Sensor | Connected or not | CPU Memory Up-time API Last Update WS Last Update |
| {Integration Name} Unknown Devices | Sensor | Number of unknown devices | Unknown Devices description |
Monitored Devices
| Name | Type | State | Attributes |
|---|---|---|---|
| {Integration Name} Device {Device Name} | Binary Sensor | Connected or not | IP MAC Name {Unit}Bytes (Sent) {Unit}Bytes/ps (Sent) {Unit}Bytes (Received) {Unit}Bytes/ps (Received) Last Activity Last Changed |
| Name | Type | State | Attributes |
|---|---|---|---|
| {Integration Name} Device {Device Name} | Binary Sensor | Connected or not | MAC Address |
| {Integration Name} Device {Device Name} Traffic (Received) | Sensor | Total Increasing - Unit* | |
| {Integration Name} Device {Device Name} Traffic (Sent) | Sensor | Total Increasing - Unit* | |
| {Integration Name} Device {Device Name} Rate (Received) | Sensor | Measurement - Unit* | |
| {Integration Name} Device {Device Name} Rate (Sent) | Sensor | Measurement - Unit* |
Unit of measurement for Traffic and Rate are according to the unit settings of the integration
Monitored Interfaces
| Name | Type | State | Attributes |
|---|---|---|---|
| {Integration Name} Interface {Interface Name} | Binary Sensor | Connected or not | Duplex Link Speed (Mbps) Address |
| {Integration Name} Interface {Interface Name} Packets (Received) | Sensor | Total Increasing - Packets | |
| {Integration Name} Interface {Interface Name} Packets (Sent) | Sensor | Total Increasing - Packets | |
| {Integration Name} Interface {Interface Name} Traffic (Received) | Sensor | Total Increasing - Unit* | |
| {Integration Name} Interface {Interface Name} Traffic (Sent) | Sensor | Total Increasing - Unit* | |
| {Integration Name} Interface {Interface Name} Errors (Received) | Sensor | Total Increasing - Errors | |
| {Integration Name} Interface {Interface Name} Errors (Sent) | Sensor | Total Increasing - Errors | |
| {Integration Name} Interface {Interface Name} Dropped Packets (Received) | Sensor | Total Increasing - Packets | |
| {Integration Name} Interface {Interface Name} Dropped Packets (Sent) | Sensor | Total Increasing - Packets | |
| {Integration Name} Interface {Interface Name} Rate (Received) | Sensor | Measurement - Unit* | |
| {Integration Name} Interface {Interface Name} Rate (Sent) | Sensor | Measurement - Unit* | |
| {Integration Name} Interface {Interface Name} Multicast | Sensor | Total Increasing - Packets |
Unit of measurement for Traffic and Rate are according to the unit settings of the integration
Tracked Devices
| Name | Type | State | Attributes |
|---|---|---|---|
| {Integration Name} {Device Name} | Device Tracker | Home or Away | Host IP MAC Name Last Activity Connected |
Setting up the integration
Setup integration
Edit options