caibirdme / Hand To Hand Optimize Go
Labels
Projects that are alternatives of or similar to Hand To Hand Optimize Go
Tutorial for optimizing golang program
Inspired By cch123's article pprof 和火焰图
There're lots of powerful tools for optimizing golang program and some of those you may have already known but still not used it.So let's get start from a very simple demo,the main.go
Follow the article and change the main.go yourself when needed
But first of all let's have a glimpse of it:
package main

import (
	"bytes"
	"io/ioutil"
	"log"
	"math/rand"
	"net/http"
	_ "net/http/pprof"
)

func main() {
	http.HandleFunc("/test", handler)
	log.Fatal(http.ListenAndServe(":9876", nil))
}

func handler(w http.ResponseWriter, r *http.Request) {
	err := r.ParseForm()
	if nil != err {
		w.Write([]byte(err.Error()))
		return
	}
	log.Println(r.Form)
	doSomeThingOne(10000)
	buff := genSomeBytes()
	b, err := ioutil.ReadAll(buff)
	if nil != err {
		w.Write([]byte(err.Error()))
		return
	}
	w.Write(b)
}

func doSomeThingOne(times int) {
	for i := 0; i < times; i++ {
		for j := 0; j < times; j++ {

		}
	}
}

func genSomeBytes() *bytes.Buffer {
	var buff bytes.Buffer
	for i := 1; i < 20000; i++ {
		buff.Write([]byte{'0' + byte(rand.Intn(10))})
	}
	return &buff
}
Make sure you have imported the net/http/pprof at the top of the code.
The demo above is very simple, it sets up a server and handles the request with the function, handler.The handler does three things:
- ParseForm
- doSomeThingOne
- genSomeBytes
all of them are aiming to simulate the reality.
Then you can run go run main.go to start the server.
Mock Requests
Actually, to optimize your system you should know the bottleneck of it therefore you need put the server into a very busy condition just as in production.That's what wrk does.
For more detail about the wrk,see its github page
Install wrk
To install the wrk,you need only:
- git clone https://github.com/wg/wrk.git
- cd wrk
- make
wrk relies on the openssl and luajit, learn more from its github page
Generating requests
Our demo is listening on the port 9876,so let's generate some requests for that.
./wrk -c400 -t8 -d5m http://localhost:9876/test
-
-c400means we have 400 connections to keep open -
-t8means we use 8 threads to build requests -
-d5mmeans the duration of the test will last for 5 minutes
pprof
Our server is very busy now and we can see some information via browser.
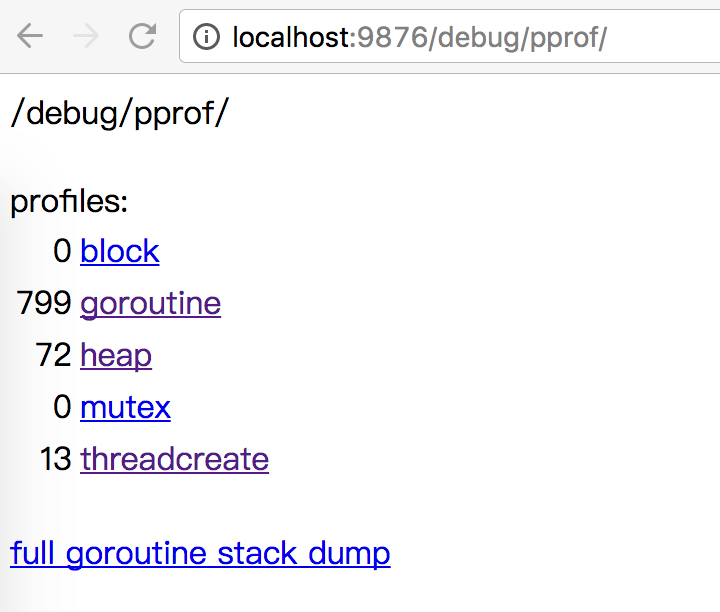
Input localhost:9876/debug/pprof you will see:
The information in this page can't help you find the bottleneck or the bug directly.
- If you think your system is not as fast as you expect, see
localhost:9876/debug/pprof/profile. - If you want to optimize the memory, see
localhost:9876/debug/pprof/heap
In this article I'll just show you how to find the bottleneck in profile,but you can apply the same way into finding the bottleneck of memory.
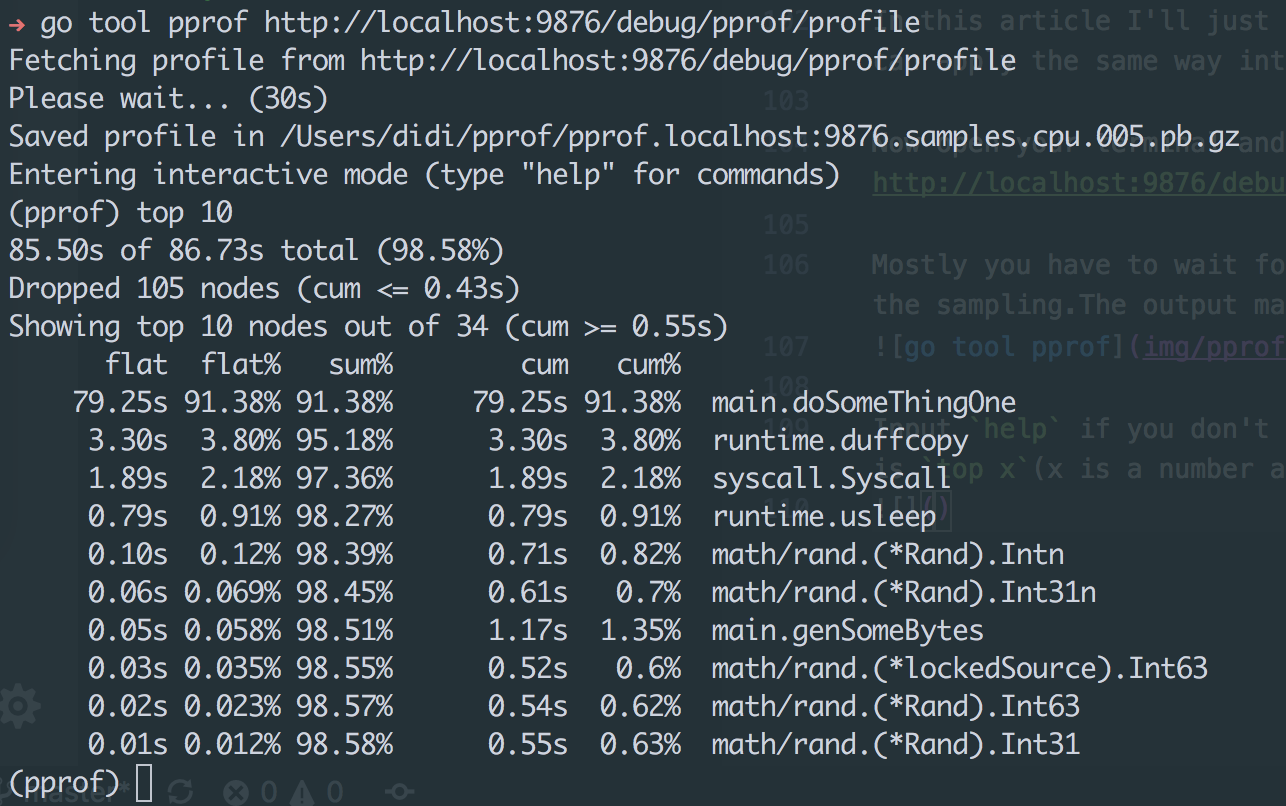
Now open your terminal and run go tool pprof http://localhost:9876/debug/pprof/profile and see what will happen.
Mostly you have to wait for 30s to see the output because pprof need time to do the sampling.The output maybe look like:

Tip: Input help if you don't know what to do
One of the most important commands in pprof is top x(x is a number and default 10).
The report of top 10 is divided into six rows
-
flat: How much time was spent to run the function which is showed in the last column. -
cum: How much time was spend to run the function and functions invoked by it. -
sum%: sum%(line(i)) = flat%(line(i)) + sum%(line(i-1))
The latest output from pprof is different from what you maybe learned before from Profiling Go Programs, but it doesn't matter
You can dope out the meaning of other fields.
Analyse
You can learn easily from the report that our server spent 79.25s out of 86.73s on the function main.doSomethingOne.If we can optimize it to make it run faster,it'll be a huge step forward.
So let's look at the code and see what the function doSomethingOne on earth do.
func doSomeThingOne(times int) {
	for i := 0; i < times; i++ {
		for j := 0; j < times; j++ {

		}
	}
}
Assume that the doSomeThingOne implements an O(N²) algorithim say, the bubble sort.In fact the bubble sort is not always a good choice so we could change doSomeThingOne and implement it with the merge sort(O(NlogN)):
func doSomeThingOne(times int) {
    var inner = int(math.Log2(float64(times)))
	for i := 0; i < times; i++ {
		for j := 0; j < inner; j++ {

		}
	}
}
Test again
- Kill your server process and
go run main.goagain - cd ~/wrk && ./wrk -c400 -t8 -d5m http://localhost:9876/test
- open a new terminal and run
go tool pprof http://localhost:9876/debug/pprof/profile - input
top
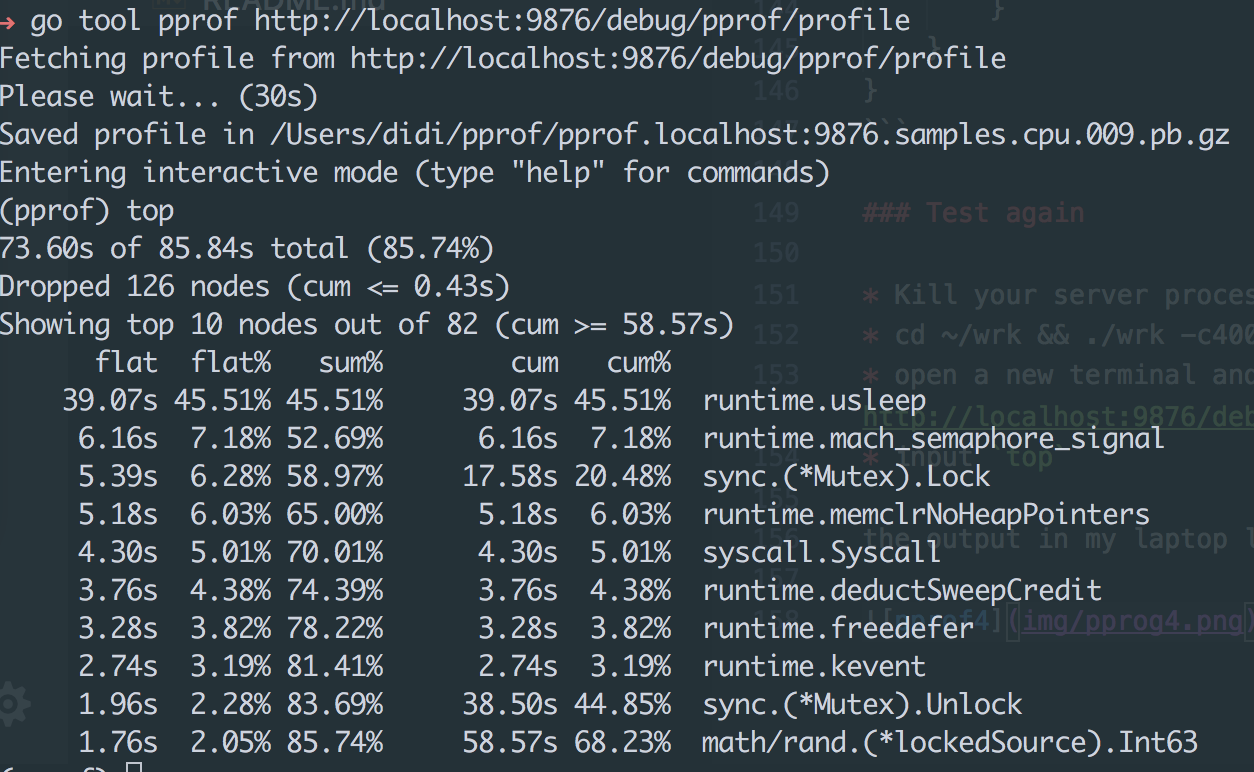
the output in my laptop look like:
You may ask where's thedoSomeThingOne?
In fact it spent so little time out of 85.84s that has been ignored by the counter.
Before we change the doSomeThingOne from O(N²) to O(NlogN),it spent 79.25s out of 86.73s.In our code N equals 10000 so NlogN is around 769 times faster than N².
79s/769 ≈ 0.1s so yes,the result is reasonable.
Effort
How many times our handler run faster than that before?
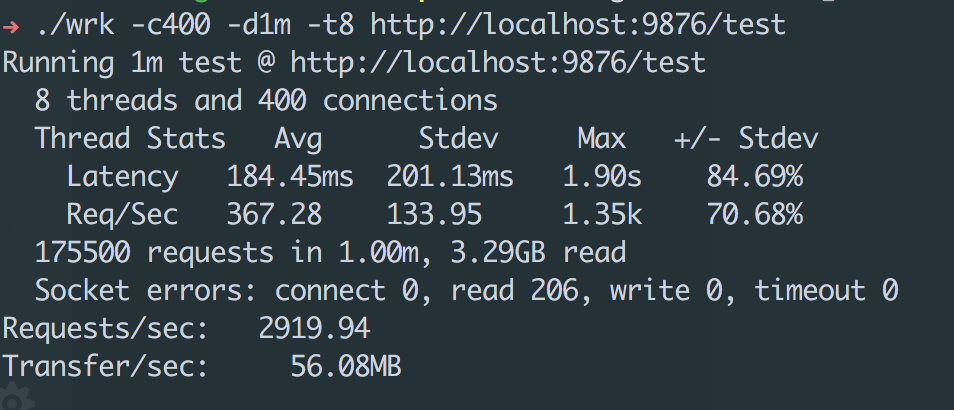
We could find the answer by wrk
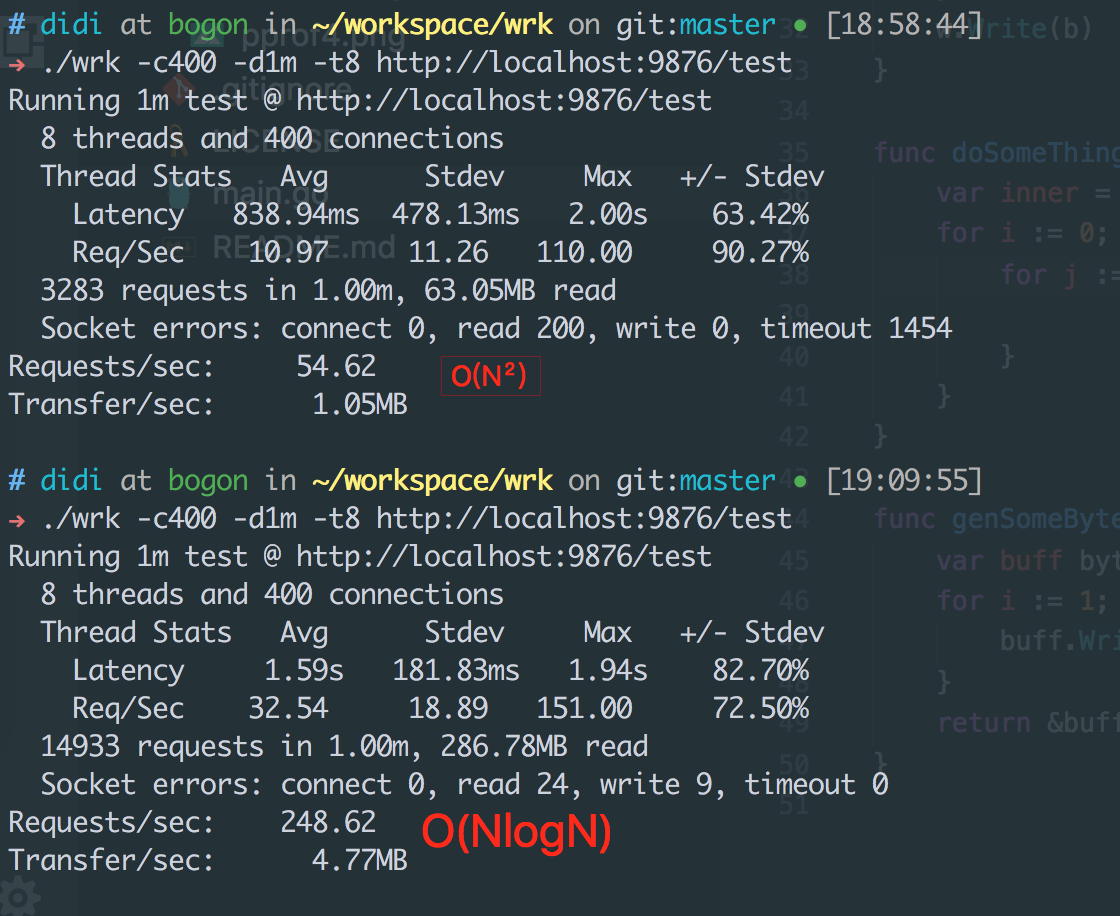
Just Five times faster and far less than we expected.There were many reasons,even how we use the wrk is one of them, but these're not in the scope of this article.
Optimize again
In my eyes,the report of go tool pprof is not so intuitive.We have more powerful tools, yes, the graph.
But before we use it we need install Graphviz first.
On OSX,just run:
brew install graphviz
For other platforms see here
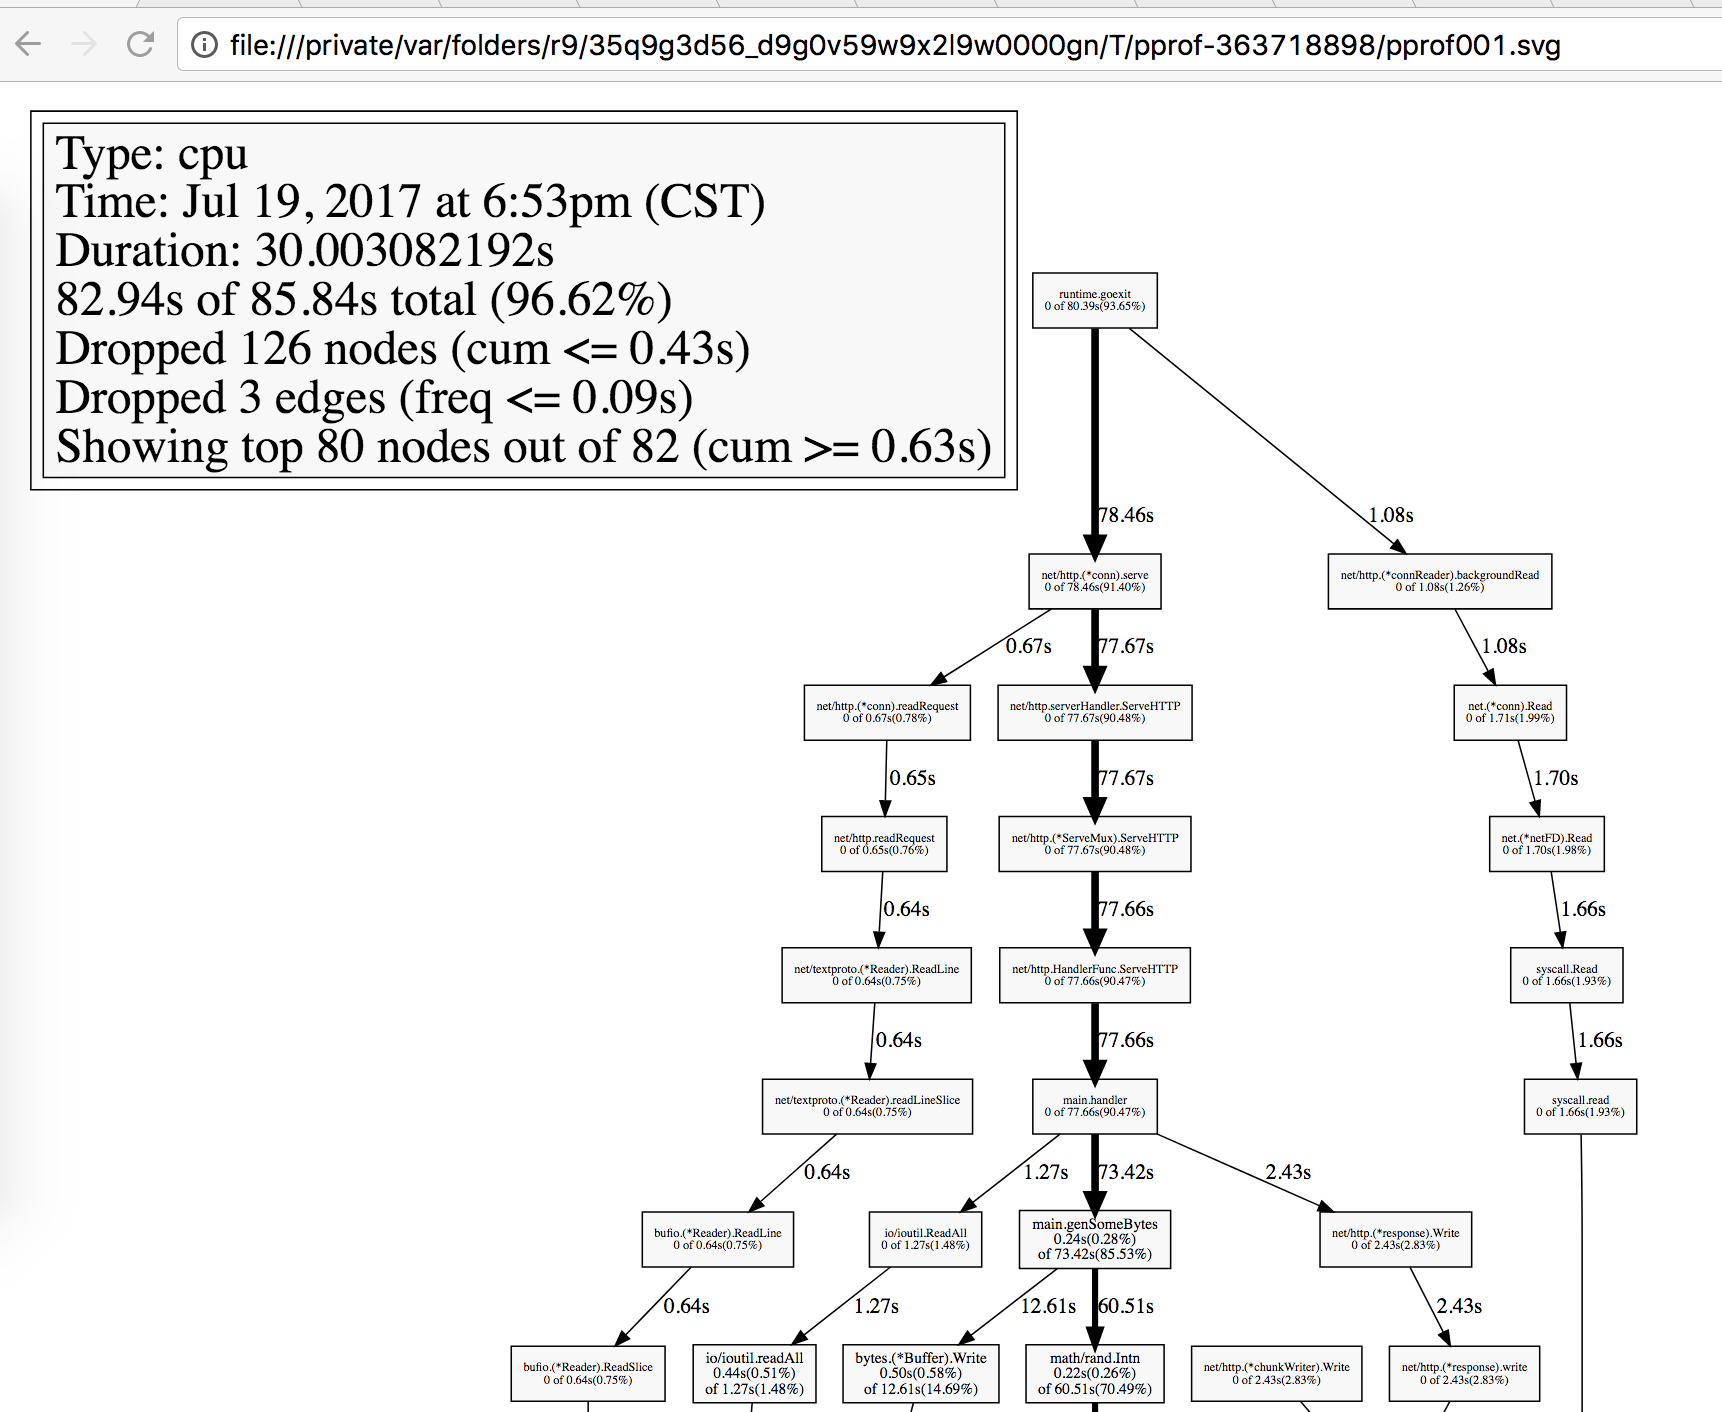
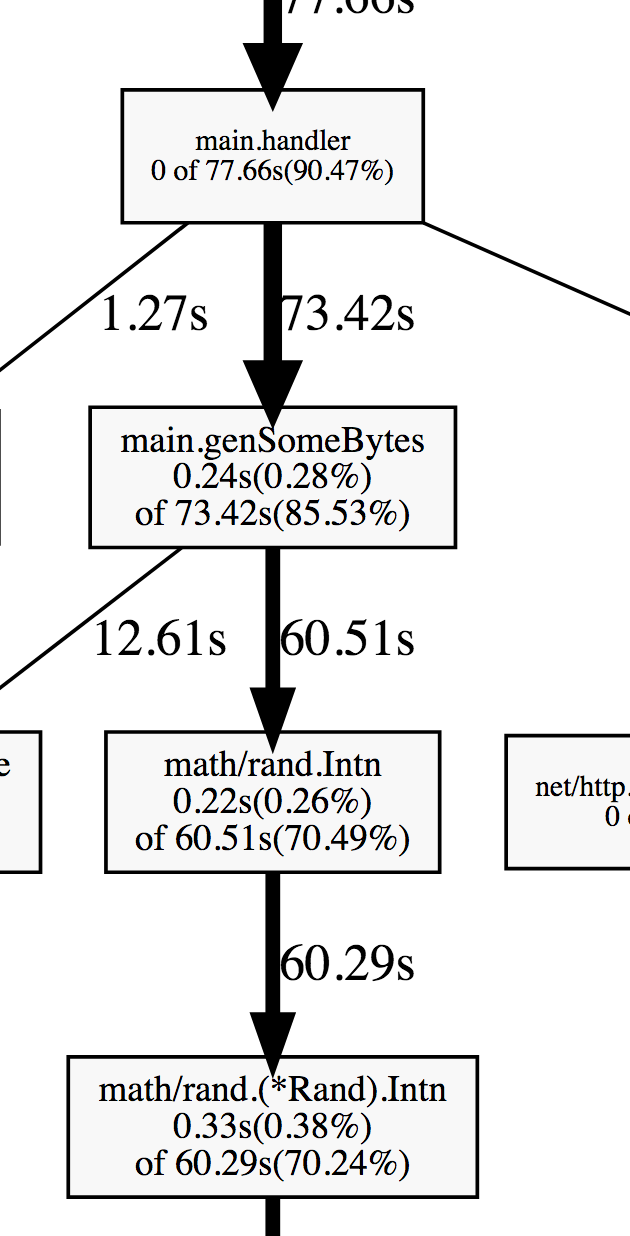
After have the graphviz installed, in the go tool pprof interaction panel, input web instead of top now, and it'll produce a svg file.Open it in the browser or anything else you like and you'll see a graph like this.
Very intuitive right?
Now, follow the thickest arrow, you can learn from the graph that most of time is spent on the function genSomeBytes
So we should come up with an idea to make it run faster! But let's look at it firstly:
func genSomeBytes() *bytes.Buffer {
	var buff bytes.Buffer
	for i := 1; i < 20000; i++ {
		buff.Write([]byte{'0' + byte(rand.Intn(10))})
	}
	return &buff
}
From the graph above we can learn than most of time in genSomeBytes is spent on rand.Intn.But to tell the truth it's not easy to optimize packages in stdlib,but the purpose of this article is to teach you how to find the bottleneck,so I just change the rand.Intn to a constant,but you should know they're not equivalent in fact.
The genSomeBytes after modifying:
func genSomeBytes() *bytes.Buffer {
	var buff bytes.Buffer
	for i := 1; i < 20000; i++ {
		buff.Write([]byte{'0' + byte(i%10)})
	}
	return &buff
}
Generate pprof graph again
- Kill your server process and
go run main.goagain - cd ~/wrk && ./wrk -c400 -t8 -d5m http://localhost:9876/test
- open a new terminal and run
go tool pprof http://localhost:9876/debug/pprof/profile - input
web - open the svg file
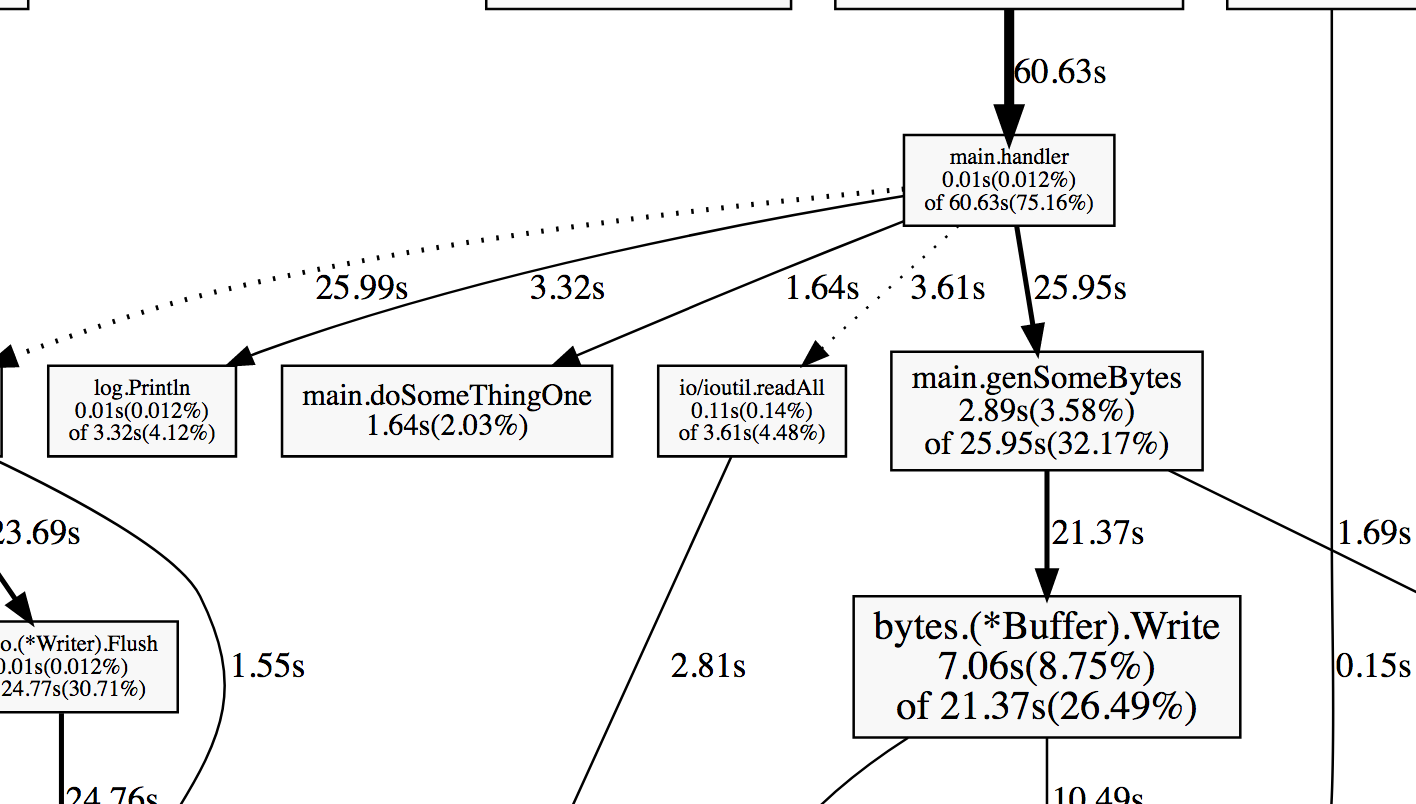
And something maybe like:
You can see in the graph that most time spent on genSomeBytes is no longer how to generate bytes but something else.It's enough for us.
And according to wrk, we have a huge improvement! Surprise!
go-torch
go-torch is a tool based on flame graph, sometimes it's even more powerful for us to find the bottleneck,it's more intuitive!
Install go-torch
go get -u github.com/uber/go-torchgit clone https://github.com/brendangregg/FlameGraph.git- Make sure add the path of FlameGraph into your $PATH
show the flame graph
- use wrk to build more requests
go-torch http://localhost:9876/debug/pprof/profile- open the generated svg file
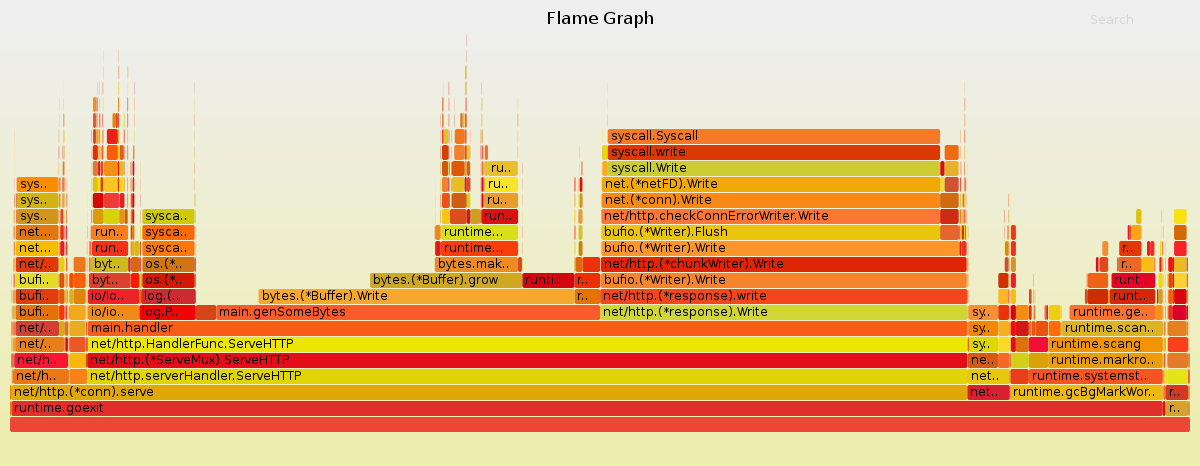
And it may be something like this:
Each colored rectangle stands for a function.The longer the rectangle is, the more time it costs.
So it's really easy for you to find out the bottleneck in your system.
In the flame graph we can learn that fmt.Println which is used to print some debug information,cost even more time than doSomeThingOne.And of course we can remove it.
Conclusion
In this article I've just shown you how to use these tools to find the bottleneck in your system,and I just cover the profile. Memory is also a very important aspect for optimization.
If you have problems welcome to open an issue

