ExpediaDotCom / Haystack
Projects that are alternatives of or similar to Haystack
haystack
This is an uber repository for all Haystack components. Visit our documentation site @ https://expediadotcom.github.io/haystack/
Overview
Haystack is an Expedia-backed open source project to facilitate detection and remediation of problems with enterprise-level web services and websites.
The Problem
Modern websites rely on dozens or even hundreds of services to function. These services are often spread across many platforms, data centers, and teams. Each service logs information of various kinds:
- Telemetry data with tags or key/value pairs associated with the event
- Request/response logs (the XML, JSON, etc. sent to and received from the service)
- Application logs (typically errors logged via log4j or a similar system)
- Metrics
With so much information spread across many different places, it can be challenging and time consuming to figure out where to look for the cause of a failure or slowdown.
The Solution
Haystack uses tracing data from a central store to help you locate the source of the problem -- to drill down to the precise part of a service transaction where failures or latency are occurring -- and find the proverbial "needle in a haystack". Once you know specifically where the problem is happening, it's much easier to identify the appropriate diagnostic data, understand the data, find the problem, and fix it.
Infrastructure
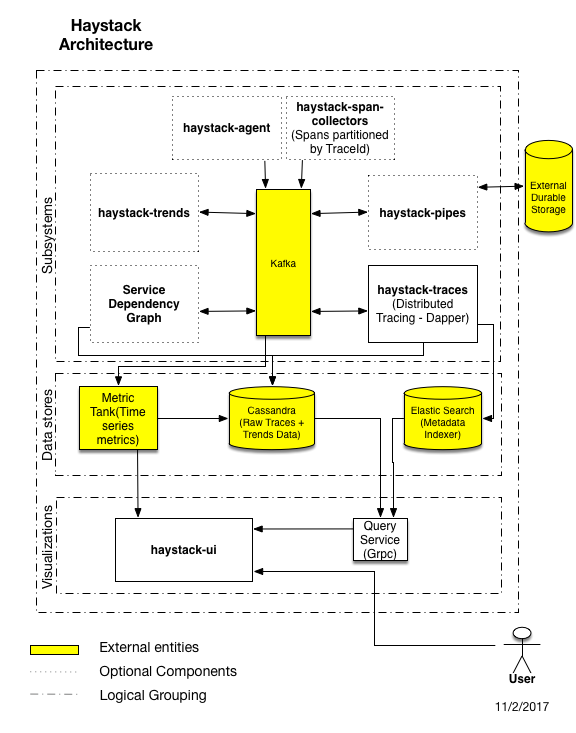
The Haystack system includes an easy-to-use "one click" deployment mechanism, based on Kubernetes, that deploys a working development environment with working implementations of all of the services in the block diagram above. This same mechanism, with different configurations, deploys to test and production environments as well. See the collection of scripts, CloudFormation templates, and YAML files in the deployment module for details.
Kafka
Internal Kafka is the Haystack message bus. The messages that enter the Haystack system are Span objects in protobuf format, and the modules below usually communicate with each other via this message bus.
haystack-trends
The haystack-trends module detects anomalies in metrics, based on user-defined "trend templates" that define the levels at which metrics should be considered "out of trend." A single anomalous metric does not necessarily merit alarming as out of trend, so the haystack-trends unit aggregates as directed by the trend templates. For example, a particular service call might have a typical TP99 value of 100 milliseconds. ("TP" means "top percentile" and TP99 refers to the minimum time under which 99% of the calls to the service have finished.) The trend template for such a service might declare that the TP99 metric is out of trend when it exceeds 150 milliseconds, a value that was chosen to be low enough to notify interested parties of a potential problem before it becomes serious but high enough to minimize false positive alarms. The haystack-trends module stores its data in a Time Series Data Base (TSDB).
haystack-pipes
The haystack-pipes module delivers a human-friendly JSON version of Haystack spans to zero or more "durable" locations for more permanent storage. Current "plug in" candidates for such storage include:
- Amazon Kinesis Firehose is an AWS service that facilitates loading streaming data into AWS. Note that its PutRecordBatch API accepts up to 500 records, with a maximum size of 4 MB for each put request. The plug in will batch the records appropriately, to minimize AWS costs. Kinesis Firehose can be configured to deliver the data to
Indexer
The Indexer module collects Span objects sharing a trace ID into SpanBuffer protobuf objects which are written to the Kafka message bus. The Span objects are identified as related by the parent span IDs; the Span with a null parent Span ID is the root Span, child Spans have a parent Span ID of the root Span, grandchild Spans have a parent span ID of the appropriate child Span, etc.
Spans
The Spans module writes Span objects into a persistent store. That persistent store consists of two pieces: the Span data is stored in Cassandra, and the Span metadata is stored in ElasticSearch. Sampling, with the ability to force storing a particular Span, will be available (under configuration) to keep the size of the Cassandra and ElasticSearch stores reasonable, given the large volume of Span objects in a production system.
Dependencies
The Dependencies module uses the parent/child relationships of Span objects to create dependency graphs for each service, stored in a graph database.
haystack-ui
The haystack-ui (User Interface) module exposes (through a website) the Spans, Stitched Spans, haystack-trends, and Dependencies created by the other modules. To simplify the API from the haystack-ui module to the Span databases, a small Query module bundles the data from the Cassandra store with the metadata from the ElasticSearch store.


