Erdk / Introtoprofiling
Labels
Projects that are alternatives of or similar to Introtoprofiling
Introduction to profiling
Table of contents
- [x] Get sources
- [x] Introduction
- [x] Throw against the wall and see what sticks
- [x] Pros & cons
- [x] gprof
- [x] perf
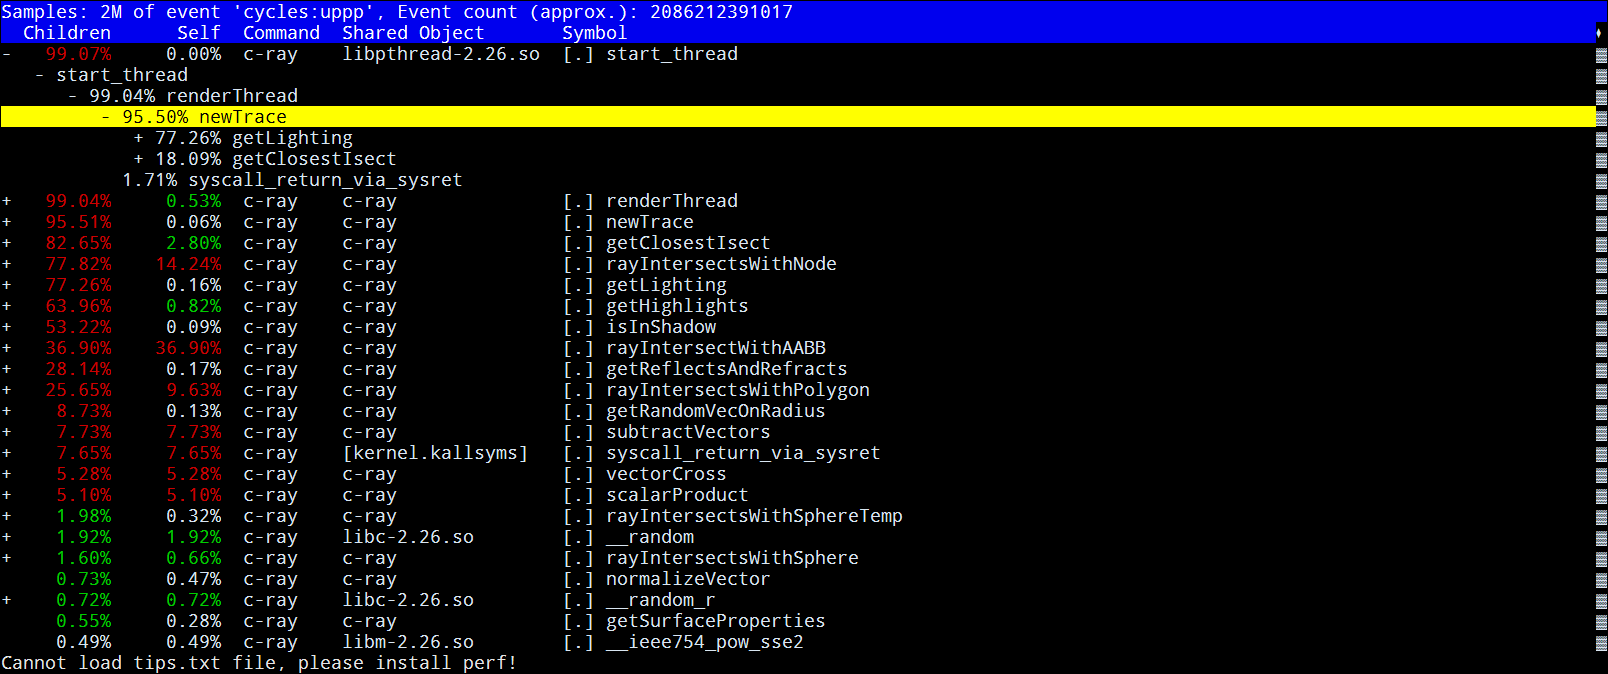
- [x] perf report
- [x] perf diff <filename1> <filename2>
- [x] perf data
- [x] FlameGraph
- [x] callgrind
- [x] kcachegrind
- [x] summary
- "Scalpel"
- [ ] Other tools
- [ ] go prof
- [x] Sources
Get sources
Clone repository and download submodules:
$ git clone https://github.com/Erdk/introtoprofiling
$ cd introtoprofiling
$ git submodule update --init
After (or before) clonnig repository install applications and libraries from this list:
- gprof (should be in distro repo)
- perf (should be in distro repo)
- valgrind (should be in distro repo)
- lttng & babeltrace (if not available from repo check here: http://lttng.org/download/ for download instructions)
- blkin (
git clone https://github.com/ceph/blkin) - zipkin (
docker run -d -p 9411:9411 openzipkin/zipkinorwget -O zipkin.jar 'https://search.maven.org/remote_content?g=io.zipkin.java&a=zipkin-server&v=LATEST&c=exec' && java -jar zipkin.jar) - (optional) go pprof
Introduction
"Throw against the wall and see what sticks"
gprof, perf and callgrind (part of valgrind suite) are relatively easy to use without any changes to the code. Thanks to this it's easy to use them with your application to get an overview on what's going on, what are the most frequently called functions and in which functions application spends most of the time. The penalty for ease of use is performance hit related to the tracing of the whole application, and relatively low granularity. gprof is the oldest of those applications, I've included it because it widely available (and maybe because of historical reasons). Most likely you'll be more satisfied with perf (in terms of functionality and performance) or with valgrind, when 100% correctness of the result is more important than execution time.
Each of those tools produces three types of results:
- flat profile: shows how much time your program spent in each function, and how many times that function was called. As the name suggests on this view you won't see any relation between functions,
- call graph: for each function shows which functions called it, which other functions was called by it, and how many times. There is also an estimate of how much time was spent in the subroutines of each function.
- annotate source code: returns source code with performance metrics in lines, where it was applicable.
Pros & cons
Pros:
- easy to enable and use,
- all the tools gave good image of where could be possible hotspots, which functions are called the most and which functions are the most expensive computationally.
Cons:
gprof & perf:
- the computed time and number of function calls are statistical, both of the programs check callstack at fixed time spans,
- lower granuality than lttng,
- adds overhead.
callgrind:
- executes code on simulatr @ single CPU core, tracks every call, so performance could be very low, in applications relying on network connections could led to timeouts and abnormal program behavior.
gprof
Simple tool, very easy way to enable: add '-pg' to to CFLAGS and LDFLAGS (at compiling and linking stages). Also, with recent GCC versions you've also must add '--no-pie -fPIC' to the compiler options for it to work. Key advantage here is no need to add new code (apart from Makefile). In directory c-ray you could test gprof:
$ cd introtoprofiling/c-ray
$ make profile
This would create binary 'bin/c-ray-prof'. After executing it:
$ bin/c-ray-prof
There will be a new file in the directory: gmon.out. With gprof executable you could inspect the results.
$ gprof bin/c-ray-prof gmon.out | less
You should see something like this:
Flat profile:

Each sample counts as 0.01 seconds.
  %   cumulative   self              self     total
 time   seconds   seconds    calls   s/call   s/call  name
 44.89    208.66   208.66 495703455     0.00     0.00  rayIntersectWithAABB
 17.60    290.46    81.80 62948596     0.00     0.00  rayIntersectsWithNode
  6.91    322.60    32.14 247988102     0.00     0.00  vectorCross
  6.57    353.15    30.55 168061837     0.00     0.00  rayIntersectsWithPolygon
  5.41    378.32    25.17 620561735     0.00     0.00  subtractVectors
  5.15    402.26    23.94  8180655     0.00     0.00  getClosestIsect
  4.18    421.70    19.44 408107946     0.00     0.00  scalarProduct
  1.48    428.58     6.88  1799410     0.00     0.00  getHighlights
...
The output is relatively long, after each section there's lengthy description of columns. To suppress it run grof with '-b' (brief), but I encourage you to read it at least once ;)
Now we get to options which could help us with analysis. When you only want to inspect flat profile use '-p' switch:
$ gprof -b -p bin/c-ray-prof gmon.out |  head
Flat profile:

Each sample counts as 0.01 seconds.
  %   cumulative   self              self     total
 time   seconds   seconds    calls   s/call   s/call  name
 44.89    208.66   208.66 495703455     0.00     0.00  rayIntersectWithAABB
 17.60    290.46    81.80 62948596     0.00     0.00  rayIntersectsWithNode
  6.91    322.60    32.14 247988102     0.00     0.00  vectorCross
  6.57    353.15    30.55 168061837     0.00     0.00  rayIntersectsWithPolygon
  5.41    378.32    25.17 620561735     0.00     0.00  subtractVectors
You could also inspect flat profile of functions matching "symspec" (function name, source file) '-p<symspec>' (note the lack of whitespace between symspec and -p):
$ gprof -b -prayIntersectWithAABB bin/c-ray-prof gmon.out  | head
Flat profile:

Each sample counts as 0.01 seconds.
  %   cumulative   self              self     total
 time   seconds   seconds    calls  us/call  us/call  name
100.02    208.66   208.66 495703455     0.42     0.42  rayIntersectWithAABB
This could be useful, when you have multiple static functions with the same name. To exclude functions from flat profile use '-P' switch:
$ gprof -b -PrayIntersectWithAABB bin/c-ray-prof gmon.out  | head
Flat profile:

Each sample counts as 0.01 seconds.
  %   cumulative   self              self     total
 time   seconds   seconds    calls   s/call   s/call  name
 31.93     81.80    81.80 62948596     0.00     0.00  rayIntersectsWithNode
 12.55    113.94    32.14 247988102     0.00     0.00  vectorCross
 11.92    144.49    30.55 168061837     0.00     0.00  rayIntersectsWithPolygon
  9.82    169.65    25.17 620561735     0.00     0.00  subtractVectors
  9.35    193.60    23.94  8180655     0.00     0.00  getClosestIsect
When you compare with previous example you could see, that all values were adjusted. This could be useful when you want to exclude function you couldn't optimize and want to have a closer look on other potential candidates for optimization.
In similar way you could inspect call graphs. To do this use '-q' and '-Q' switches. First display ony call graph:
$ gprof -b -q bin/c-ray-prof gmon.out  | head -n 27
                        Call graph


granularity: each sample hit covers 2 byte(s) for 0.00% of 464.88 seconds

index % time    self  children    called     name
                                                 <spontaneous>
[1]     98.3    3.86  453.32                 renderThread [1]
                1.71  448.86 2703244/2703244     newTrace <cycle 1> [9]
                0.21    1.11 1366674/1366676     transformCameraView [28]
                0.35    0.25 1632466/10151652     normalizeVector [17]
                0.54    0.00 1537256/1537256     getPixel [45]
                0.18    0.00 4013744/19821218     getRandomDouble [36]
                0.11    0.00 1441645/13375163     addColors [34]
                0.00    0.00       6/6           computeTimeAverage [171]
                0.00    0.00       5/5           getTile [172]
-----------------------------------------------
[2]     96.9    1.71  448.86 2703244+4995853 <cycle 1 as a whole> [2]
                0.53  274.74 1721452             getLighting <cycle 1> [5]
                0.44  173.35 3080079             newTrace <cycle 1> [9]
                0.74    0.77 2897566             getReflectsAndRefracts <cycle 1> [27]
-----------------------------------------------
                9.68  163.67 3308211/8180655     newTrace <cycle 1> [9]
               14.26  241.06 4872444/8180655     isInShadow [7]
[3]     92.2   23.94  404.72 8180655         getClosestIsect [3]
               81.80  315.75 62948596/62948596     rayIntersectsWithNode [4]
                1.93    5.25 15315957/15315957     rayIntersectsWithSphereTemp [14]
Line with index denotes 'main' function of call graph. Functions above are 'parents', callers. Functions below are 'children', callees. In this example, call graph with index 3:
| Function | relation |
|---|---|
| newTrace | top most function |
| isInShadow | function called by newTrace |
| getClosestInsect | main function of this call graph |
| rayIntersectsWithNode | function called by getClosestInsect |
| rayIntersectsWithSphereTemp | function called by rayIntersectsWithNode |
Numbers in 'called' column denotes respectively number of calls in scope of the parent and number of total calls. Analogous to '-p' switch with '-q<symspec>' you could inspect call graph of function you choose:
$ gprof -b -qrayIntersectsWithNode bin/c-ray-prof gmon.out
                        Call graph


granularity: each sample hit covers 2 byte(s) for 0.00% of 464.88 seconds

index % time    self  children    called     name
                             213618252             rayIntersectsWithNode [4]
               81.80  315.75 62948596/62948596     getClosestIsect (3)
[4]     85.5   81.80  315.75 62948596+213618252 rayIntersectsWithNode [4]
              208.66    0.00 495703455/495703455     rayIntersectWithAABB [8]
               30.55   74.51 168061837/168061837     rayIntersectsWithPolygon [10]
                1.58    0.00 18565813/25178963     vectorScale [22]
                0.45    0.00 7636053/15517841     addVectors [35]
                             213618252             rayIntersectsWithNode [4]
-----------------------------------------------
              208.66    0.00 495703455/495703455     rayIntersectsWithNode [4]
[8]     44.9  208.66    0.00 495703455         rayIntersectWithAABB [8]
-----------------------------------------------
               30.55   74.51 168061837/168061837     rayIntersectsWithNode [4]
[10]    22.6   30.55   74.51 168061837         rayIntersectsWithPolygon [10]
               31.88    0.00 245938645/247988102     vectorCross [11]
               23.91    0.00 589609039/620561735     subtractVectors [12]
               17.05    0.00 357801568/408107946     scalarProduct [13]
                1.68    0.00 6623695/6623695     uvFromValues [23]
...
Last, but not least: gprof could annotate source file with profile information. As symspec the best is to choose file (e.g. render.c) to have annotated source file and files with callees:
$ gprof -b -Arender.c bin/c-ray-prof gmon.out | less
...
*** File .../c-ray/src/sphere.c:
                //
                //  sphere.c
                //  C-Ray
                //
                //  Created by Valtteri Koskivuori on 28/02/15.
                //  Copyright (c) 2015 Valtteri Koskivuori. All rights reserved.
                //

                #include "includes.h"
                #include "sphere.h"

           3 -> struct sphere newSphere(struct vector pos, double radius, int materialIndex) {
                        return (struct sphere){pos, radius, materialIndex};
                }

                //Just check for intersection, nothing else.
       ##### -> bool rayIntersectsWithSphereFast(struct lightRay *ray, struct sphere *sphere) {
                        double A = scalarProduct(&ray->direction, &ray->direction);
                        struct vector distance = subtractVectors(&ray->start, &sphere->pos);
                        double B = 2 * scalarProduct(&ray->direction, &distance);
                        double C = scalarProduct(&distance, &distance) - (sphere->radius * sphere->radius);
                        double trigDiscriminant = B * B - 4 * A * C;
                        if (trigDiscriminant < 0) {
                                return false;
                        } else {
                                return true;
                        }
                }

                //Calculates intersection with a sphere and a light ray
    39921178 -> bool rayIntersectsWithSphere(struct lightRay *ray, struct sphere *sphere, double *t) {
                        bool intersects = false;

                        //Vector dot product of the direction
                        double A = scalarProduct(&ray->direction, &ray->direction);

                        //Distance between start of a lightRay and the sphere position
                        struct vector distance = subtractVectors(&ray->start, &sphere->pos);

                        double B = 2 * scalarProduct(&ray->direction, &distance);

                        double C = scalarProduct(&distance, &distance) - (sphere->radius * sphere->radius);

                        double trigDiscriminant = B * B - 4 * A * C;

                        //If discriminant is negative, no real roots and the ray has missed the sphere
                        if (trigDiscriminant < 0) {
                                intersects = false;
                        } else {
                                double sqrtOfDiscriminant = sqrt(trigDiscriminant);
                                double t0 = (-B + sqrtOfDiscriminant)/(2);
                                double t1 = (-B - sqrtOfDiscriminant)/(2);

                                //Pick closest intersection
                                if (t0 > t1) {
                                        t0 = t1;
                                }

                                //Verify intersection is larger than 0 and less than the original distance
                                if ((t0 > 0.001f) && (t0 < *t)) {
                                        *t = t0;
                                        intersects = true;
                                } else {
                                        intersects = false;
                                }
                        }
                        return intersects;
                }


Top 10 Lines:

     Line      Count

       31   39921178
       12          3

Execution Summary:

        3   Executable lines in this file
        3   Lines executed
   100.00   Percent of the file executed

 39921181   Total number of line executions
13307060.33   Average executions per line


*** File .../c-ray/src/main.c:
Used functions are annotated with 'num ->' prior to function definition, denoting number of executions. Also after each source file there's footer with statistics, the hot lines, execution summary and total number of executions.
perf
Perf TODO: much better than gprof, faster execution, more detailed profile, easy to profile userspace app or kernel. Better tui. Con: annotation interleaves asm with C. Annotating with C only available when app was compiled with debug information.
To get trace you have to run perf record <path to executable>:
- Just flat profile (default):
perf record bin/c-ray - Flat profile + call graph:
perf record --call-graph bin/c-ray
perf report
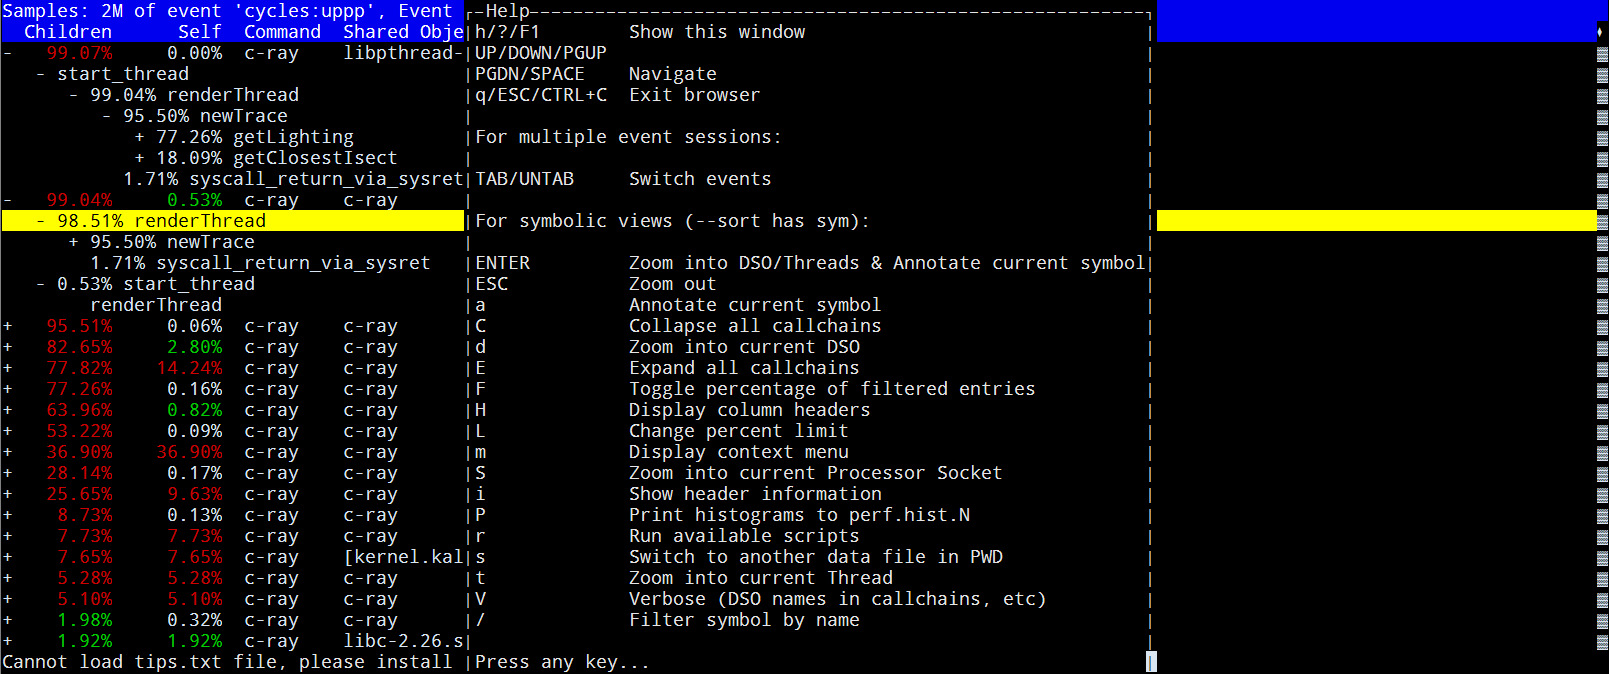
$ perf report
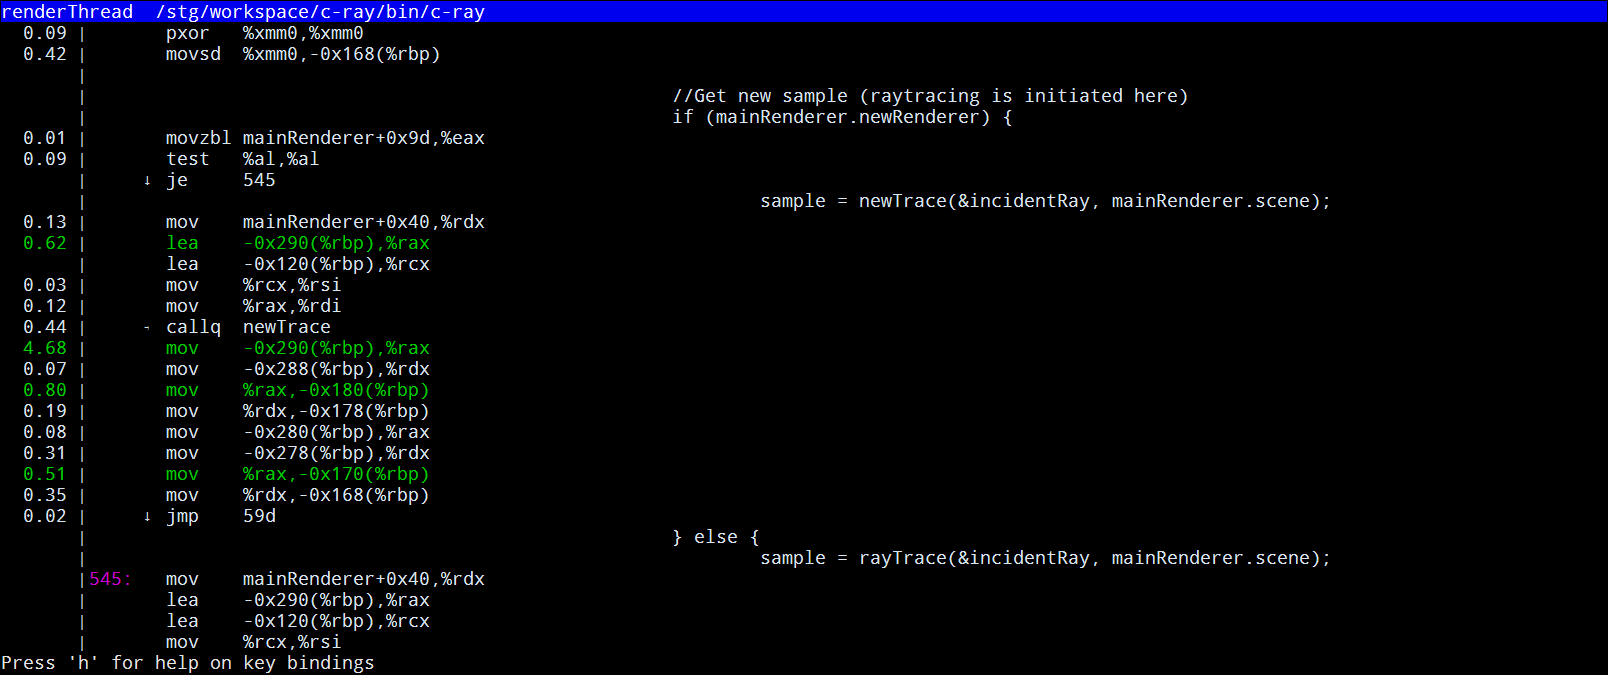
Select function with arrow keys and press 'a' to go to the annotated view. Without debug information there will be only asm:
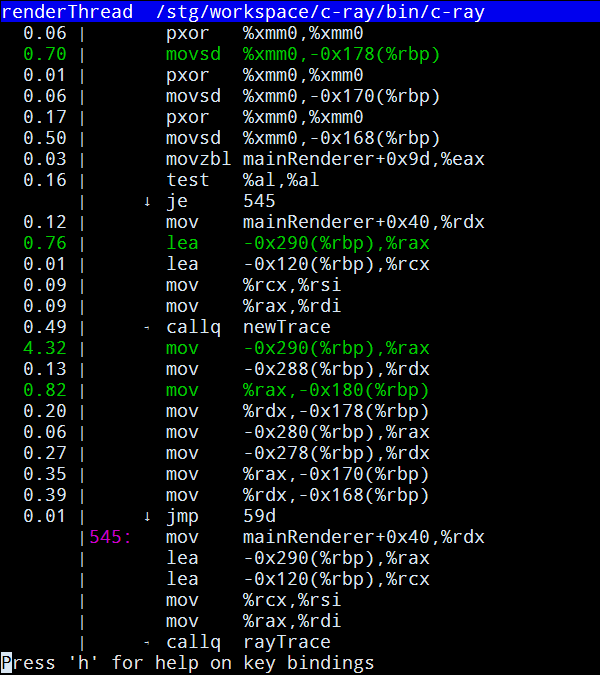
When app was compiled with debug information asm code will be interleaved with C code:
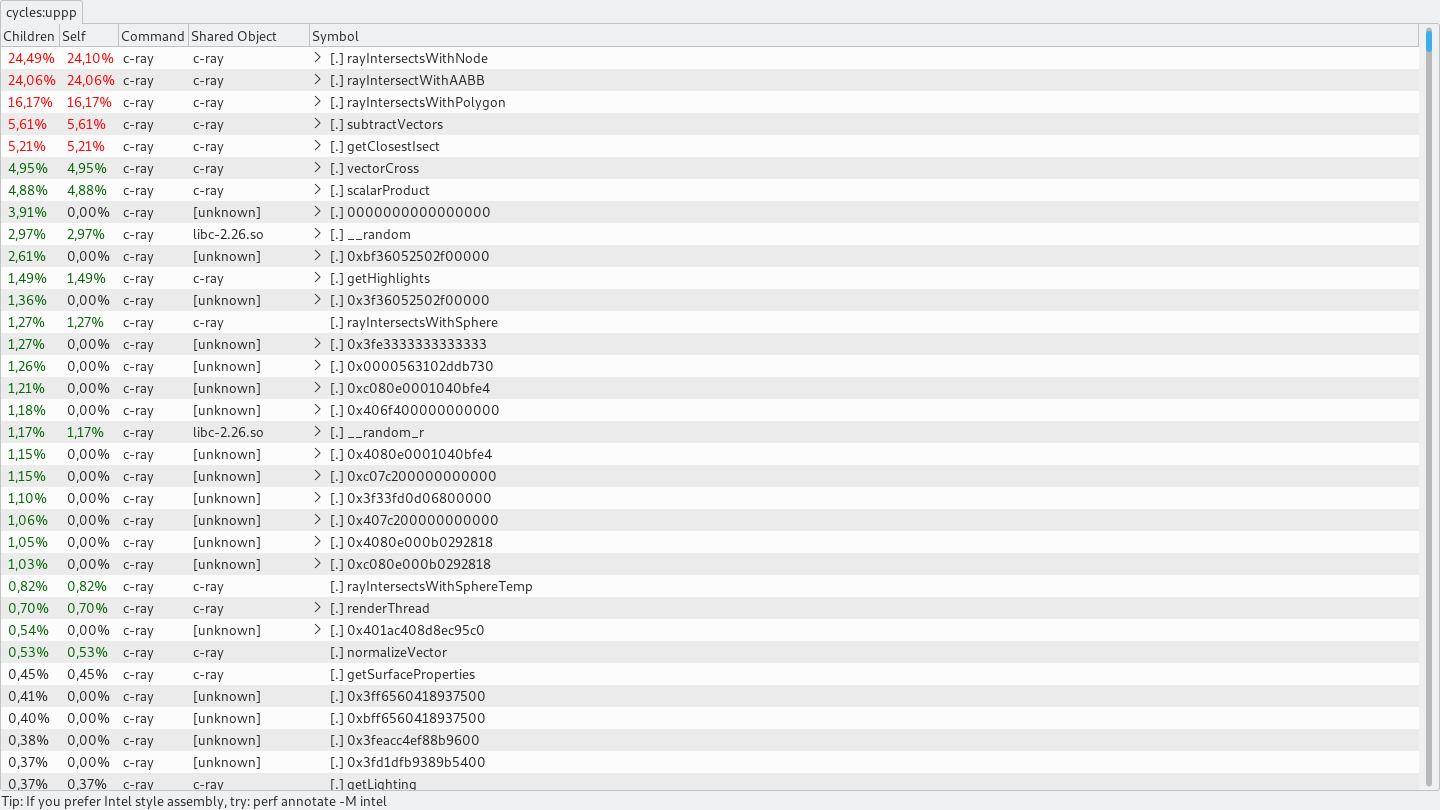
GTK2 interface: perf report --gtk (needs compiled in support, e.g. screenshot below is taken on Archlinux, because on Fedora this is not compiled in)
perf diff <filename1> <filename2>
perf diff \<filename1> \<filename2> compares to perf files.
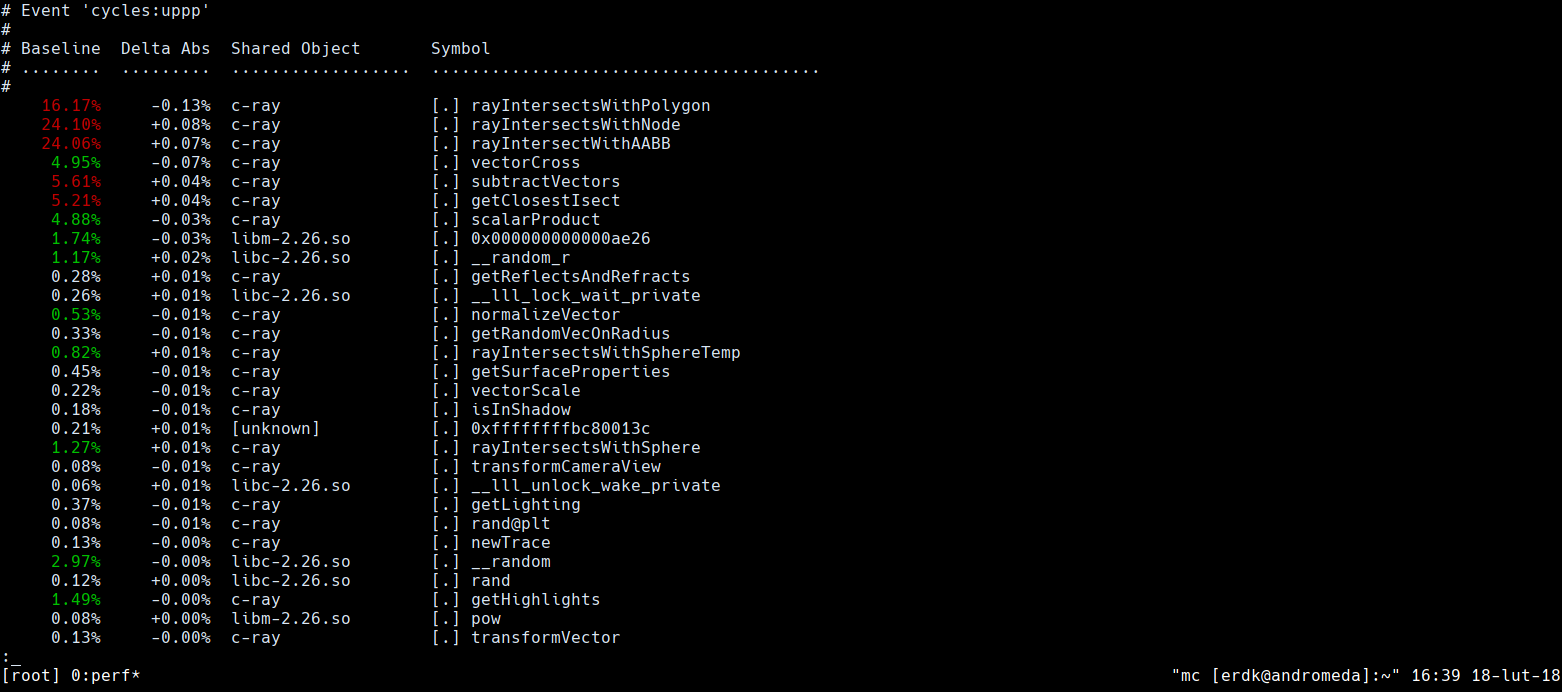
Above screenshot contains perf diff output of two runs of perf record -g. perf by default creates perf.data file which contains performance counters. When you run it the secod time older session will be renamed to perf.data.old and new will be saved to perf.data. Then when you run perf diff (without any other options) it will compare those two sessions, where perf.data.old will be a baseline against which perf.data will be compared. In the first column there's baseline profile, in the second difference in execution time of matching symbols, in third there's executable or library from which symbol originates and in the last symbol name. By default perf diff sorts results by absoulte delta (abs(delta)), that's why results in the first column are out of order and
perf data convert --to-ctf
Convert native perf data format to CTF, understandable by babeltrace. I didn't encounter a distro in which this is enabled, but it looks like it could be done via building perf from sources. Only for courageous ;)
FlameGraph
FlameGraph is bundle of helper scripts for better visualization of perf results. It's good to get the idea how all functions looks on the timegraph, how each function contributes to the total execution time:
How to use them? First ensure you have perl installed, then go to the c-ray directory and then:
$ perf record -g bin/c-ray
$ perf script | ../FlameGraph/stackcollapse-perf.pl | ../FlameGraph/flamegraph.pl > perf.data.svg
perf.data.svg contains performance trace saved as 'towers of time spans' with additional javascript functions added to ease navigation between scopes. The bottom-most functions are on the bottom of the stack and to nobody's suprise the higher the 'span tower' the bigger where callstack at the runtime. Vertical size corrseponds to the executiuon time. I would recommend opening this file in web browser because included JS greatly helps with navigating and analyzing results. When you click one of the bars it will show you stack from this function up, clicking 'all' (on the bottom of the graph) after inspecting will get you to the default view. Hovering over bar will show statistics about it in the bottom-left corner.
Screenshot with deeper callstack:
Source: http://www.brendangregg.com/FlameGraphs/cpu-linux-tcpsend.svg
callgrind
Similarily to previous tools callgrind doesn't require changes to the code, it's sufficient to compile with optimizations and debug information turned on. Contrary to gprof and perf it doesn't run code directly on host CPU, but via it's own simulator. The counters are gathered directly from simulator's state, which produces near real-life characteristic. On the downside simplator runs only on a single thread and serializes all the code, so multi-thread, computation heavy applications will run terribly slow.
To gather profile:
$ valgrind --tool=callgrind bin/c-ray
To inspect flat profile:
$ callgrind_annotate callgrind.out.13671
--------------------------------------------------------------------------------
Profile data file 'callgrind.out.13671' (creator: callgrind-3.13.0)
--------------------------------------------------------------------------------
I1 cache:
D1 cache:
LL cache:
Timerange: Basic block 0 - 119733969377
Trigger: Program termination
Profiled target:  bin/c-ray (PID 13671, part 1)
Events recorded:  Ir
Events shown:     Ir
Event sort order: Ir
Thresholds:       99
Include dirs:
User annotated:
Auto-annotation:  off

--------------------------------------------------------------------------------
             Ir
--------------------------------------------------------------------------------
936,450,558,371  PROGRAM TOTALS

--------------------------------------------------------------------------------
             Ir  file:function
--------------------------------------------------------------------------------

238,763,680,382  .../c-ray/src/bbox.c:rayIntersectWithAABB [.../c-ray/
bin/c-ray]
168,001,295,859  .../c-ray/src/raytrace.c:rayIntersectsWithNode'2 [...
/c-ray/bin/c-ray]
158,259,872,671  .../c-ray/src/poly.c:rayIntersectsWithPolygon [.../c-
ray/bin/c-ray]
...
I1 cache, D1 cache, LL cache refers to simulated CPU caches, in this example we didn't turn option to gather them so there's no data here.
With switch --tree=<mode> you could turn on information about call graph: caller, calling, and both:
$ callgrind_annotate --tree=caller callgrind.out.13671
...
187,684,131,006  < .../c-ray/src/raytrace.c:rayIntersectsWithNode'2 (3842892764x)
 [.../c-ray/bin/c-ray]
 51,079,549,376  < .../c-ray/src/raytrace.c:rayIntersectsWithNode (1060050002x) [
.../c-ray/bin/c-ray]
238,763,680,382  *  .../c-ray/src/bbox.c:rayIntersectWithAABB [.../c-r
ay/bin/c-ray]
...
$ callgrind_annotate --tree=caller callgrind.out.13671
...
238,763,680,382  *  .../c-ray/src/bbox.c:rayIntersectWithAABB [.../c-r
ay/bin/c-ray]

168,001,295,859  *  .../c-ray/src/raytrace.c:rayIntersectsWithNode'2 [.../c-ray/bin/c-ray]
346,471,804,141  >   .../c-ray/src/poly.c:rayIntersectsWithPolygon (2027649930x) [.../c-ray/bin/c-ray]
  1,206,571,355  >   .../c-ray/src/vector.c:vectorScale (109688305x) [.../c-ray/bin/c-ray]
187,684,131,006  >   .../c-ray/src/bbox.c:rayIntersectWithAABB (3842892764x) [.../c-ray/bin/c-ray]
Negative repeat count does nothing at /usr/bin/callgrind_annotate line 828.
3,118,318,860,534  >   .../c-ray/src/raytrace.c:rayIntersectsWithNode'2 (3488504364x) [.../c-ray/bin/c-ray]
  1,316,259,660  >   .../c-ray/src/vector.c:addVectors (109688305x) [.../c-ray/bin/c-ray]
...
$ callgrind_annotate --tree=both callgrind.out.13671
...
3,118,318,860,534  < .../c-ray/src/raytrace.c:rayIntersectsWithNode'2 (3488504364x) [.../c-ray/bin/c-ray]
704,680,062,021  < .../c-ray/src/raytrace.c:rayIntersectsWithNode (354388400x) [.../c-ray/bin/c-ray]
168,001,295,859  *  .../c-ray/src/raytrace.c:rayIntersectsWithNode'2 [.../c-ray/bin/c-ray]
Negative repeat count does nothing at /usr/bin/callgrind_annotate line 828.
3,118,318,860,534  >   .../c-ray/src/raytrace.c:rayIntersectsWithNode'2 (3488504364x) [.../c-ray/bin/c-ray]
187,684,131,006  >   .../c-ray/src/bbox.c:rayIntersectWithAABB (3842892764x) [.../c-ray/bin/c-ray]
  1,316,259,660  >   .../c-ray/src/vector.c:addVectors (109688305x) [.../c-ray/bin/c-ray]
  1,206,571,355  >   .../c-ray/src/vector.c:vectorScale (109688305x) [.../c-ray/bin/c-ray]
346,471,804,141  >   .../c-ray/src/poly.c:rayIntersectsWithPolygon (2027649930x) [.../c-ray/bin/c-ray]
...
With callgrind there also comes callgrind_control, tool which allows to inspect application during run.
To get quick statistics about running application:
$  callgrind_control -s 22710
PID 22710: bin/c-ray
sending command status internal to pid 22710
  Number of running threads: 9, thread IDs: 1 2 3 4 5 6 7 8 9
  Events collected: Ir
  Functions: 575 (executed 3,805,993,131, contexts 575)
  Basic blocks: 5,681 (executed 31,519,541,333, call sites 1,252)
Inspect backtrace:
$ callgrind_control -b 22710 |head -n 30
PID 22710: bin/c-ray
sending command status internal to pid 22710

  Frame: Backtrace for Thread 1
   [ 0]  nanosleep (843 x)
   [ 1]  usleep (842 x)
   [ 2]  sleepMSec (843 x)
   [ 3]  main (1 x)
   [ 4]  (below main) (1 x)
   [ 5]  _start (1 x)
   [ 6]  0x0000000000000ed0


  Frame: Backtrace for Thread 2
   [ 0]  subtractVectors (289348042 x)
   [ 1]  rayIntersectsWithPolygon (289348055 x)
   [ 2]  rayIntersectsWithNode (25762561 x)
   [ 3]  rayIntersectsWithNode (128149695 x)
   [ 4]  getClosestIsect (3052621 x)
   [ 5]  newTrace (3052621 x)
   [ 6]  renderThread (8 x)
   [ 7]  start_thread (8 x)
   [ 8]  clone
...
With callgrind_control -i on|off you could turn on or off instrumentation during runtime. You could combine it with --instr-atstart=no|yes option to valgrind when you start application, to start without instrumentation, then turn it on for a few minutes to gather profile and then turn it off again.
kcachegrind
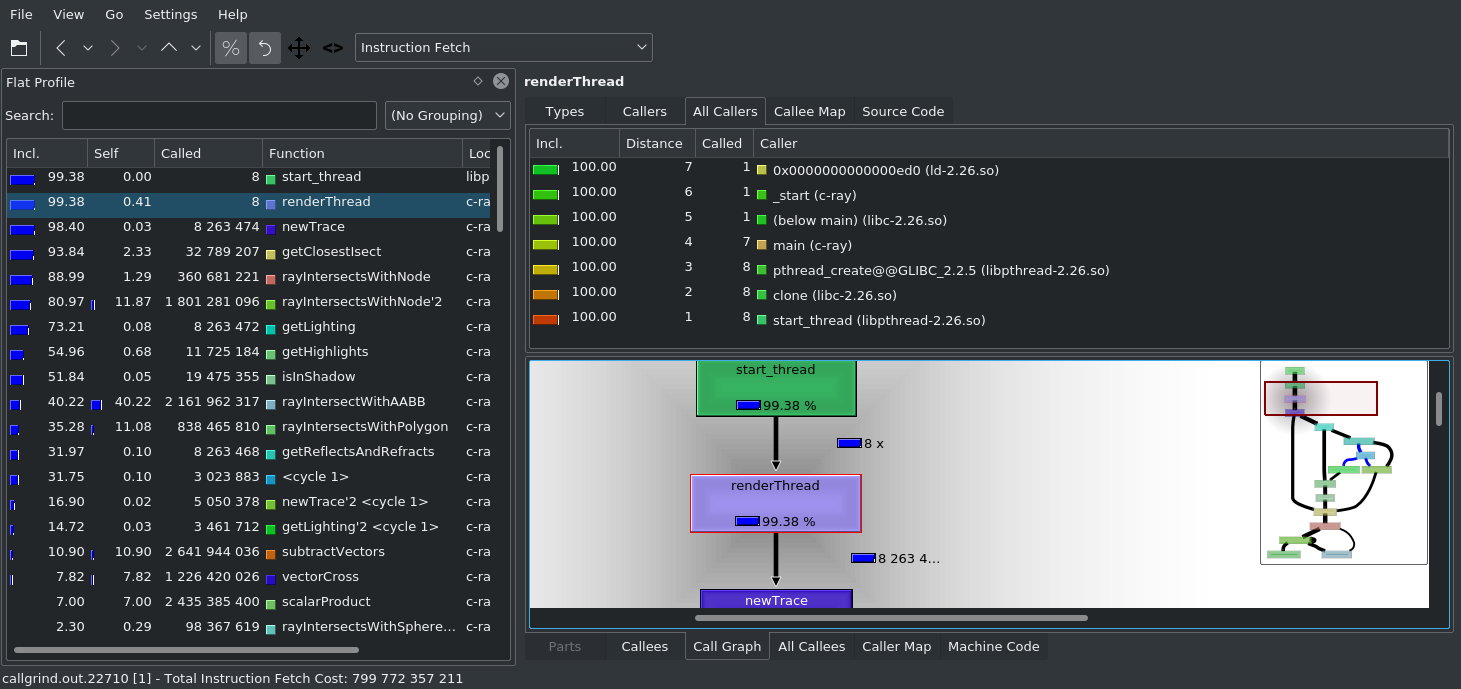
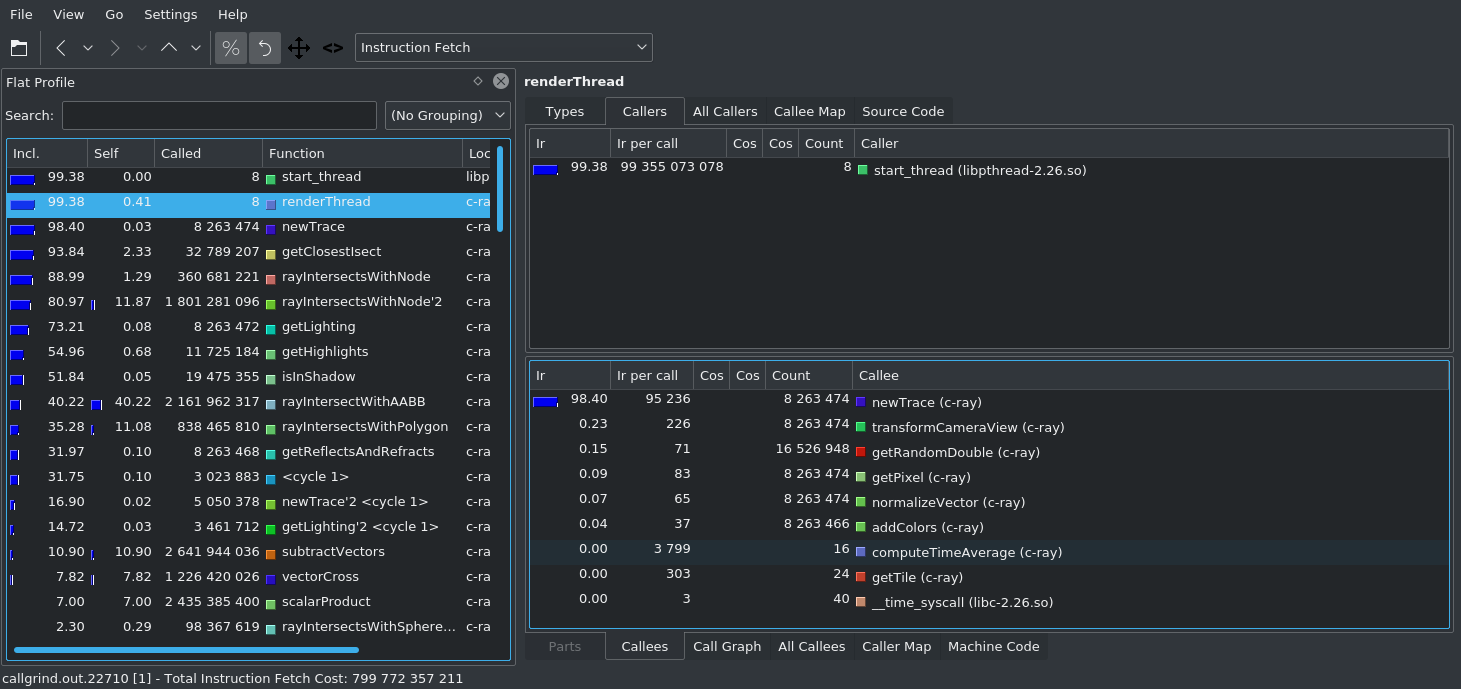
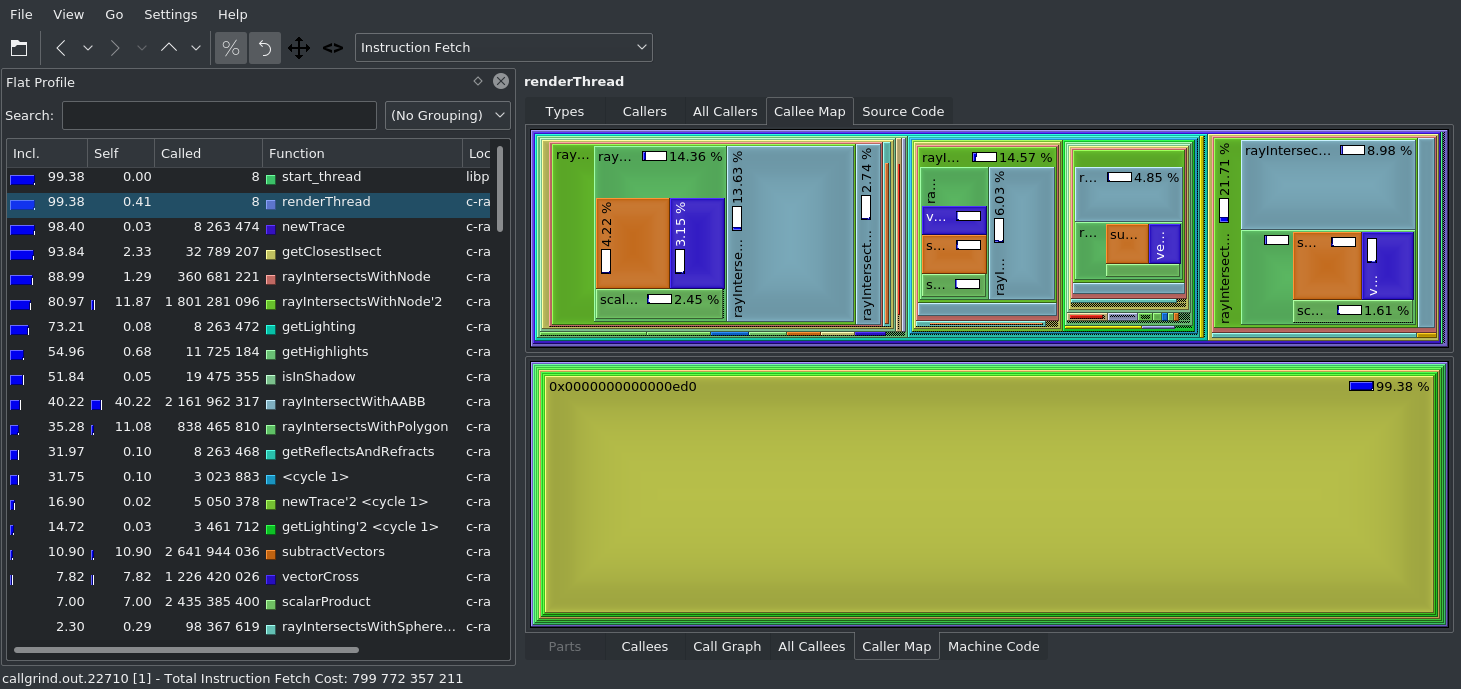
It's possible to base analysis on callgrind_annotate output, but better suited to this is KCacheGrind. It provides graphical interface and it provides visualization of data, which helps with analysis. It's available for Linux, and probobly for Windows as QCacheGrind (I saw old builds on sourceforge but I didn't test them...).
List of callers and callees of choosen function:
Visual maps of execution time:
Summary
Below are total times of execution for gprof, perf and callgrind. Only one run, results measured with time, just to show how roughly those execution times differ. For obvious reasons there were differences in compilation options of our application:
- gprof: -O2 -g -pg --no-pie -fPIC
- perf: -O2 -g
- callgrind: -O2 -g
gprof required the most changes, perf only requires -g when you want to see annotated code in C, not only in asm. callgrind requiers -g and -O2: first to gather required information, second to have semi-decent execution time. I've tested all with -O2 because you want to run optimized executable to gather results as close to reality as possible.
| app | time |
|---|---|
| gprof | 5119.32s user 5.38s system 762% cpu 11:12.00 total |
| perf (flat) | 309.79s user 86.39s system 725% cpu 54.629 total |
| perf (flat + call) | 299.25s user 90.70s system 719% cpu 54.199 total |
| callgrind (-02 -g) | 4699.96s user 17.50s system 100% cpu 1:18:30.59 total |
Keep in mind that despite that callgrind took less seconds than gprof total execution time was much longer. Code instrumented with gprof runs directly on CPU, when with callgrind inside valgrind's simulator, which runs on single CPU and serializes all ops. The fastest of all three was perf, and in my opinion is the best option to use. If for some reason you couldn't run perf (e.g. you couldn't prepend command) the next option would be gprof. callgrind could be used if you really, really need 100% accurate profile. Given the methodology I propose here (get rough idea what's going on and then use other tools to inspect specific codepaths) I don't think it would be a good match for this stage.
"Scalpel"
lttng & babeltrace
When working with lttng there are two phases: first you need to add tracepoints to the application and link against lttng. The second, in which we would gather the profile we will need to create tracing session, enable tracepoints and then continue with execution. At the end we wil lstop the session and review gathered data.
The easiest way to use lttng is to use tracef fucntion, which accepts the same parameters as printf. First we need to link out application with lttng, preferably in the way which will allow us to enable it at build time. Check Makefile in c-ray directory, below LPROFILE:
ifdef LTTNG_SIMPLE
    CFLAGS += -DLTTNG -DLTTNG_SIMPLE
    LFLAGS += -llttng-ust -ldl
endif
I've added two preprocessor defines, LTTNG and LTTNG_SIMPLE and I've added lttng-ust to libraries to link against. The preprocessor defines allow us to include or exclude parts of code at compilation time. LTTNG were used in src/main.c, at the top of the main function:
int main(int argc, char *argv[]) {
#ifdef LTTNG
  getchar();
#endif
It adds getchar() call at the beggining of the program execution. Without it it would be harder for us to get the whole profile, becuase we would lost a few traces. Adding getchar gives as time to review registered traces, enable those which we need and then resume execution with logging all reqiured traces. Why two options? Because I will use getchar in all lttng examples and LTTNG_SIMPLE enables only tracef function.
Keep in mind that getchar is purely optional here, you could start tracing at any moment of program execution, e.g. create session, enable traces defined in already running server application, wait for a few minutes (and trigger execution of codepath you're interested in, if you have mean to do this) to get some results and then finish session and inspect gathered profile.
In the src/raytrace.c you could see how I've added tracef calls:
#ifdef LTTNG_SIMPLE
#include <lttng/tracef.h>
#endif
...
#ifdef LTTNG_SIMPLE
  tracef("before rayIntersectWithAABB");
#endif
If LTTNG_SIMPLE is defined include tracef header file and leave calls to it in the sourcefile.
To compile c-ray with tracef:
$ make clean
$ LTTNG_SIMPLE=1 make
How to gather profile?
First you need to create lttng session, to do so type lttng create <your session name>:
$ lttng create my-session
After creating session you need to tell lttng which traces you want to record. There're few default (with tracef example we will use it), but below I show you how to do it in the 'generic way'. In the secod terminal build your application with enabled tracing and start it:
$ LTTNG_SIMPLE=1 make
$ bin/c-ray
You'll see that the program started, but it's not running any computations yet. That's because out getchar call. lttng has initiation routine which will register all traces from application and will allow to review them and enable one or many of them. In the first terminal review available traces and enable tracef:
$ lttng list -u
UST events:
-------------

PID: 14173 - Name: bin/c-ray
      lttng_ust_tracelog:TRACE_DEBUG (loglevel: TRACE_DEBUG (14)) (type: tracepoint)
      lttng_ust_tracelog:TRACE_DEBUG_LINE (loglevel: TRACE_DEBUG_LINE (13)) (type: tracepoint)
      lttng_ust_tracelog:TRACE_DEBUG_FUNCTION (loglevel: TRACE_DEBUG_FUNCTION (12)) (type: tracepoint)
      lttng_ust_tracelog:TRACE_DEBUG_UNIT (loglevel: TRACE_DEBUG_UNIT (11)) (type: tracepoint)
      lttng_ust_tracelog:TRACE_DEBUG_MODULE (loglevel: TRACE_DEBUG_MODULE (10)) (type: tracepoint)
      lttng_ust_tracelog:TRACE_DEBUG_PROCESS (loglevel: TRACE_DEBUG_PROCESS (9)) (type: tracepoint)
      lttng_ust_tracelog:TRACE_DEBUG_PROGRAM (loglevel: TRACE_DEBUG_PROGRAM (8)) (type: tracepoint)
      lttng_ust_tracelog:TRACE_DEBUG_SYSTEM (loglevel: TRACE_DEBUG_SYSTEM (7)) (type: tracepoint)
      lttng_ust_tracelog:TRACE_INFO (loglevel: TRACE_INFO (6)) (type: tracepoint)
      lttng_ust_tracelog:TRACE_NOTICE (loglevel: TRACE_NOTICE (5)) (type: tracepoint)
      lttng_ust_tracelog:TRACE_WARNING (loglevel: TRACE_WARNING (4)) (type: tracepoint)
      lttng_ust_tracelog:TRACE_ERR (loglevel: TRACE_ERR (3)) (type: tracepoint)
      lttng_ust_tracelog:TRACE_CRIT (loglevel: TRACE_CRIT (2)) (type: tracepoint)
      lttng_ust_tracelog:TRACE_ALERT (loglevel: TRACE_ALERT (1)) (type: tracepoint)
      lttng_ust_tracelog:TRACE_EMERG (loglevel: TRACE_EMERG (0)) (type: tracepoint)
      lttng_ust_tracef:event (loglevel: TRACE_DEBUG (14)) (type: tracepoint)
      lttng_ust_lib:unload (loglevel: TRACE_DEBUG_LINE (13)) (type: tracepoint)
      lttng_ust_lib:debug_link (loglevel: TRACE_DEBUG_LINE (13)) (type: tracepoint)
      lttng_ust_lib:build_id (loglevel: TRACE_DEBUG_LINE (13)) (type: tracepoint)
      lttng_ust_lib:load (loglevel: TRACE_DEBUG_LINE (13)) (type: tracepoint)
      lttng_ust_statedump:end (loglevel: TRACE_DEBUG_LINE (13)) (type: tracepoint)
      lttng_ust_statedump:debug_link (loglevel: TRACE_DEBUG_LINE (13)) (type: tracepoint)
      lttng_ust_statedump:build_id (loglevel: TRACE_DEBUG_LINE (13)) (type: tracepoint)
      lttng_ust_statedump:bin_info (loglevel: TRACE_DEBUG_LINE (13)) (type: tracepoint)
      lttng_ust_statedump:start (loglevel: TRACE_DEBUG_LINE (13)) (type: tracepoint)
$ lttng enable-event -u 'lttng_ust_tracef:event'
UST event lttng_ust_tracef:event created in channel channel0
$ lttng start
The last command, lttng start, starts the tracing of enabled events. Now in the second terminal press <ENTER>, execution will resume and lttng will gather the traces. Keep in mind that if you will add traces in the frequently called functions the trace will grow to very big size (traces from src/raytrace.c added to 88GB(!!!) after 5-6min of execution). To prevent overfilling your storage you could stop collecting trace events after chosen time (e.g. 6 min) with lttng stop.
During collecting trace events you could check current execution statistics:
$ lttng status
Tracing session my-session: [active]
    Trace path: /home/erdk/lttng-traces/my-session-20180218-181827

=== Domain: UST global ===

Buffer type: per UID

Channels:
-------------
- channel0: [enabled]

    Attributes:
      Event-loss mode:  discard
      Sub-buffer size:  524288 bytes
      Sub-buffer count: 4
      Switch timer:     inactive
      Read timer:       inactive
      Monitor timer:    1000000 µs
      Blocking timeout: 0 µs
      Trace file count: 1 per stream
      Trace file size:  unlimited
      Output mode:      mmap

    Statistics:
      Discarded events: 9223372038833876951

    Event rules:
      lttng_ust_tracef:event (type: tracepoint) [enabled]
When you decide you collected everything you need stop gathering events and review profile:
# after execution ends:
$ lttng stop
$ lttng view | less
[18:44:30.951782113] (+?.?????????) andromeda lttng_ust_tracef:event: { cpu_id = 3 }, { _msg_length = 27, msg = "before rayIntersectWithAABB" }
[18:44:30.951784713] (+0.000002600) andromeda lttng_ust_tracef:event: { cpu_id = 2 }, { _msg_length = 27, msg = "before rayIntersectWithAABB" }
[18:44:30.951797505] (+0.000012792) andromeda lttng_ust_tracef:event: { cpu_id = 3 }, { _msg_length = 27, msg = "before rayIntersectWithAABB" }
[18:44:30.951798075] (+0.000000570) andromeda lttng_ust_tracef:event: { cpu_id = 3 }, { _msg_length = 24, msg = "rayIntersectsWithPolygon" }
[18:44:30.951798954] (+0.000000879) andromeda lttng_ust_tracef:event: { cpu_id = 2 }, { _msg_length = 27, msg = "before rayIntersectWithAABB" }
[18:44:30.951799398] (+0.000000444) andromeda lttng_ust_tracef:event: { cpu_id = 2 }, { _msg_length = 24, msg = "rayIntersectsWithPolygon" }
[18:44:30.951799736] (+0.000000338) andromeda lttng_ust_tracef:event: { cpu_id = 3 }, { _msg_length = 27, msg = "before rayIntersectWithAABB" }
[18:44:30.951800243] (+0.000000507) andromeda lttng_ust_tracef:event: { cpu_id = 3 }, { _msg_length = 24, msg = "rayIntersectsWithPolygon" }
[18:44:30.951800478] (+0.000000235) andromeda lttng_ust_tracef:event: { cpu_id = 2 }, { _msg_length = 27, msg = "before rayIntersectWithAABB" }
[18:44:30.951800893] (+0.000000415) andromeda lttng_ust_tracef:event: { cpu_id = 2 }, { _msg_length = 24, msg = "rayIntersectsWithPolygon" }
[18:44:30.951801014] (+0.000000121) andromeda lttng_ust_tracef:event: { cpu_id = 3 }, { _msg_length = 29, msg = "after intersecting with nodes" }
[18:44:30.951801512] (+0.000000498) andromeda lttng_ust_tracef:event: { cpu_id = 2 }, { _msg_length = 29, msg = "after intersecting with nodes" }
[18:44:30.951801890] (+0.000000378) andromeda lttng_ust_tracef:event: { cpu_id = 3 }, { _msg_length = 27, msg = "before rayIntersectWithAABB" }
[18:44:30.951801950] (+0.000000060) andromeda lttng_ust_tracef:event: { cpu_id = 2 }, { _msg_length = 27, msg = "before rayIntersectWithAABB" }
[18:44:30.951802927] (+0.000000977) andromeda lttng_ust_tracef:event: { cpu_id = 2 }, { _msg_length = 27, msg = "before rayIntersectWithAABB" }
lttng view actually calls babeltrace with current profile session path, equivalent babeltrace command:
$ babeltrace ~/lttng-traces/my-session-20180218-184338/ust/uid/<your uid>/64-bit
In path my-session refers to the session name you provided to lttng create and following number are timestamp of when the trace was captured.
You could see here messages defined in src/raytrace.c, time at which we're executed, time delta between events, event type (here is only one, becuase we only enabled one), CPU at which function was running. After quick look you could see the limitations of the tracef function: we called tracef in a function which was called from different threads. That's why we got here "three intertwine" profiles. Also tracef uses vasprintf to save data, which is not the most optimal way to save data. In the next example we will write own trace definition and use it in our application.
Own trace
Defining own trace definition and enabling it in application is a bit more complicated, but gives better controll what data will be saved in the profile.
Below is typical implementation of trace, first header file tp.h:
#ifdef LTTNG_MYTRACE
#undef TRACEPOINT_PROVIDER
#define TRACEPOINT_PROVIDER cray

#undef TRACEPOINT_INCLUDE
#define TRACEPOINT_INCLUDE "./tp.h"

#if !defined(_TP_H) || defined(TRACEPOINT_HEADER_MULTI_READ)
#define _TP_H

#include <lttng/tracepoint.h>

TRACEPOINT_EVENT(
  cray,
  my_first_tracepoint,
  TP_ARGS(
    int, my_integer_arg,
    char*, my_string_arg                                   ),

  TP_FIELDS(
    ctf_string(my_string_field, my_string_arg)
    ctf_integer(int, my_integer_field, my_integer_arg)
  )
)

#endif /* _TP_H */

#include <lttng/tracepoint-event.h>

#endif /* LTTNG_MYTRACE */
From the beggining:
-
#ifdef LTTNG_MYTRACEand#endif /* LTTNG_MYTRACE */conditionally enables compilation of tracepoint. In regular application it woudn't be needed, but becauseMakefilewe're adjusting gathers sources to compile with glob '*.c' we need this to be able to conditionally include compilation of this trace. - following
#undefand#defineregisterscraytracepoint provider. In the previous example it waslttng_ust_tracef, - next few preprocessor directives calls macros which set options required to generate tracepoint, generally bolierplate code,
-
TRACEPOINT_EVENTis definition of our trace, at compilation time preprocessor will generate code from this definition,-
crayis trace provider, it have to matchTRACEPOINT_PROVIDERdefined above, -
my_first_tracepointis name of the tracepoint, -
TP_ARGSis list of arguments our trace function will accept, the format is:type,name of the variable, ... For obvious reasons length of this list mus tbe even, -
TP_FIELDSdefines how parameters specified above should be logged:-
ctf_string(my_string_field, my_string_arg)- string argument, it will be saved as(my_string_field = XXX)whereXXXis the value passed inmy_string_arg -
ctf_integer(int, my_integer_field, my_integer_arg)- signed 64bit int argument, it will be saved as(my_integer_field = XXX)whereXXXis vaule passed inmy_integer_arg
-
-
- at the end there are matching
#endifand include of header withlttng's macros.
tp.c file is boring, most likely you won't need to change much of this. The two key lines are #define TRACEPOINT_CREATE_PROBES adn #define TRACEPOINT_DEFINE which at compilation phase will instrument precprocessor to generate tracepoint code from 'defines' we wrote in tp.h.
#ifdef LTTNG_MYTRACE

#define TRACEPOINT_CREATE_PROBES
#define TRACEPOINT_DEFINE

#include "tp.h"

#endif /* LTTNG_MYTRACE */
Lastly in Makefile, below LTTNG_SIMPLE:
ifdef LTTNG_MYTRACE
	CFLAGS += -Isrc -DLTTNG -DLTTNG_MYTRACE
	LFLAGS += -llttng-ust -ldl
endif
It's very similar to previous example, only notable change here is -Isrc which tp.c will require to corectly include tp.h file.
To compile project:
$ make clean
$ LTTNG_MYTRACE=1 make
With this we compiled tp.c object and added it to our application, but we didn't place calls to our newly defined trace in any of the codepaths, so resulting trace would be empty, time to change this.
...
Now in term #1 start lttng session:
$ lttng create my-trace
Session my-trace created.
Traces will be written in /home/erdk/lttng-traces/my-trace-20180218-202218
In term #2 execute c-ray:
$ bin/c-ray
Now back to #1. When you list available events at the bottom you'll see our newly defined tracepoint:
~ » lttng list -u
UST events:
-------------

PID: 30053 - Name: bin/c-ray
      lttng_ust_tracelog:TRACE_DEBUG (loglevel: TRACE_DEBUG (14)) (type: tracepoint)
      lttng_ust_tracelog:TRACE_DEBUG_LINE (loglevel: TRACE_DEBUG_LINE (13)) (type: tracepoint)
      lttng_ust_tracelog:TRACE_DEBUG_FUNCTION (loglevel: TRACE_DEBUG_FUNCTION (12)) (type: tracepoint)
      lttng_ust_tracelog:TRACE_DEBUG_UNIT (loglevel: TRACE_DEBUG_UNIT (11)) (type: tracepoint)
      lttng_ust_tracelog:TRACE_DEBUG_MODULE (loglevel: TRACE_DEBUG_MODULE (10)) (type: tracepoint)
      lttng_ust_tracelog:TRACE_DEBUG_PROCESS (loglevel: TRACE_DEBUG_PROCESS (9)) (type: tracepoint)
      lttng_ust_tracelog:TRACE_DEBUG_PROGRAM (loglevel: TRACE_DEBUG_PROGRAM (8)) (type: tracepoint)
      lttng_ust_tracelog:TRACE_DEBUG_SYSTEM (loglevel: TRACE_DEBUG_SYSTEM (7)) (type: tracepoint)
      lttng_ust_tracelog:TRACE_INFO (loglevel: TRACE_INFO (6)) (type: tracepoint)
      lttng_ust_tracelog:TRACE_NOTICE (loglevel: TRACE_NOTICE (5)) (type: tracepoint)
      lttng_ust_tracelog:TRACE_WARNING (loglevel: TRACE_WARNING (4)) (type: tracepoint)
      lttng_ust_tracelog:TRACE_ERR (loglevel: TRACE_ERR (3)) (type: tracepoint)
      lttng_ust_tracelog:TRACE_CRIT (loglevel: TRACE_CRIT (2)) (type: tracepoint)
      lttng_ust_tracelog:TRACE_ALERT (loglevel: TRACE_ALERT (1)) (type: tracepoint)
      lttng_ust_tracelog:TRACE_EMERG (loglevel: TRACE_EMERG (0)) (type: tracepoint)
      lttng_ust_tracef:event (loglevel: TRACE_DEBUG (14)) (type: tracepoint)
      lttng_ust_lib:unload (loglevel: TRACE_DEBUG_LINE (13)) (type: tracepoint)
      lttng_ust_lib:debug_link (loglevel: TRACE_DEBUG_LINE (13)) (type: tracepoint)
      lttng_ust_lib:build_id (loglevel: TRACE_DEBUG_LINE (13)) (type: tracepoint)
      lttng_ust_lib:load (loglevel: TRACE_DEBUG_LINE (13)) (type: tracepoint)
      lttng_ust_statedump:end (loglevel: TRACE_DEBUG_LINE (13)) (type: tracepoint)
      lttng_ust_statedump:debug_link (loglevel: TRACE_DEBUG_LINE (13)) (type: tracepoint)
      lttng_ust_statedump:build_id (loglevel: TRACE_DEBUG_LINE (13)) (type: tracepoint)
      lttng_ust_statedump:bin_info (loglevel: TRACE_DEBUG_LINE (13)) (type: tracepoint)
      lttng_ust_statedump:start (loglevel: TRACE_DEBUG_LINE (13)) (type: tracepoint)
      cray:my_first_tracepoint (loglevel: TRACE_DEBUG_LINE (13)) (type: tracepoint)
Now we enable it, resume program execution and after short time we will inspect our profile:
In #1:
$ lttng enable-event -u 'cray:my_first_tracepoint'
$ lttng start
In #2 press <ENTER>. After ~2min in #1:
$ lttng stop
$ lttng view | head -n 10
~ » lttng view | head -n 10
[20:26:34.825989192] (+?.?????????) andromeda cray:my_first_tracepoint: { cpu_id = 3 }, { my_string_field = "before reyIntersectWithAABB", my_integer_field = 30344 }
[20:26:34.825994723] (+0.000005531) andromeda cray:my_first_tracepoint: { cpu_id = 2 }, { my_string_field = "before reyIntersectWithAABB", my_integer_field = 30345 }
[20:26:34.826003012] (+0.000008289) andromeda cray:my_first_tracepoint: { cpu_id = 2 }, { my_string_field = "before reyIntersectWithAABB", my_integer_field = 30346 }
[20:26:34.826012860] (+0.000009848) andromeda cray:my_first_tracepoint: { cpu_id = 2 }, { my_string_field = "before reyIntersectWithAABB", my_integer_field = 30345 }
[20:26:34.826013447] (+0.000000587) andromeda cray:my_first_tracepoint: { cpu_id = 2 }, { my_string_field = "rayIntersectsWithPolygon", my_integer_field = 30345 }
[20:26:34.826015514] (+0.000002067) andromeda cray:my_first_tracepoint: { cpu_id = 2 }, { my_string_field = "before reyIntersectWithAABB", my_integer_field = 30345 }
[20:26:34.826016248] (+0.000000734) andromeda cray:my_first_tracepoint: { cpu_id = 2 }, { my_string_field = "rayIntersectsWithPolygon", my_integer_field = 30345 }
[20:26:34.826016936] (+0.000000688) andromeda cray:my_first_tracepoint: { cpu_id = 2 }, { my_string_field = "after intersecting with nodes", my_integer_field = 30345 }
[20:26:34.826017850] (+0.000000914) andromeda cray:my_first_tracepoint: { cpu_id = 2 }, { my_string_field = "before reyIntersectWithAABB", my_integer_field = 30345 }
[20:26:34.826018845] (+0.000000995) andromeda cray:my_first_tracepoint: { cpu_id = 2 }, { my_string_field = "before reyIntersectWithAABB", my_integer_field = 30345 }
Remeber that lttng stores traces in fiexd sized buffers, if size of the buffer is too low you'll see following warning:
[warning] Tracer discarded 2349 events between [20:26:35.656284527] and [20:26:35.669416457] in trace UUID 283815817ab4f419a7bb9ea5618927, at path: ".../lttng-traces/my-trace-20180218-202218/ust/uid/1000/64-bit", within stream id 0, at relative path: "channel0_0". You should consider recording a new trace with larger buffers or with fewer events enabled.
Multiple tracepoints
Similarily you could add more traces, e.g. from tp2.h:
#ifdef LTTNG_MULTITRACE
#undef TRACEPOINT_PROVIDER
#define TRACEPOINT_PROVIDER cray

#undef TRACEPOINT_INCLUDE
#define TRACEPOINT_INCLUDE "./tp2.h"

#if !defined(_TP2_H) || defined(TRACEPOINT_HEADER_MULTI_READ)
#define _TP2_H

#include <lttng/tracepoint.h>

TRACEPOINT_EVENT(
  cray,
  intersect_aabb,
  TP_ARGS(void),
)

TRACEPOINT_EVENT(
  cray,
  intersect_nodes,
  TP_ARGS(void),
)

TRACEPOINT_EVENT(
  cray,
  intersect_polygon,
  TP_ARGS(void),
)


#endif /* _TP2_H */

#include <lttng/tracepoint-event.h>

#endif /* LTTNG_MULTITRACE */
Here we defined 3 tracepoints, each without arguments. Youd could inspect them at runtime (remeber to create lttng session first!):
$ lttng list -u
UST events:
-------------

PID: 1355 - Name: bin/c-ray
      lttng_ust_tracelog:TRACE_DEBUG (loglevel: TRACE_DEBUG (14)) (type: tracepoint)
      lttng_ust_tracelog:TRACE_DEBUG_LINE (loglevel: TRACE_DEBUG_LINE (13)) (type: tracepoint)
      lttng_ust_tracelog:TRACE_DEBUG_FUNCTION (loglevel: TRACE_DEBUG_FUNCTION (12)) (type: tracepoint)
      lttng_ust_tracelog:TRACE_DEBUG_UNIT (loglevel: TRACE_DEBUG_UNIT (11)) (type: tracepoint)
      lttng_ust_tracelog:TRACE_DEBUG_MODULE (loglevel: TRACE_DEBUG_MODULE (10)) (type: tracepoint)
      lttng_ust_tracelog:TRACE_DEBUG_PROCESS (loglevel: TRACE_DEBUG_PROCESS (9)) (type: tracepoint)
      lttng_ust_tracelog:TRACE_DEBUG_PROGRAM (loglevel: TRACE_DEBUG_PROGRAM (8)) (type: tracepoint)
      lttng_ust_tracelog:TRACE_DEBUG_SYSTEM (loglevel: TRACE_DEBUG_SYSTEM (7)) (type: tracepoint)
      lttng_ust_tracelog:TRACE_INFO (loglevel: TRACE_INFO (6)) (type: tracepoint)
      lttng_ust_tracelog:TRACE_NOTICE (loglevel: TRACE_NOTICE (5)) (type: tracepoint)
      lttng_ust_tracelog:TRACE_WARNING (loglevel: TRACE_WARNING (4)) (type: tracepoint)
      lttng_ust_tracelog:TRACE_ERR (loglevel: TRACE_ERR (3)) (type: tracepoint)
      lttng_ust_tracelog:TRACE_CRIT (loglevel: TRACE_CRIT (2)) (type: tracepoint)
      lttng_ust_tracelog:TRACE_ALERT (loglevel: TRACE_ALERT (1)) (type: tracepoint)
      lttng_ust_tracelog:TRACE_EMERG (loglevel: TRACE_EMERG (0)) (type: tracepoint)
      lttng_ust_tracef:event (loglevel: TRACE_DEBUG (14)) (type: tracepoint)
      lttng_ust_lib:unload (loglevel: TRACE_DEBUG_LINE (13)) (type: tracepoint)
      lttng_ust_lib:debug_link (loglevel: TRACE_DEBUG_LINE (13)) (type: tracepoint)
      lttng_ust_lib:build_id (loglevel: TRACE_DEBUG_LINE (13)) (type: tracepoint)
      lttng_ust_lib:load (loglevel: TRACE_DEBUG_LINE (13)) (type: tracepoint)
      lttng_ust_statedump:end (loglevel: TRACE_DEBUG_LINE (13)) (type: tracepoint)
      lttng_ust_statedump:debug_link (loglevel: TRACE_DEBUG_LINE (13)) (type: tracepoint)
      lttng_ust_statedump:build_id (loglevel: TRACE_DEBUG_LINE (13)) (type: tracepoint)
      lttng_ust_statedump:bin_info (loglevel: TRACE_DEBUG_LINE (13)) (type: tracepoint)
      lttng_ust_statedump:start (loglevel: TRACE_DEBUG_LINE (13)) (type: tracepoint)
      cray:intersect_polygon (loglevel: TRACE_DEBUG_LINE (13)) (type: tracepoint)
      cray:intersect_nodes (loglevel: TRACE_DEBUG_LINE (13)) (type: tracepoint)
      cray:intersect_aabb (loglevel: TRACE_DEBUG_LINE (13)) (type: tracepoint)
Now you could enable one of them:
$ lttng enable-event -u 'cray:intersect_polygon'
Or all:
$ lttng enable-event -u 'cray:*'
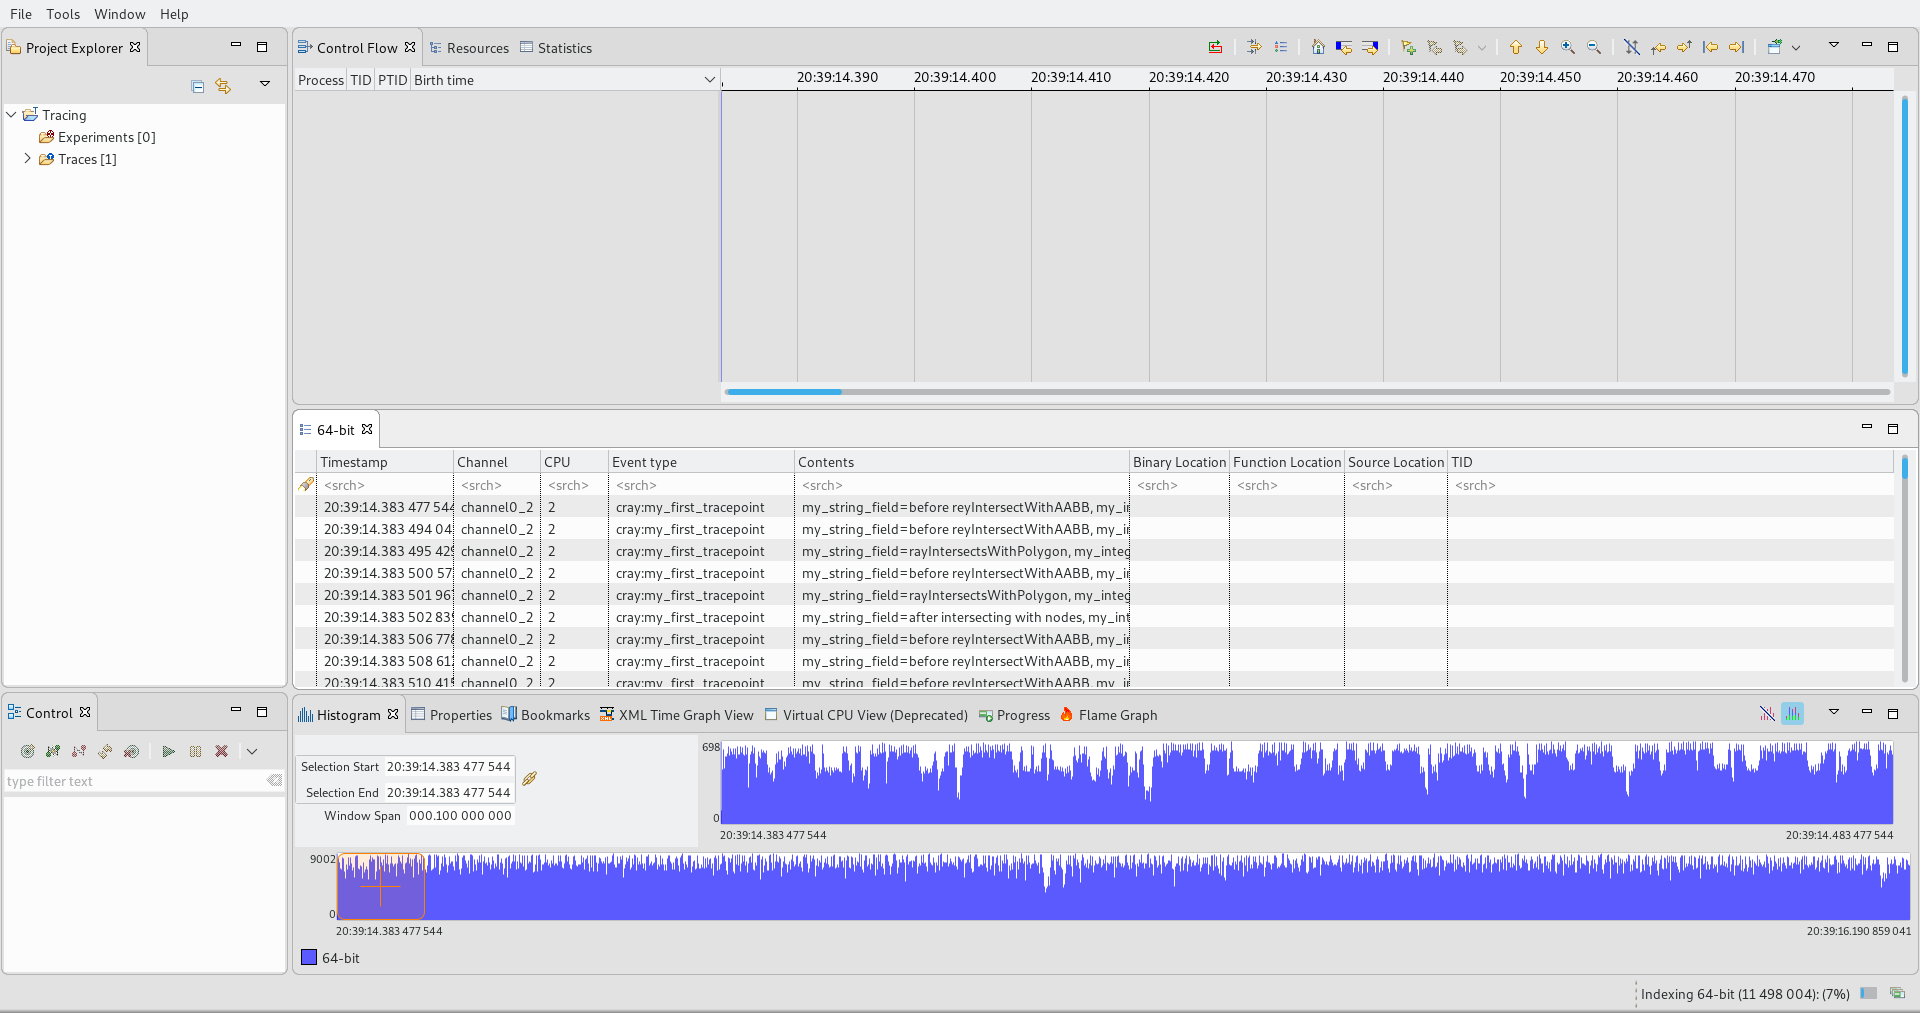
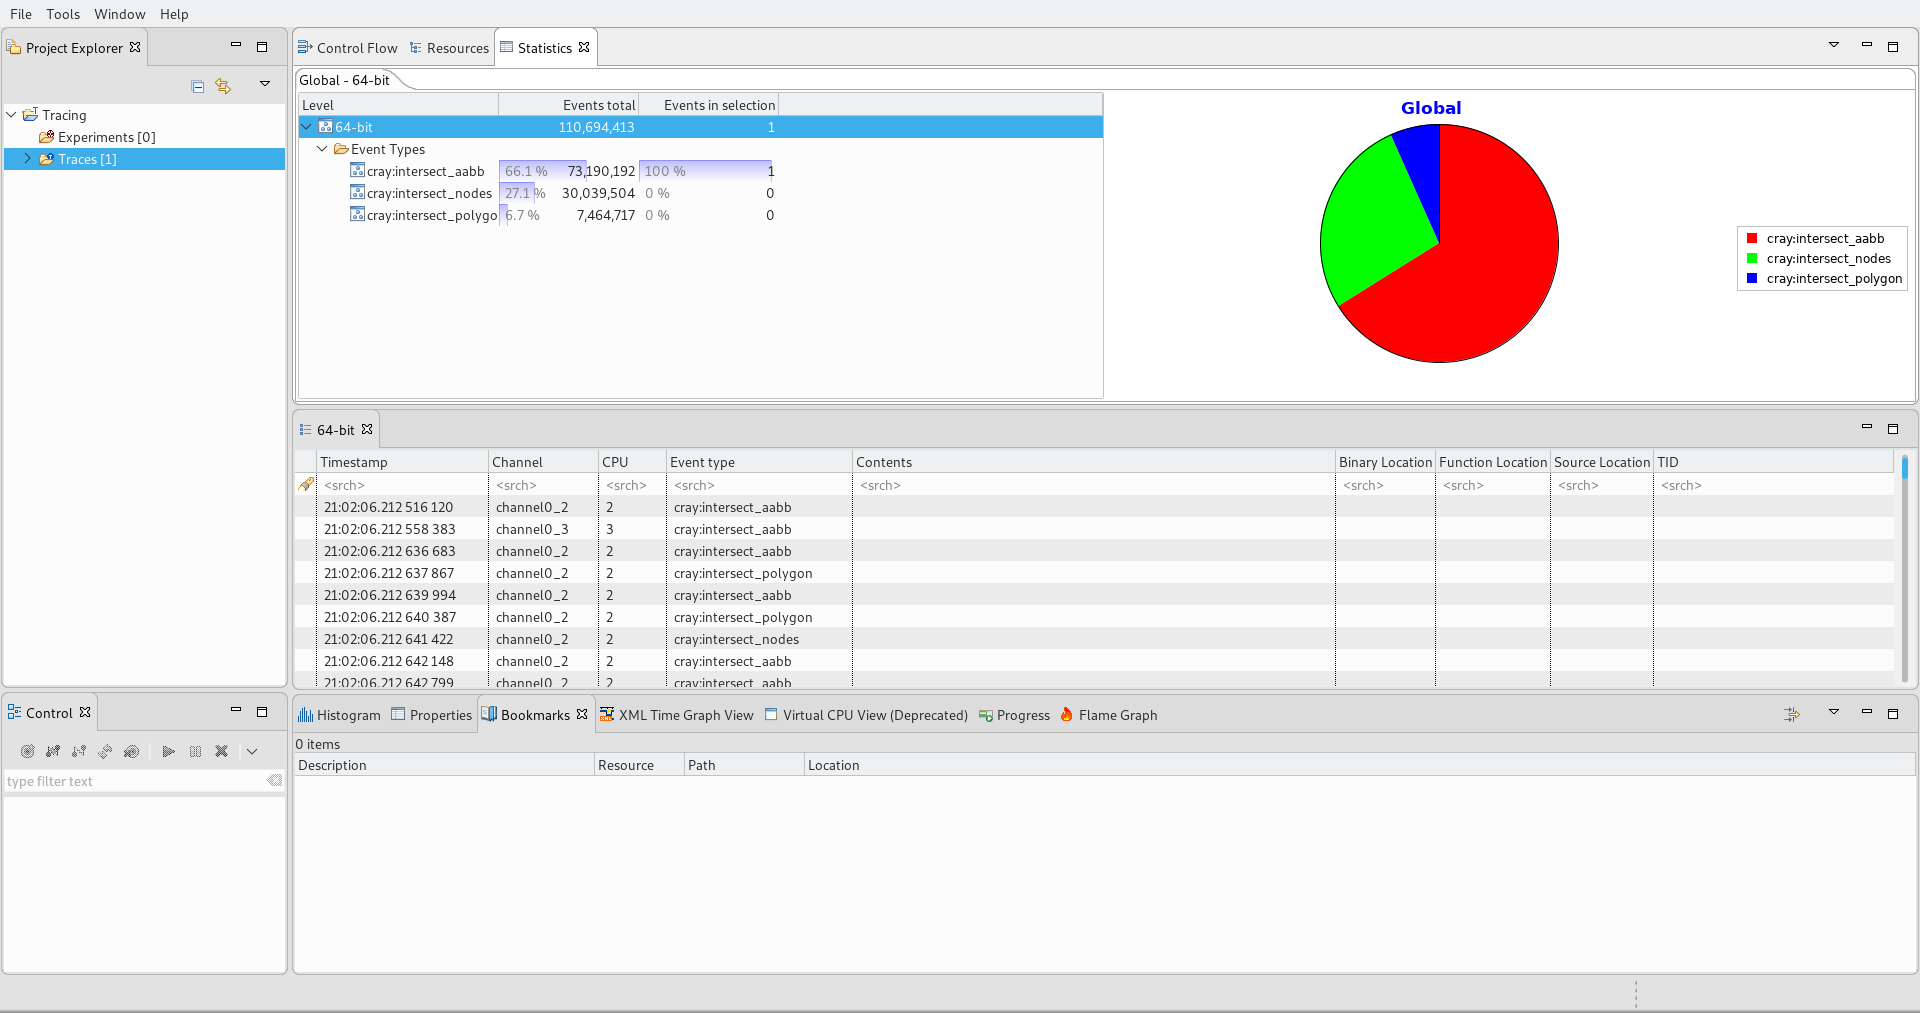
Inspect trace with TraceComapss
From http://tracecompass.org download TraceCompass and run it. It's based on Eclipse, so you'll need Java 7+ to run it (Java 9 not supported yet). After downloading run the program and from File menu chose Open Trace. Then navigate to $HOME\lttng-traces\<session name + timestamp>\ust\uid\<your user uid>\64-bit\ and choose metadata.
Here is screenshot with data collected whit enabled cray:my_first_tracepoint:
And here with multi tracepoint example:
zipkin & blkin
Other tools
go pprof
Sources
- gprof: https://www.thegeekstuff.com/2012/08/gprof-tutorial/
- gprof:
man gprof - perf: https://dev.to/etcwilde/perf---perfect-profiling-of-cc-on-linux-of
- perf: https://perf.wiki.kernel.org/index.php/Tutorial
- perf: http://www.brendangregg.com/perf.html
- valgrind: http://valgrind.org/docs/manual/cl-manual.html
- (Q|K)cachegrind: https://github.com/KDE/kcachegrind
- LTTNG: https://lttng.org/docs/v2.10/#doc-what-is-tracing

