appspector / Ios Sdk
Programming Languages
Labels
Projects that are alternatives of or similar to Ios Sdk


With AppSpector you can remotely debug your app running in the same room or on another continent. You can measure app performance, view database content, logs, network requests and many more in realtime. This is the instrument that you've been looking for. Don't limit yourself only to simple logs. Debugging don't have to be painful!
Installation
Each app you want to use with AppSpector SDK you have to register on the web (https://app.appspector.com). After adding the application navigate to app settings and copy API key. To use AppSpector on tvOS just follow installation steps below but use AppSpectorTVSDK instead.
CocoaPods
To use CocoaPods add this line to your podfile and run pod install:
pod 'AppSpectorSDK'
To get SDK version with encryption feature use AppSpectorE2E pod:
pod 'AppSpectorSDKE2E'
Carthage
- Install Carthage
- Add
binary "https://github.com/appspector/ios-sdk/raw/1.4.0/AppSpector.json"to your Cartfile - Run
carthage update - Drag AppSpectorSDK.framework from the appropriate platform directory in Carthage/Build/ to the “Linked Frameworks and Libraries” section of your Xcode project’s “General” settings
To get SDK version with encryption feature use AppSpectorE2E link:
https://raw.githubusercontent.com/appspector/ios-sdk/1.4.0/AppSpectorE2E.json
SPM
AppSpector supports SPM but unfortunately not for E2E version. Long story short: we have to wait for guys from openssl to support Apple Sillicon, so if you need version with end-to-end encryption please refer to the main repo (https://github.com/appspector/ios-sdk) and use one of the installation methods available.
For the rest of you: to install SDK via SPM just press '+' sign in Xcode list of packages and paste repo address: 'https://github.com/appspector/ios-sdk-spm' into the search field:
 Two targets will be available: for iOS and tvOS, choose which one you need, press 'next' and you are done:

Manually
To manually link just download AppSpectorSDK.framework and drop AppSpectorSDK.framework to your XCode project. Then navigate to your project settings and under 'General' tab add AppSpectorSDK framework to 'Embedded Binaries' section.
If you plan either to submit builds with AppSpector SDK to the Apple TestFlight for testing or archive them for AdHoc distribution you'll have to perform one more step: create a new “Run Script Phase” in your app’s target’s “Build Phases” and paste the following script:
code_sign() {
    echo "Code Signing $1 with Identity ${EXPANDED_CODE_SIGN_IDENTITY_NAME}"
    echo "/usr/bin/codesign --force --sign ${EXPANDED_CODE_SIGN_IDENTITY} --preserve-metadata=identifier,entitlements $1"
    /usr/bin/codesign --force --sign ${EXPANDED_CODE_SIGN_IDENTITY} --preserve-metadata=identifier,entitlements "$1"
}

cd "${BUILT_PRODUCTS_DIR}/${FRAMEWORKS_FOLDER_PATH}"

for file in $(find . -type f -perm +111); do
    if ! [[ "$(file "$file")" == *"dynamically linked shared library"* ]]; then
        continue
    fi

    archs="$(lipo -info "${file}" | rev | cut -d ':' -f1 | rev)"
    stripped=""
    for arch in $archs; do
        if ! [[ "${VALID_ARCHS}" == *"$arch"* ]]; then
            lipo -remove "$arch" -output "$file" "$file" || exit 1
            stripped="$stripped $arch"
        fi
    done

    if [[ "$stripped" != "" ]]; then
        echo "Stripped $file of architectures:$stripped"
        if [ "${CODE_SIGNING_REQUIRED}" == "YES" ]; then
            code_sign "${file}"
        fi
    fi
done
This script is required as a workaround for this Apple AppStore bug
Apple TV
AppSpector is also available for tvOS, you can use any of described above methods to install it, all you need is just use AppSpectorTVSDK pod instead of AppSpectorSDK and include AppSpectorTVSDK.framework instead of AppSpectorSDK.framework.
Join our slack to discuss setup process and features
Features
AppSpector provides 10 monitors that tracks different activities inside your app:
Monitors
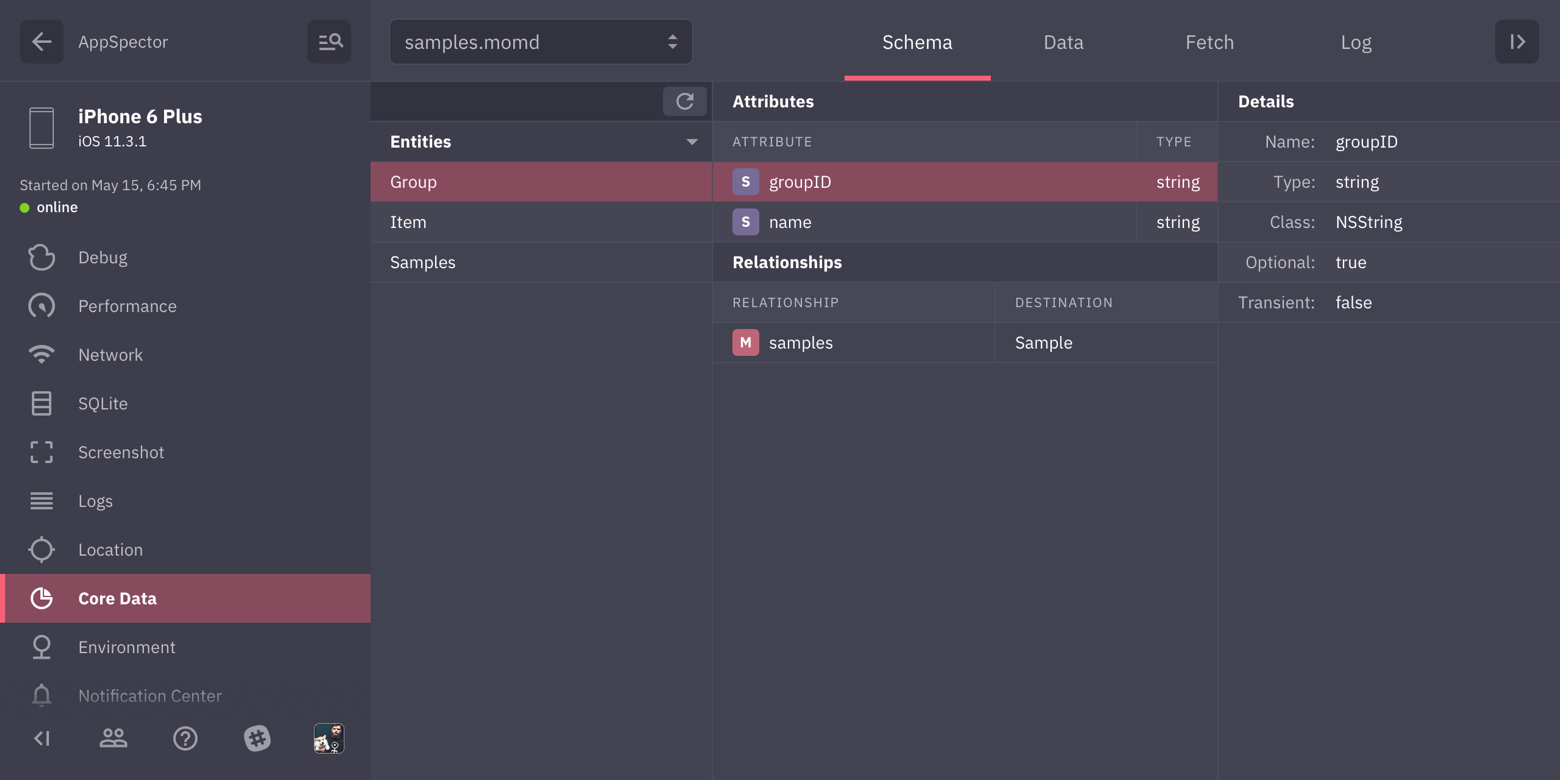
CoreData monitor
Browser for CoreData stores in your app. Shows model scheme just like Xcode editor, allows to navigate data, follow relations, switching contexts and running custom fetch requests against any model / context.
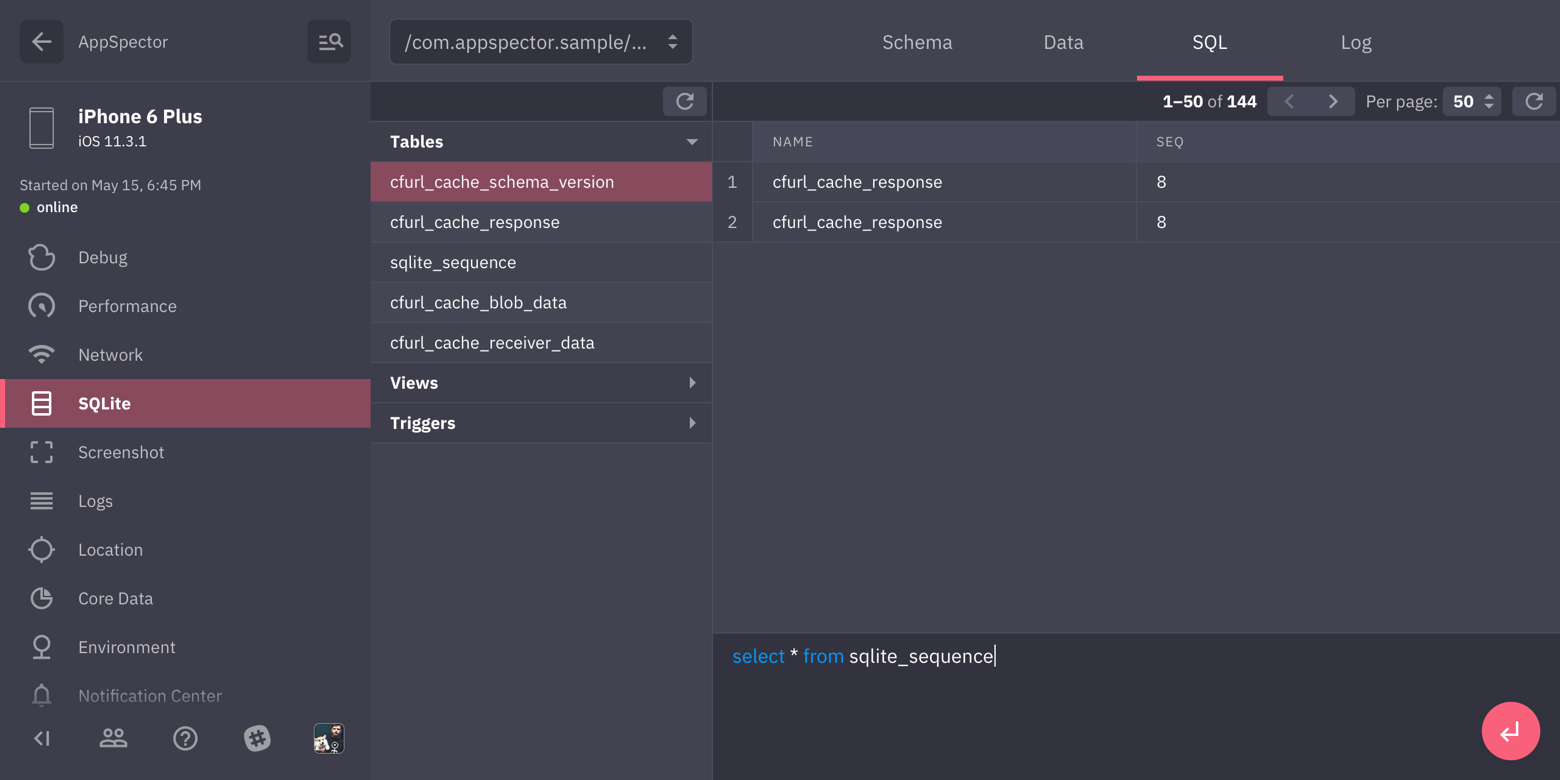
SQLite monitor
Provides browser for sqlite databases found in your app. Allows to track all queries, shows DB scheme and data in DB. You can issue custom SQL query on any DB and see results in browser immediately.
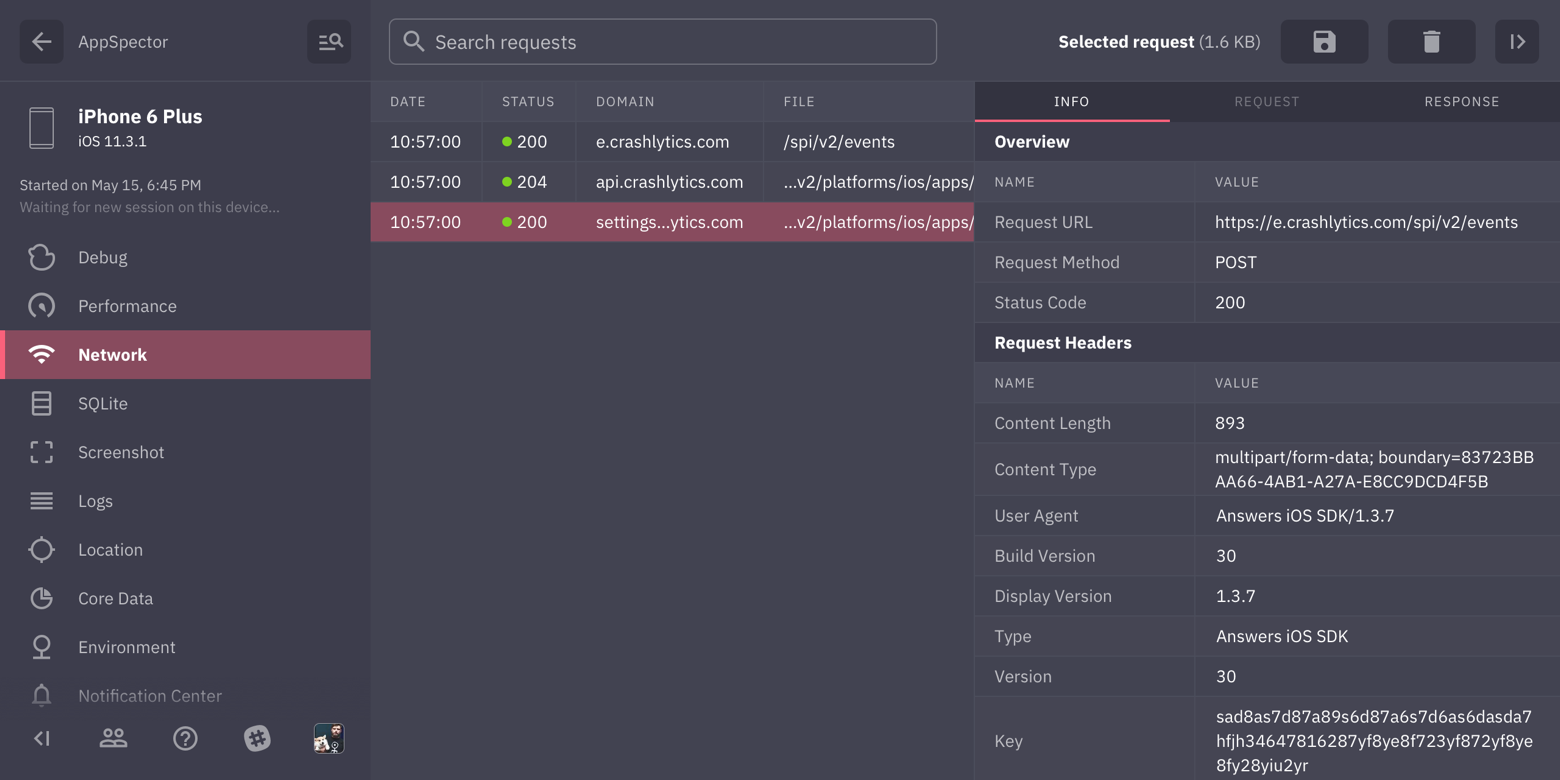
HTTP monitor
Shows all HTTP traffic in your app. You can examine any request, see request/response headers and body. We provide XML and JSON highliting for request/responses with formatting and folding options so even huge responses are easy to look through.
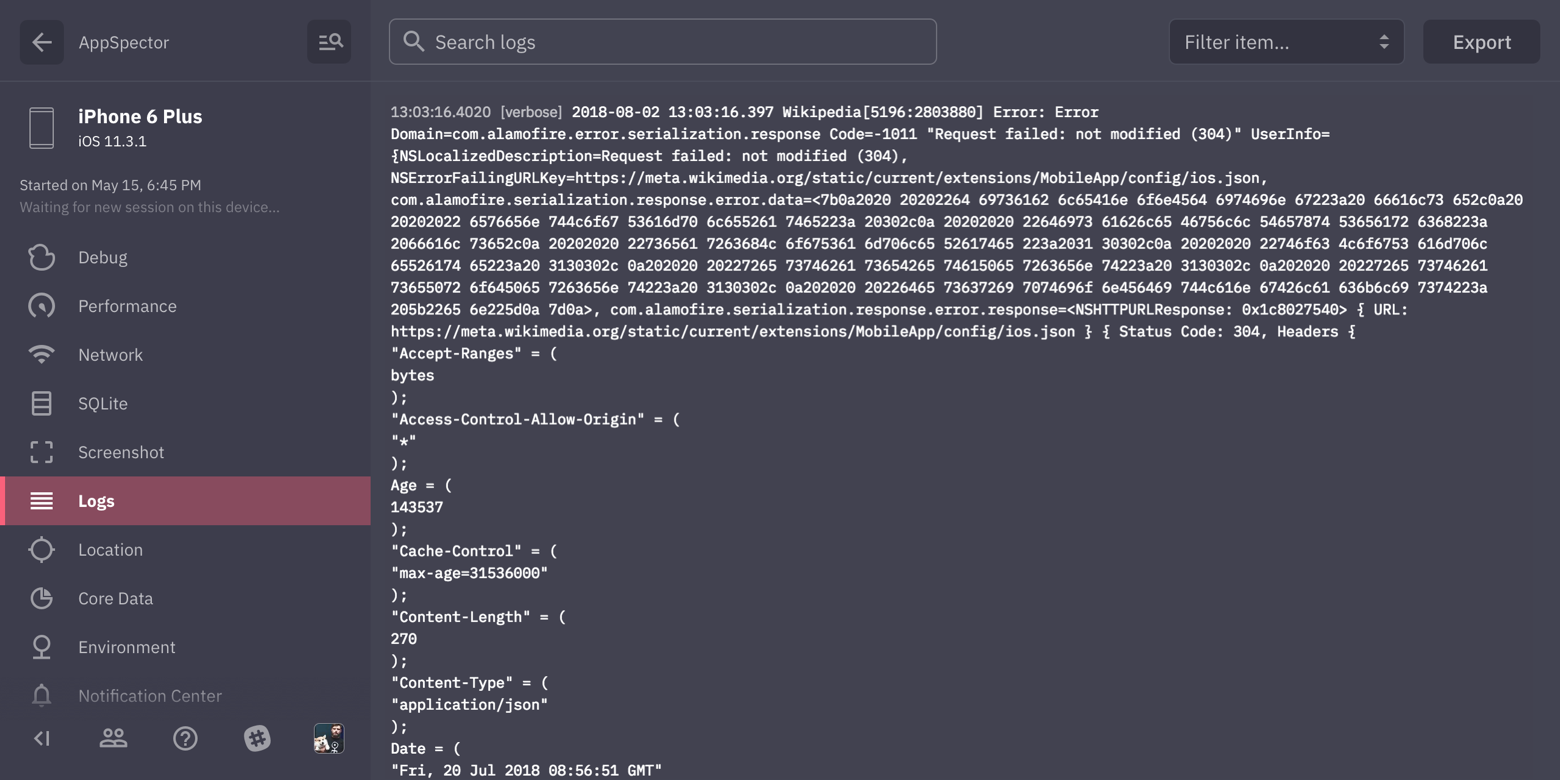
Logs monitor
Displays all logs generated by your app. We provide integration with popular logging framework CocoaLumberjack, all your logs written with loggers from it will be displayed with respect to their logging levels.
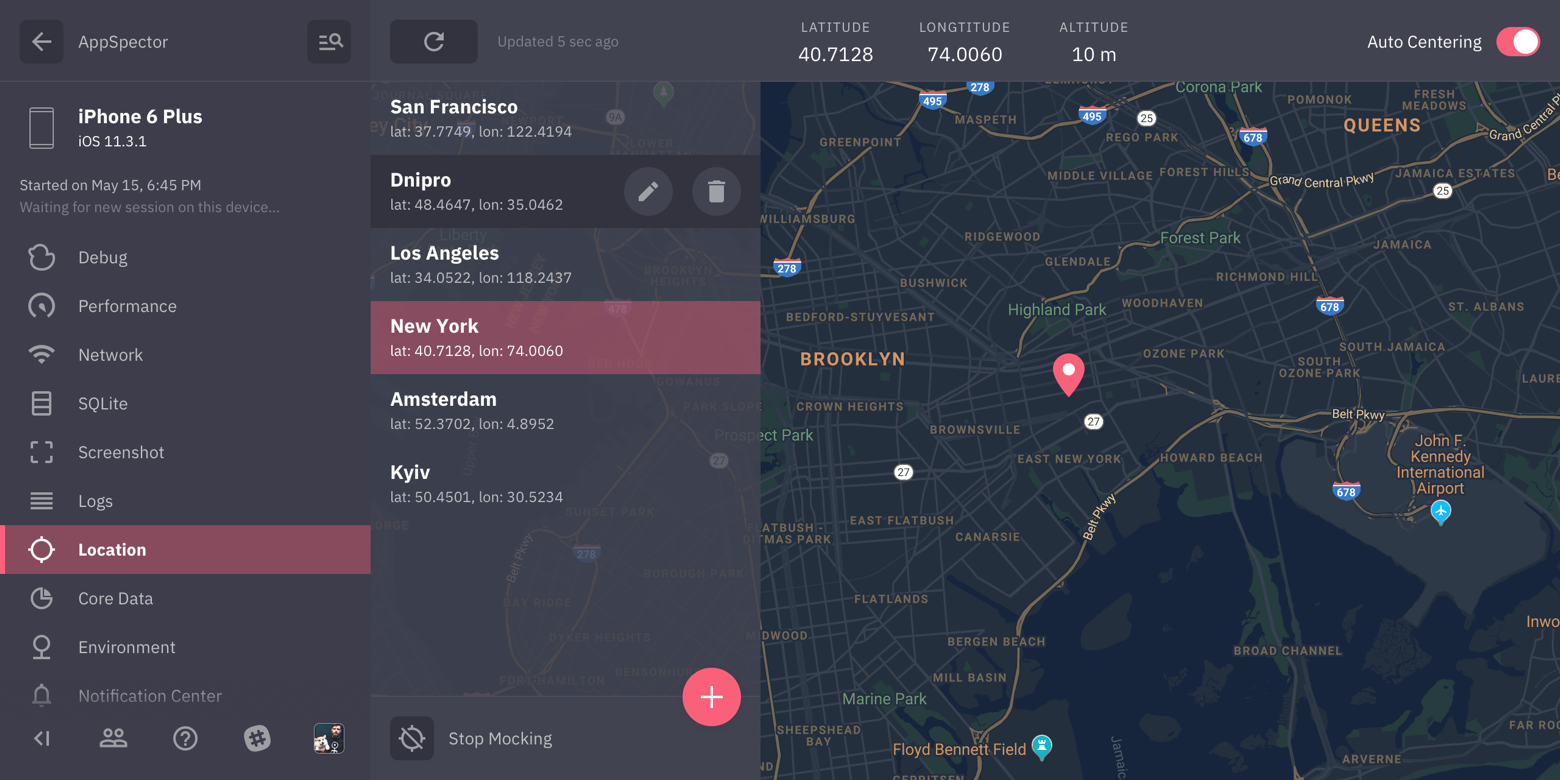
Location monitor
Most of the apps are location-aware. Testing it requires changing locations yourself. In this case, location mocking is a real time saver. Just point to the location on the map and your app will change its geodata right away.
Screenshot monitor
Simply captures screenshot from the device.
Performance monitor
Displays real-time graphs of the CPU / Memory/ Network / Disk / Battery usage.
Environment monitor
Gathers all of the environment variables and arguments in one place, info.plist, cli arguments and much more.
Notification Center monitor
Tracks all posted notifications and subscriptions. You can examine notification user info, sender/reciever objects, etc. And naturally you can post notifications to your app from the frontend.
File System monitor
Provides access to the application sandbox and bundle. Using this monitor you can download, remove or upload files, create directories and just walk around your app FS.
Commands monitor
In short commands monitor is a remote callback collection. It allows you to register custom class as a command then trigger it from the frontend and complete or fail it from your code after performing some actions. To register the command it should be inherited from the ASCommand class:
Obj-C:
@interface GetAppAuthStatus : ASCommand
@end

@implementation MyCommand
+ (NSString *)category { return @"utils"; }
+ (NSString *)name { return @"logs"; }
@end
Swift:
class GetAppAuthStatus: ASCommand {
    override class var category: String { "utils" }
    override class var name: String { "logs" }
    override init() {}
}
Note that you need to mark command parameters as @objc dynamic var and optional in Swift.
For more details please see ASCommand header.
After creating command class you need to register it with SDK and provide callback:
Obj-C:
[AppSpector addCommand:[GetAppAuthStatus class] withCallback:^(GetAppAuthStatus *c) {
   Status status = [[AuthService shared] status];
   c.complete(status);
}];
Swift:
AppSpector.addCommand(GetAppAuthStatus.self, withCallback: { c in
   let status = AuthService.shared().status;
   c.complete(status);
})
Once you trigger command from the frontend callback will be triggered and command instance populated with data you filled in on the frontend will be passed as an argument. Inside the callback you should either call complete with params to finish te command or fail to fail it. Note please that queue callback will be triggered on is not guaranteed and never will be the main queue.
Events monitor
Events monitor allows you to send custom built event to the current session. Event will be processed as any other monitor event, displayed and stored in history.
To send event you build an instance of any object conforming to ASCustomEventPayload protocol.
Payload protocol defines three properties of the event:
-
nameis a unique name for the event. It's how you'll distinguish deifferent events. -
categoryis used for a events grouping. e.g. you can have a "networking" group where you have events related to your app network layer. -
payloadis a dictionary containing data as a key/value pairs you want to attach to the event. Only KVC compliant types are supported.
All of the above will be displayed on a frontend so you can easily find events.
After you have an instance of the payload you need to send it to the AppSpector SDK:
Objective-C:
+ (void)sendCustomEventWith:(id <ASCustomEventPayload>)payload;
Swift:
open class func sendCustomEvent(with payload: ASCustomEventPayload)
This method is thread safe and can be used from any thread. Payloads are just data containers so you can store them in your app as you want, send later, persist etc.
Lets see an example of sendind a simple event:
First define a class conforming to a ASCustomEventPayload protocol:
Objective-C:
// ASTestCustomEventPayload.h

#import <AppSpectorSDK/AppSpector.h>

@interface ASTestCustomEventPayload : NSObject <ASCustomEventPayload>

@property (nonatomic, strong) NSString *name;
@property (nonatomic, strong) NSString *category;
@property (nonatomic, strong) NSDictionary *payload;

@end
// ASTestCustomEventPayload.m
@implementation ASTestCustomEventPayload
@end
Swift:
class ASTestCustomEventPayload: NSObject, ASCustomEventPayload {
    var name: String!
    var category: String!
    var payload: [AnyHashable : Any]!
}
Then make an instance of it:
Objective-C:
ASTestCustomEventPayload *payload = [ASTestCustomEventPayload new];
payload.name = @"My sample event";
payload.category = @"Testing events";
payload.payload = @{ @"int" : @1,
                     @"float" : @(3.14f),
                     @"bool" : @YES,
                     @"string" : @"foo bar" };
Swift:
let payload = ASTestCustomEventPayload()
payload.name = "My sample event"
payload.category = "Testing events"
payload.payload = ["Triggered at": "\(Date())"]
And finally send it to the SDK:
Objective-C:
[AppSpector sendCustomEventWith:payload];
Swift:
AppSpector.sendCustomEvent(with: payload)
End-to-End encryption
AppSpector SDK collects and stores user data including logs, DB content and network traffic. All of this can contain sensetive data so to protect your privacy we offer separate build of the SDK with E2EE feature. It allows you to encrypt all data AppSpector sends from or to your device and be sure only you can decrypt it. To use encryption all you need is a special SDK version (see Installation for more details) and AppSpector desktop application. Due to security reasons encrypted sessions are only available in desktop app.
To start using encryption you have to create a new application from the desktop app and enable E2E switch. After that please navigate to setup guide where you can as usual get your API key and public key used for encrypted sessions. Pass this keys to the AppSpectorConfig and you are ready to go. Please refer to the Configure section for more details.
Filtering your data
Sometimes you may want to adjust or completely skip some pieces of data AppSpector gather. We have a special feature called Sanitizing for this, for now it's available only for HTTP and logs monitors, more coming.
For these two monitors you can provide a filter which allows to modify or block events before AppSpector sends them to the backend. Filter is a callback you assign to a AppSpectorConfig property httpSanitizer for HTTP monitor or logSanitizer for logs monitor. Filter callback gets event as its argument and should return it.
Some examples. Let's say we want to skip our auth token from requests headers:
[config.httpSanitizer setFilter:^ASHTTPEvent *(ASHTTPEvent *event) {
    if ([event.request.allHTTPHeaderFields.allKeys containsObject:@"YOUR-AUTH-HEADER"]) {
        [event.request setValue:@"redacted" forHTTPHeaderField:@"YOUR-AUTH-HEADER"];
    }

    return event;
}];
Or we want to raise log level to warning for all messages containing word 'token':
[config.logSanitizer setFilter:^ASLogMonitorEvent *(ASLogMonitorEvent *event) {
    if ([event.message rangeOfString:@"token"].location != NSNotFound) {
        event.level = ASLogEventLevelWarn;
    }

    return event;
}];
See events headers for more info.
Getting session URL
Sometimes you may need to get URL pointing to current session from code. Say you want link crash in your crash reporter with it, write it to logs or display in your debug UI. To get this URL you have to add a session start callback:
[config setStartCallback:^(NSURL *sessionURL) {
    // Save url for future use...
}];
Some hints:
- Callback get called on a non-main thread and not guaranteed to be called on a caller thread so be carefull with not thread-safe APIs inside it
- Callback will be called again upon restart, either when you call
stop/startmethods or when session was dropped due to networking issues
Configure
AppSpector uses modules called monitors to track different app activities and gather stats.
We provide a bunch of monitors out of the box which could be used together or in any combinations.
To start AppSpector you need to build instance of AppSpectorConfig and provide your API key.
You can start exact monitors with:
configWithAPIKey:(NSString *)apiKey monitorIDs:(NSSet <NSString *> *)monitorIDs
Or start all available with:
configWithAPIKey:(NSString *)apiKey
Available monitors:
AS_SCREENSHOT_MONITOR
AS_SQLITE_MONITOR
AS_HTTP_MONITOR
AS_COREDATA_MONITOR
AS_PERFORMANCE_MONITOR
AS_LOG_MONITOR
AS_LOCATION_MONITOR
AS_ENVIRONMENT_MONITOR
AS_NOTIFICATION_MONITOR
Swift
First import the framework:
import AppSpectorSDK
Start selected monitors only
let config = AppSpectorConfig(apiKey: "API_KEY", monitorIDs: [Monitor.http, Monitor.logs])
AppSpector.run(with: config)
or start all monitors
let config = AppSpectorConfig(apiKey: "API_KEY")
AppSpector.run(with: config)
Objective-C
First import the framework:
@import AppSpectorSDK;
Start selected monitors only
NSSet *monitorIDs = [NSSet setWithObjects:AS_HTTP_MONITOR, AS_LOG_MONITOR, nil];
AppSpectorConfig *config = [AppSpectorConfig configWithAPIKey:@"API_KEY" monitorIDs:monitorIDs];
[AppSpector runWithConfig:config];
or start all monitors
AppSpectorConfig *config = [AppSpectorConfig configWithAPIKey:@"API_KEY"];
[AppSpector runWithConfig:config];
To start encrypted session you need to use SDK version with E2EE enabled (see Installation for details) and provide your app public key alongside with API key:
Swift
let config = AppSpectorConfig(apiKey: "API_KEY", publicKey: "PUB_KEY")
AppSpector.run(with: config)
Objective-C
AppSpectorConfig *config = [AppSpectorConfig configWithAPIKey:@"API_KEY" publicKey:@"PUB_KEY"];
[AppSpector runWithConfig:config];
Custom device name
You can assign a custom name to your device to easily find needed sessions in sessions list.
To do this you have to add desired name as a value for AS_DEVICE_NAME_KEY key to the config.metadata dictionary:
Swift
let config = AppSpectorConfig(apiKey: "API_KEY", monitorIDs: [Monitor.http, Monitor.logs])
config.metadata = [ DeviceNameKey : "Your device name" ]
Objective-C
AppSpectorConfig *config = [AppSpectorConfig configWithAPIKey:@"API_KEY" monitorIDs:monitorIDs];
config.metadata = @{ AS_DEVICE_NAME_KEY : @"Your device name" };
Start/Stop SDK
AppSpector start is two step process.
When you link with AppSpector framework it starts to collect data immediately after load. When you call startWithConfig method - AppSpector opens a connection to the backend and from that point you can see your session on the frontend.
You can manually control AppSpector state by calling start and stop methods.
stop tells AppSpector to disable all data collection and close current session.
start starts it again using config you provided at load. This will be a new session, all activity between stop and start calls will not be tracked. To check current SDK state you can use + (BOOL)isRunning method.
Swift
AppSpector.stop()
AppSpector.start()
Objective-C
[AppSpector stop];
[AppSpector start];
Feedback
Let us know what do you think or what would you like to be improved: [email protected].