sylvainlaurent / Jdbc Performance Logger
Programming Languages
Labels
Projects that are alternatives of or similar to Jdbc Performance Logger

JDBC Performance Logger
Purpose
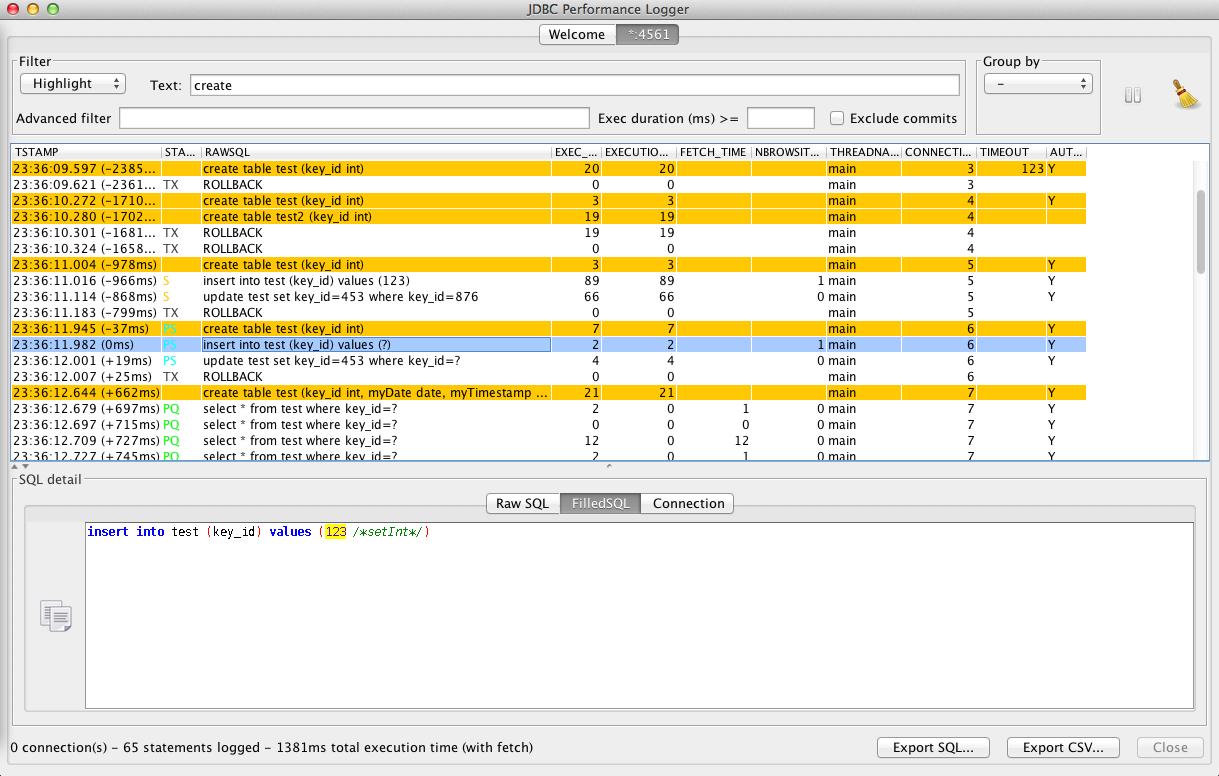
Measuring performance of SQL statements executed through JDBC.
(click on the image below for an overview of the features)
Why yet another project?
Although other tools already exist around JDBC performance monitoring (log4jdbc, P6Spy, JDbMonitor...), I did not find the features I was looking for : a GUI, measurement of statement execution and ResultSet iteration, cumulative measures, commit duration...
Features
- Graphical console (Swing-based) with analysis feature
- filter/highlight based on statement text, minimum execution time
- advanced filtering using custom SQL WHERE clause against the embedded H2 DB
- group statements to count executions of identical statements and measure cumulated time
- support for multiple connections
- the connection between the monitored java application (JDBC proxy driver) and the console can be initiated from either side
- Logging of bound values of prepared statements, including the name of the set* method called to bind the value (very helpful to distinguish setDate and setTimestamp to understand why Oracle does not use an index )
- Separate measure of statement execution time, results fetch time and result set usage time (includes result processing like creation of java object)
- Measures connection creation and commit/rollback durations
- Handling of batched statements
- Logging of SQLExceptions
- Displays the
queryTimeoutof each statement (no value means 0 or no timeout) (since 0.5.0) - Displays the
autoCommitstatus of each statement (since 0.6.0) - Supports new java 8 methods like
executeLargeUpdate(since 0.6.2) - Java agent (since 0.8.0)
Requirements
- java 8 (since 0.9)
How to download
- The package containing both the console and driver is available here : https://github.com/sylvainlaurent/JDBC-Performance-Logger/releases
- The driver is also available on Maven Central :
<dependency>
    <groupId>com.github.sylvainlaurent.jdbcperflogger</groupId>
    <artifactId>jdbc-perf-logger-agent</artifactId>
    <version>...</version>
</dependency>
or
<dependency>
    <groupId>com.github.sylvainlaurent.jdbcperflogger</groupId>
    <artifactId>jdbc-perf-logger-driver</artifactId>
    <version>...</version>
</dependency>
How to setup the JDBC Driver
The driver can be setup in different ways:
As a java agent (recommended/most simple way)
Just launch the JVM with -javaagent:path/to/jdbc-perf-logger-agent-x.y.z.jar
The agent jar file is available in the lib directory of the zip or tar.gz distribution or as a maven artifact as shown above.
Manual configuration
- If using maven, add the
<dependency>snippet above (replacing the version with the latest one) to yourpom.xml - If NOT using maven, add
jdbc-perf-logger-driverjar file to the classpath of the JDBC-client application (the file can be found in thelibdirectory of the binary distribution) - Change the driver class name to
ch.sla.jdbcperflogger.driver.WrappingDriver - Prefix your current JDBC URL with
jdbcperflogger:, example:jdbcperflogger:jdbc:h2:mem:orjdbcperflogger:jdbc:oracle:thin:@myhost:1521:orcl
Advanced configuration
- (optional) add a
jdbcperflogger.xmlfile to the classpath (see the example file for indications). If both the driver and console are used on the same machine, there's nothing to do: the driver will try to connect to the console on localhost:4561. - (optional) the location of the config file can be overriden with the System property
jdbcperflogger.config.location. Example :java -Djdbcperflogger.config.location=/Users/me/myjdbcperflogger.xml ....
How to use the graphical console
- launch
bin/jdbc-performance-logger-gui.sh(unix/MacOS) orbin\jdbc-performance-logger-gui.bat(requires java 8 JRE) - by default the console waits for connections from jdbc-logger-drivers on port 4561. All statements will be logged to the same tab
- The console can also connect to a jdbc-perf-logger-driver instance on a specific host and port. A tab is created for each host/port combination.
- Once a tab is opened, the status of the connection is indicated at the bottom of the panel. If the connection is broken and was initiated by the console, the console will try to reconnect regularly. If the connection was initiated by the driver, the latter will try to reconnect regularly.
- by default the console only keeps the last 20'000 statements. The number can be changed by adding the System property
maxLoggedStatementswhen launching the console.
Tested databases
- H2 (lightly, used for our own unit tests)
- Oracle 10.2/11.2/12.1
- MySQL 5.1
Current limitations
- No DataSource nor XADataSource class provided
- Only the first ResultSet of queries is logged (
Statement.getMoreResults()works but no effort has been put to log the fetching of those ResultSets)
Potential ClassLoader issues
There should not be any problem when using the "java agent way".
For the "driver way", here are the rules to observe :
- The jdbc-perf-logger-driver must be able to use your bare JDBC driver
- The DataSource you use must be able to use the jdbc-perf-logger-driver classes
Here are the most common cases with Tomcat :
- Tomcat shared.loader includes
- the DataSource implementation (which is by default for tomcat 7 DataSource)
- the bare JDBC driver
- the jdbc-perf-logger driver
This is the case if you place your JDBC driver and jdbc-perf-logger driver in the
libdirectory ofCATALINA_BASEorCATALINA_HOME. This can also be done by configuring thecatalina.propertiesfile.
- your WAR file embeds the jars for
- the DataSource implementation
- the bare JDBC driver
- the jdbc-perf-logger driver
- the JVM classpath includes the bare JDBC driver and the jdbc-perf-logger driver and the Tomcat shared.loader includes the DataSource implementation.
Source code
The source code is available on GitHub : https://github.com/sylvainlaurent/JDBC-Performance-Logger
How to build source
Use Maven and a JDK >=8, and run mvn clean verify in the root directory of the git repository. The binary distribution is then available in jdbc-perf-logger-gui.
How to create a release
mvn release:prepare release:perform and answer the questions about version number.
Then push the commits and tags to github.
License
This software is licensed under the Apache Sotware License version 2.0, see LICENSE.txt.
This software uses and redistributes third-party software, see 3rdparty_license.txt.