IHCantabria / Leaflet.canvaslayer.field
Programming Languages
Projects that are alternatives of or similar to Leaflet.canvaslayer.field
IH.Leaflet.CanvasLayer.Field
A plugin for LeafletJS that adds layers to visualize fields (aka Rasters) from ASCIIGrid or GeoTIFF files (EPSG:4326).
Warning! New url for npm install
npm install ih-leaflet-canvaslayer-field
Leaflet.CanvasLayer.Field EXAMPLES

![]()
It includes:
-
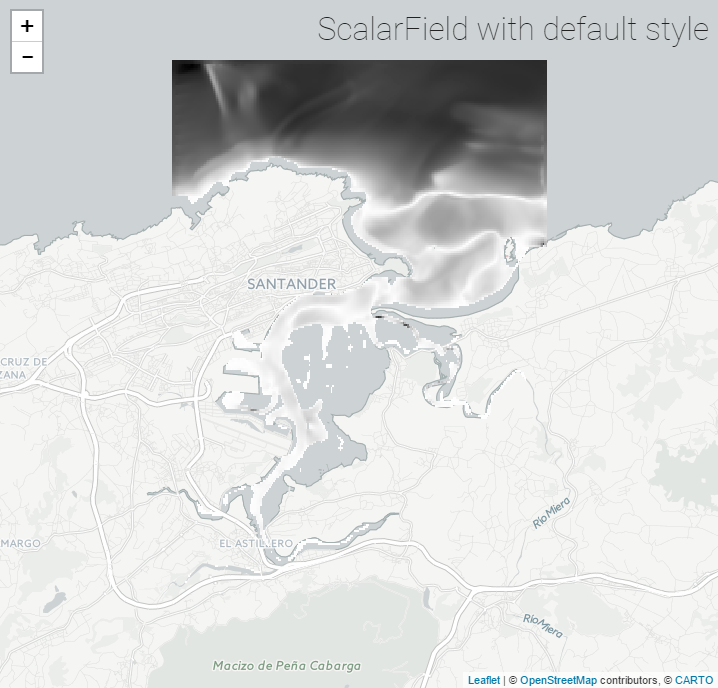
L.CanvasLayer.ScalarField- a "typical" raster layer (from scalars such as DTM, temperature...) that can be rendered with different color scales and arrows. -
L.CanvasLayer.VectorFieldAnim- an animated layer representing a vector field (wind, currents...), based on the excellent earth by Cameron Becarrio
This plugin extends L.CanvasLayer Leaflet Plugin by Stanislav Sumbera and uses geotiff.js by Fabian Schindler. For the 'arrow' renderer, it includes a modified portion of leaflet-geotiff by Stuart Matthews.
Demo
The figures below show the results for three basic layers, showing Currents in the Bay of Santander (Spain)
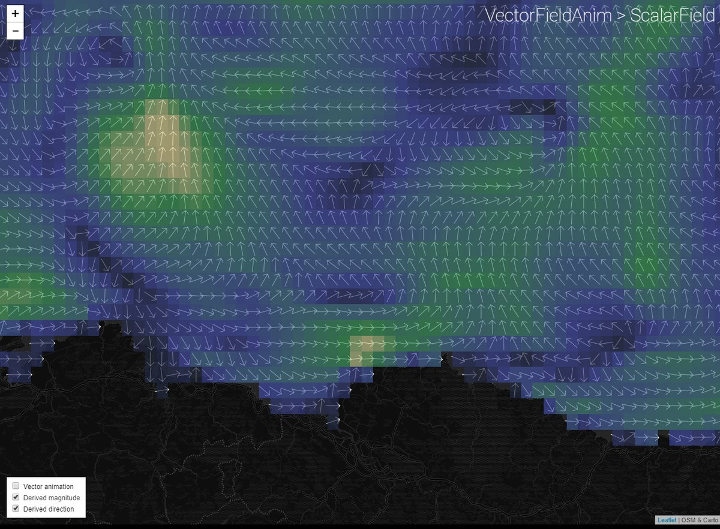
The following animation shows the usage of the built-in Layers Player controller to display an hypothetical precipitation event in the North American Great Lakes region.
If you want to have a quick testing environment, have a look at these snippets at codepen.io:
Instructions
Basic Usage
-
Get the JavaScript file. You can grab a copy from ongoing work at leaflet.canvaslayer.field.js. If you prefer to work locally with npm, then go with
npm install ih-leaflet-canvaslayer-field --save. Every version is automatically published tounpkg CDN(last version at: https://unpkg.com/leaflet-canvaslayer-field/dist/leaflet.canvaslayer.field.js) -
Include the JavaScript dependencies in your page:
    <!-- CDN references -->
    <script src="//npmcdn.com/[email protected]/dist/leaflet.js"></script>

    <script src="//d3js.org/d3.v4.min.js"></script>
    <script src="//npmcdn.com/[email protected]/dist/geotiff.js"></script> <!-- optional -->

    <!-- Plugin -->
    <script src="https://ihcantabria.github.io/Leaflet.CanvasLayer.Field/dist/leaflet.canvaslayer.field.js"></script>
-
Prepare a Raster File with your favourite GIS tool, using EPSG:4326 (ASCII Grid or GeoTIFF format)
-
Create a
ScalarFieldlayer and add it to themap, using your raster files as source (e.g. this .asc)
d3.text("https://ihcantabria.github.io/Leaflet.CanvasLayer.Field/data/Bay_Speed.asc", function (asc) {
    var s = L.ScalarField.fromASCIIGrid(asc);
    var layer = L.canvasLayer.scalarField(s).addTo(map);

    map.fitBounds(layer.getBounds());
});
- Or try the
VectorFieldAnimlayer, adding also a popup (previously you have to prepare 2 raster files, with 'u' and 'v' components in 'm/s'):
d3.text('https://ihcantabria.github.io/Leaflet.CanvasLayer.Field/data/Bay_U.asc', function(u) {
d3.text('https://ihcantabria.github.io/Leaflet.CanvasLayer.Field/data/Bay_V.asc', function(v) {
let vf = L.VectorField.fromASCIIGrids(u, v);
let layer = L.canvasLayer.vectorFieldAnim(vf).addTo(map);
map.fitBounds(layer.getBounds());
layer.on('click', function(e) {
if (e.value !== null) {
let vector = e.value;
let v = vector.magnitude().toFixed(2);
let d = vector.directionTo().toFixed(0);
let html = (`<span>${v} m/s to ${d}°</span>`);
let popup = L.popup()
.setLatLng(e.latlng)
.setContent(html)
.openOn(map);
}
});
});
});
Developers
- This plugin works with Leaflet >=v1.0.0
-
node&npmare needed to build and test the plugin, and it useswebpack 2as module bundler. To use it just:
npm install
npm run start
- Navigate to docs/index.html for some examples.
License
Licensed under the GNU General Public License v3.0
This software currently depends a copy of:
- gLayers.Leaflet - MIT License
At runtime it uses:
- chroma.js - BSD License
- @turf/inside - MIT License
- geotiff.js - MIT License
- d3js - BSD License