ledger-plots - generate plots for your ledger
Make plots for your ledger entries and save them to a pdf file.

Installation
The program consist of an R-package and an executable script written in R.
The current master version can be installed from github:
> devtools::install_github("esovetkin/ledger-plots/ledgerplots")
For that you need to install devtools package.
The ledger-plot executable is located in the exec directory of the
installed package. You can add this directory to your $PATH or add a
symbolic link to ledger-plot in your preferred location.
The path to ledger-plot can be queried with the following bash command:
$ Rscript -e "system.file('exec/ledger-plots', package='ledgerplots')"
Alternatively, you can install the AUR package ledger-plots-git.
Dependencies
It is assumed that you have ledger installed and you know its query syntax.
The script is written in R and this is the only dependency.
Getting help
To see full options list say
ledger-plots --help
Examples and how it works
A query is being passed to ledger for getting a list of transactions to be used in plots.
For example, to make plots for the ledger query "^assets:" call
ledger-plots -q "^assets: -X EUR"
After the execution a single pdf file is generated and can be viewed by an external program.
Ledger supports multiple currency transactions. It is also able to
convert transaction to different currencies using the price derived
from transactions or using a separate price database. The conversion
maybe done using the -X option in the ledger query syntax.
In case multiple transactions are present ledger-plot will generate several plots together for each of the currency, ordered by the currency name.
You can specify extra options which are passed to ledger with the
--ledger-options argument. For instance, this argument is useful to
avoid repetition in multiple queries and/or to specify the location of
the ledger files.
You can specify an output pdf filename with -o (--output)
option. By default, all plots are placed on a landscape page layout
(13x7 inches) with 2x2 plots per page. The plots per page matrix can
be changed via --output-pdf-ncol and --output-pdf-nrow
options. The size of the pdf page can be changed via
--output-pdf-width and --output-pdf-height options.
In case your ledger executable is located in a non-$PATH directory,
then you can specify its location by means --ledger-bin-path
option. The ledger is called by using an R-function system, which
invokes the OS command.
Queries and statistics on transactions
The query is specified using -q (--queries) option. Ledger-plots
passes the specified query string to the ledger. You may also specify
several queries together separating them by two semi-colons (";;;")
ledger-plots -q "^assets: -X EUR ;;; ^liability: -X EUR"
This will make plots for each query one after another.
You may also pass a function to be calculated on the transaction
vector. This can be specified in -f (--functions) option. The
function can be any R function that takes a vector as an arguments and
returns a vector (not necessarily the same length).
For different type of accounts it is reasonable to calculate different functions. For instance, for assets you can calculate accumulated sum for each of the "assets" account
ledger-plots -f "cumsum" -q "^assets: -X EUR"
If you plot expenses it is more reasonable to calculate a moving average over some period of time. For example, you can calculate a monthly average (over 30 days)
ledger-plots -f "monthly" -q "^expenses: -H -X EUR"
More generally, you can specify any R function. For instance, a 7-days average can be specified as
ledger-plots -f "function(x) {
                     filter(x,rep(1,7),sides=1)
                 }" \
             -q "^expenses: -X EUR"
There are several query statistic functions available: weekly,
monthly, quarterly and yearly.
Multiple function can be combined together for multiple queries by separating them by two semi-colons (";;;"). The first function in the list of functions corresponds to the first query, second function corresponds to the second query, etc. For example,
ledger-plots -f "cumsum ;;;
                 monthly ;;;
                 function(x) -cumsum(x)" \
             -q "^assets:;;;^expenses: -H;;;^income:" \
             --ledger-options="-X EUR"
for the query "^assets:" accumulated sum is calculated, for the query "^expenses" a 30-days average and for the query "^income:" the inverted accumulated sum.
One can also calculate and plot in one figure several function statistics. These functions can be specified by separating them with ":::" symbol. For example,
ledger-plots -f "cumsum :::
                 function(x) {
                     i <- 1:length(x);
                     predict(lm(cumsum(x)~i))
                 }" \
             -q "^assets: -X EUR"
plots cumulative sums plus a linear regression of the accumulated
assets. When plotting several query statistic, you might want to use
--plot-legend argument, to create a legend for each plot.
Examples
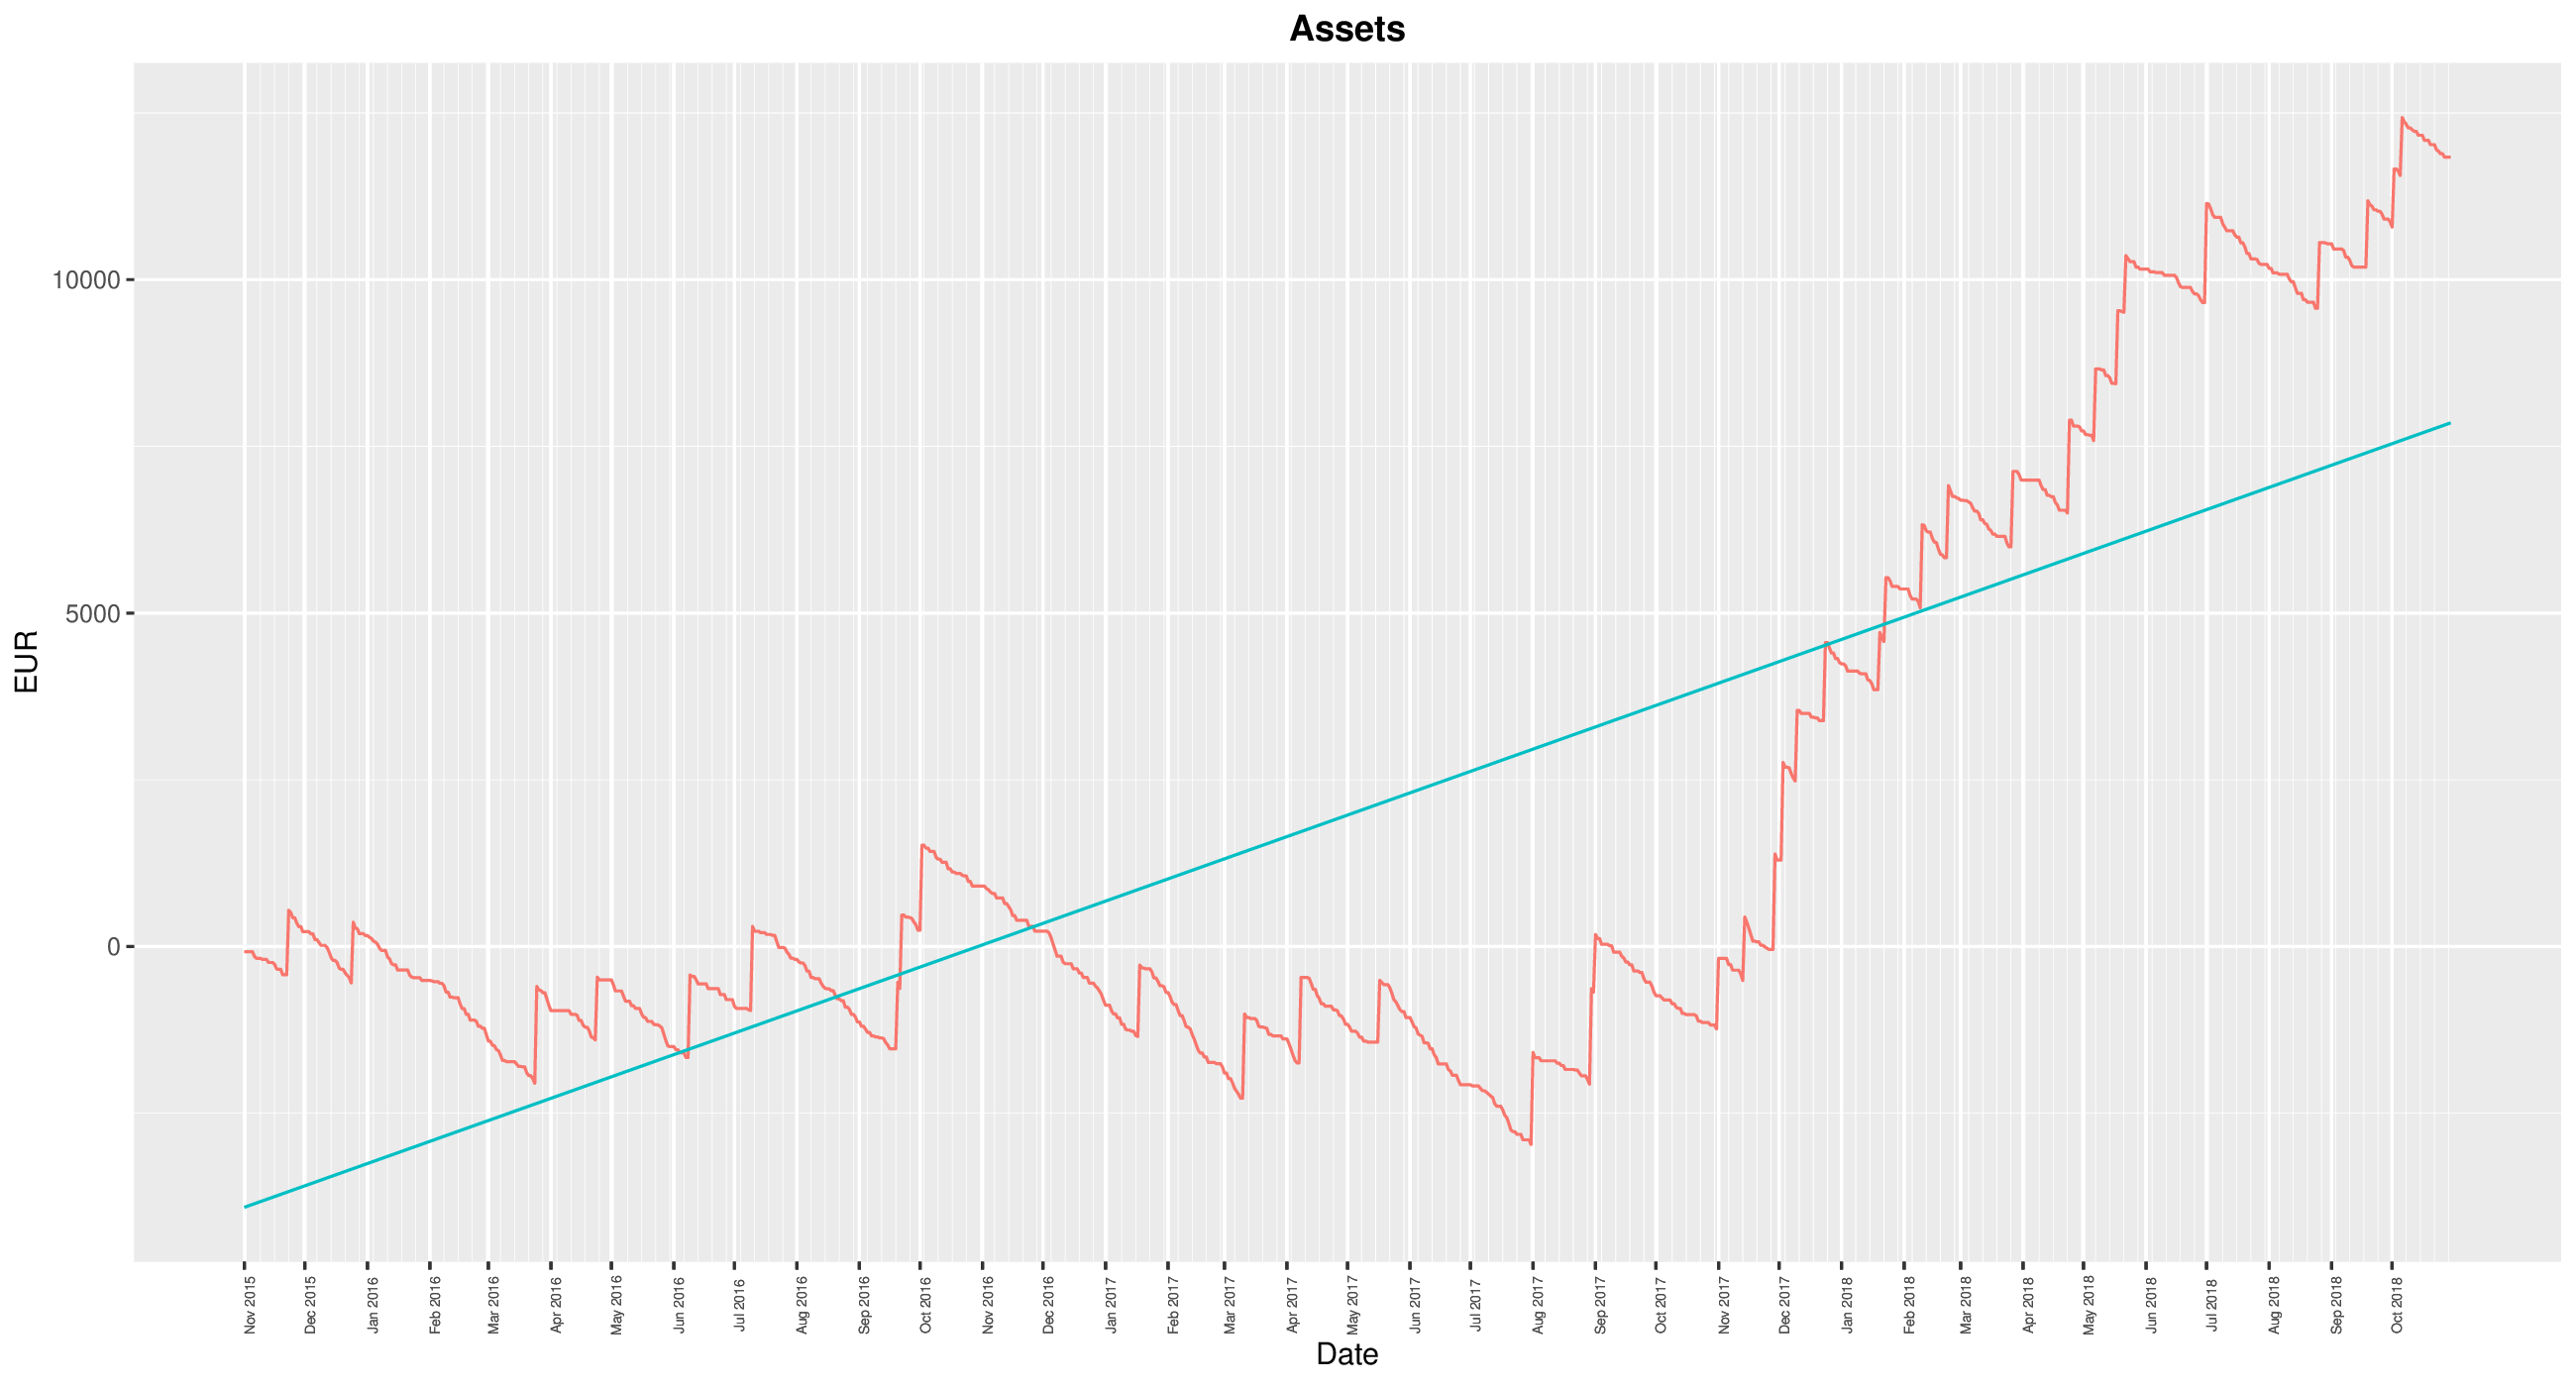
For example consider the following call.
cd examples
../ledger-plots -q "\^assets" \
                -f "cumsum :::
                    function(x) {
                        i<-1:length(x);
                        predict(lm(cumsum(x)~i))
                    }" \
                --ledger-options='-f expenses.ledger' \
                --output-pdf-ncol=1 \
                --output-pdf-nrow=1 \
                -n 1 \
                -o figs/assets.pdf
The red line in the figure shows total amount of assets in EUR for different dates. The blue line shows linear regression fitted to the data.
The following example queries expenses.
cd examples
../ledger-plots -q "\^expenses" \
                -f "monthly :::
                    function(x) yearly(x)/12 :::
                    function(x) {
                        res <- 30*cumsum(x)/(1:length(x));
                        res[1:100]<-NA;
                        res
                    }" \
                --ledger-options='-f expenses.ledger -H -X EUR' \
                -n 4 \
                -o figs/expenses.pdf
The red line shows monthly average for each data, the green line shows yearly average adjusted to a monthly data and the blue line shows accumulated average adjusted to a monthly data.
Plots ordering and description
By default plots of several accounts are ordered by the account depth
and a value of function specified in --order-function.
That is, firstly the accounts with depth 1 are plotted (e.g. "Assets"
has depth 1, and "Assets:Cash" has depth 2). All plots for accounts
with a given depth are ordered according to the value of the
--order-function. By default --order-function=function(x) sum(abs(x)), which means that firstly appear plots with the biggest
sum of the absolute value of the transactions.
With option --no-depth-order plots are ordered only with respect to
the --order-function.
The thick vertical lines on the plots correspond to the first day of the month. The thin vertical lines correspond to the first day of the week (Monday).
Revalued plot
With -t "revalued" one is able to plot the revalued valued of the
query. This allows to see possible gain losses in a hypothetical
situation "if I were buying some currency what would I have
gained/lost"
ledger-plots -t "revalued" \
             -f "cumsum" \
             -q "-X EUR ;;; -X GBP ;;; -X USD ;;; -X XBT" \
             --ledger-options="^assets:"
Note that this feature relies on your ledger price database.
Example
As an example consider the following call.
cd examples
../ledger-plots --queries="-X EUR ;;; -X USD" \
                -f "cumsum :::
                    function(x) {
                        i<-1:length(x);
                        predict(lm(cumsum(x)~i))
                    }" \
                --ledger-options='-f expenses.ledger \^assets' \
                --type "revalued" \
                --output-pdf-ncol=2 \
                --output-pdf-nrow=1 \
                --output-pdf-height="3.5" \
                -o figs/assets-revalued.pdf
In the examples/expenses.ledger two different currencies occur: EUR
and USD. However, one may use arbitrary currencies, provided that the
exchange rates are present in the ledger prices file.
The figure shows gains/losses for a hypothetical situation, when one had stored all assets in a one currency.

Plot of tags
Using option -C "tags" (or equivalently --categorise-by="tags")
one may make plots for different tags and combination of tags. By
default, only plots for account with depth 1 are made (this behaviour
is controlled with option --min-tags-account-depth). Plots are made
only for tags combination with maximal length --max-tags-tuples and
with a minimal number of transactions equal to --min-tags-entries.
For example,
ledger-plots -C "tags" -f "monthly" -q "^expenses: -H -X EUR"
makes a plot for expenses and different combinations of tags being used for those transactions.
Example
The following example
cd examples
../ledger-plots -q "\^expenses" \
                -f "monthly :::
                    function(x) yearly(x)/12 :::
                    function(x) {
                        res <- 30*cumsum(x)/(1:length(x));
                        res[1:100]<-NA;
                        res
                    }" \
                --ledger-options='-f expenses.ledger -H -X EUR' \
                -C "tags" \
                -n 4 \
                -o figs/expenses-tags.pdf
plot expenses with various combinations of tags.

Alluvial plots
Using option -C "alluvial" one may make alluvial plots.
For example,
cd examples
../ledger-plots -q "\^expenses" \
                -C "alluvial" \
                -f "function(x) yearly(x)/12" \
                --output-pdf-ncol=1 \
                --output-pdf-nrow=1 \
                --ledger-options='-f expenses.ledger -H -X EUR' \
                -n 1 \
                -o figs/expenses-alluvial.pdf
generates an alluvial plot for different expenses categories.

Example of forecasts
It is possible to compute and plot forecasts as well (otherwise, why on earth do we need to use R for ledger plots, when there are GNUplot scripts available). For that you need to specify a function that returns a larger vector than the input vector.
The following example plots cumulative value of the assets with forecast for 2 years using linear regression and SSA method. To use the latter you need to install this R-package.
cd examples
../ledger-plots \
    -f "cumsum :::
        function(x) {
            i <- 1:length(x);
            predict(lm(cumsum(x)~i),newdata=data.frame(\"i\"=1:(length(x)+2*365)))
        } :::
        function(x) {
            require(Rssa)
            tryCatch({
                p <- predict(ssa(cumsum(x)),groups=list(1:20),method=\"recurrent\",len=2*365);
                c(rep(NA,length(x)),p)
            }, error = function(e) rep(NA,length(x)))
        } :::
        function(x) {
            require(Rssa)
            tryCatch({
                p <- predict(ssa(cumsum(x)),groups=list(1:10),method=\"recurrent\",len=2*365);
                c(rep(NA,length(x)),p)
            }, error = function(e) rep(NA,length(x)))
        }" \
    --queries="^assets " \
    --ledger-options='-f expenses-realistic.ledger -b 2013-01-01' \
    -n 1 \
    --output-pdf-ncol=1 \
    --output-pdf-nrow=1 \
    -o "figs/assets-forecast.pdf"

Food prices and volumes
ledger-plots is also able to parse a special syntax of transaction comments. For example, this can be used to keep a track on the consumed amounts of food and food prices.
In order to keep track on the food prices/volumes one has to put an extra entry to the transaction notes. For example, like in the following transactions:
2017/01/1 Lidl
    Food:Cookies                                   3 GBP ; 500g
    Food:Milk                                      2 GBP ; 2x @ 1l
    Expenses

2017/01/2 Edeka
    Food:Cookies                                   3 EUR ; 500g
    Food:Milk                                      2 EUR ; 2x @ 1l
    Bath:Toothpaste                                1 EUR ; 75ml
    Bath:Toothbrush                                5 EUR ; 3x
    Expenses

2017/01/3 Sainsbury's
    Food:Cookies                                   3 GBP ; 500g
    Food:Milk                                      2 GBP ; 2x @ 1l
    Expenses
Note that for each transaction multiple entries in different units can be specified. In that case the volume/price is accounted and plotted in different units. For example,
2017/01/1 Lidl
    Food:Ice Cream                                   3 EUR ; 2kg 2.2l
    Expenses
Generally, the volume of the account is given in the following format
<value>[]?<unit>
In order to make ledger-plots to parse the notes and make
corresponding plots use --type argument.
ledger-plots -q "-H -X EUR" -f "monthly.price" \
             --ledger-options='-f examples/food.ledger' \
             --type "price"

ledger-plots -q "-H -X EUR" -f "monthly" \
             --ledger-options='-f examples/food.ledger' \
             --type "volume"
Note that statistic value monthly doesn't make much sense for price
plots, therefore, use monthly.price that calculates a moving average
of 30 days price.
Examples
Here is an example of the consumed food volumes.
cd examples
../ledger-plots -q "\^food" \
                -f "monthly :::
                    function(x) quarterly(x)/3 :::
                    function(x) yearly(x)/12 " \
                --type "volume" \
                --ledger-options="-f food.ledger -H -X EUR" \
                -n 4 \
                -o figs/food-volume.pdf

The price can be generated with a similar call.
cd examples
../ledger-plots -q "\^food" \
                -f "monthly :::
                    function(x) quarterly(x)/3 :::
                    function(x) yearly(x)/12 " \
                --type "price" \
                --ledger-options="-f food.ledger -H -X EUR" \
                -n 4 \
                -o figs/food-price.pdf

One can also do alluvial plots for volume, price or currency data. Here we plot an example an alluvial plot of the consumed volumes.
cd examples
../ledger-plots -q "\^food" \
                -f "function(x) yearly(x)/12" \
                --type "volume" \
                -C "alluvial" \
                --ledger-options="-f food.ledger -H -X EUR" \
                -n 4 \
                -o figs/food-volume-alluvial.pdf

Table with food prices
It is possible to generate a LaTeX table ordered by categories, units
and prices of accounts providing the corresponding payee. The table is
generated by passing --generate-price-table argument. Then only the
first --query is processed and the last returned value of each
--functionsis taken to show in the table.
The columns of the table are ordered firstly by category, then by
units, then by each function value columns with the same order as the
functions are specified in the --functions argument.
The following example generates the table prices
cd examples
../ledger-plots --generate-price-table \
                -q "food: -H -X EUR" \
                -f "min ::: mean ::: tail" \
                --ledger-options='-f food.ledger' \
                --conversion="1kg = 1l ;;; 1kg = 1x ;;; 1kg = 1qb" \
                -o "figs/price-table.tex"
resulting in a table with the following first entries
| category | payee | currency | min | mean | tail |
|---|---|---|---|---|---|
| Food:Dairy | payee6 | EUR/kg | 1.25 | 20.44 | 25.57 |
| Food:Dairy | payee5 | EUR/kg | 1.33 | 23.09 | 16.25 |
| ... | ... | ... | ... | ... | ... |
| Food:Dairy | payee9 | EUR/kg | 3.41 | 17.47 | 9.49 |
| ------------- | -------- | ---------- | ------ | ------- | ------- |
| Food:Fruits | payee2 | EUR/kg | 2.04 | 23.79 | 10.44 |
| ... | ... | ... | ... | ... | ... |