codingadventures / Linqbridgevs
Labels
Projects that are alternatives of or similar to Linqbridgevs
LINQBridgeVs


![]()


LINQBridgeVs is a Visual Studio Extension compatible with Visual Studio from 2012 through 2019.
It is a bridge between a Visual Studio debugging session and LINQPad. It creates, at compile time, a Custom Debugger Visualizer making the magnifying glass available for all of the public classes and structs. By clicking on the magnifying glass on an object instance, this will be transmitted over a bus and 'Dumped' out by LINQPad.
Release Notes
-
2.0
- Adds support for Visual Studio 2019
- Drops support for Visual Studio 2012 to 2015
- Adds async loading to speed up Visual Studio loading times
-
1.4.7
- Visualizer generation for third party assemblies #25. When enabled (it's off by default) LINQBridgeVs will map types in every referenced dlls for every project in a solution.
- LINQBridgeVs will now display an error message for unsupported solutions. #52. .NET Core, .NET Standard and UWP are not supported because of a Visual Studio limitation.
- Added XmlSerialization #50. XmlSerialization has been added to the serialization methods used to transmit variables to LINQPad. This is useful to serialize objects that have xml content (XElement, XmlDocument etc).
- Added support for AnonymousType #46 Are anonymous types supported when used inside a list? and private nested classes.
- Added Json.NET failover serialization #56 Should LINQBridgeVs fail to transmit the object using the chosen serialization method (Binary, Json or Xml) it will try again using Json.NET. If Json.NET is set as the primary method, it will instead use Binary serialization.
- Bug fixing #41 #49 #55 #58
Getting Started
Once the extension is installed, a new menu called "BridgeVs" will be available in the Visual Studio Menu Bar. This menu is only visible when a solution is loaded. There are two options available:
- Bridge Solution
- Un-Bridge Solution
Bridging a solution will extend the MsBuild process to create a custom debugger visualizer assembly for each project. These assemblies are created or updated when you build your projects. Private and internal classes are not included, hence the magnifying glass will not be available for them.
Run the solution, set a breakpoint and hover the mouse pointer on any object instance then the magnifying glass will appear inside the data tip.
Compatibility
LINQBridgeVs is compatible with any Visual Studio edition from 2012 through 2019. The latest version 2.0 is only compatible with Visual Studio 2017 and 2019. It works only for .NET Framework 4.0 onwards. There is no support for .NET Framework 3.5 downwards, .NET Core or .NET Standard. This issue is due to a Visual Studio limitation hence this extension does not support .NET Core. There is a feature request in the Visual Studio Uservoice.
Visual Studio 2017 Preview
LINQBridgeVs 1.4.7 is compatible with the preview version of Visual Studio 2017, but it needs a workaround in order to work. Please refer to my last comment on this issue #47. This issue doesn't affect the latest version 2.0.
Configuration up to Version 1.4.7
This steps is necessary for versions of LINQBridgeVs up to 1.4.7 and thus is no longer needed for LINQBridgeVS 2.0. Visual Studio needs to be configured in order to run the extension. This is done only once by the extension itself.
Only for the first time, Visual Studio must be run with Administrator privileges. If not, a form will appear asking to restart Visual Studio:

Once Visual Studio is restarted as Administrator, the configuration will complete and the form will never appear again.
During this process one custom MsBuild Target, Custom.After.Microsoft.Common.targets is needed to extend the MsBuild process. It is copied into a specific Visual Studio version and edition's folder:
- Visual Studio 2017 - C:\Program Files (x86)\Microsoft Visual Studio\2017\Edition\MSBuild\v15.0
- Visual Studio 2015 - C:\Program Files (x86)\MSBuild\v14.0
- Visual Studio 2013 - C:\Program Files (x86)\MSBuild\v12.0
- Visual Studio 2012 - C:\Program Files (x86)\MSBuild\v4.0
You can skip this process but you will not be able to use the extension until you complete the configuration.
Uninstall
This extension can be uninstalled from Visual Studio. Go to "Tools/Extensions and Updates..." select LINQBridgeVs and then click on Uninstall. There is also a manual step involved: delete Custom.After.Microsoft.Common.targets from the corresponding MSBuild folder as explained in Configuration and delete the registry entry \HKEY_CURRENT_USER\Software\LINQBridgeVs. I will create a ps script at some stage to automate it.
LINQPad
LINQPad must be present in the system before installing the extension otherwise it will not be possible to complete the configuration. Either the portable or the installed version are supported.
Custom folders for LINQPad queries and plugins are supported. This extension reads the configuration files located here:
- %APPDATA%\LINQPad\PluginLocations.txt
- %APPDATA%\LINQPad\QueryLocations.txt
Please remember that if you set a custom folder through LINQPad for either plugins or queries and then you go back to the default folder you need to manually delete either the two files above or their content.
Error Tracking
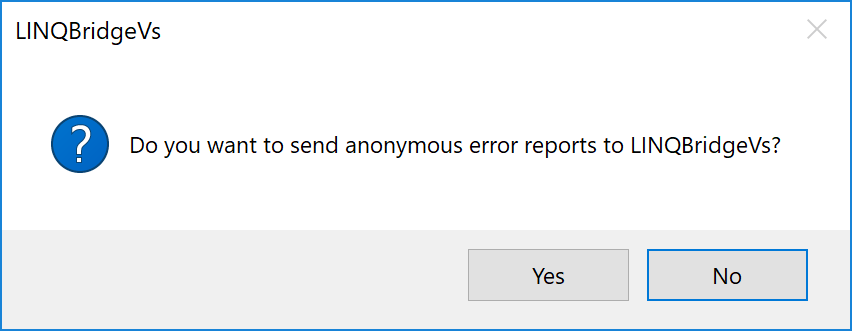
This extension uses Sentry error tracking to log exceptions. After the Configuration is finished a message box will appear asking if you want to enable this functionality. Should you click yes, you will help me keep this project bug free.
This feature can be turned on or off at any time through the option menu: Tools->Options->BridgeVs->ErrorTracking. See the BridgeVs Option Menu section for more details.
Data Protection
Sentry is compliant with the GDPR as a data processor, please refer to this article GDPR, Sentry and you.
In no way is personal data (such as email addresses, credit card information, name of the machine, username or IP address) sent to Sentry. A data scrubber is enabled by default to remove any values that look like they contain credit cards (using regular expression). Keys that contain any of the following values: password, secret, passwd, authorization, api_key, apikey, access_token are filtered as well. RavenWrapper is the wrapper class used to send exceptions to Sentry. Please refer to lines 54-61 to see how some data is filtered out before the request is sent.
Data sent through the extension will live for a maximum of 90 days, after which it will be deleted. If you're concerned that personal data has been accidentally sent, please drop an email to linqbridgevs [at] gmail [dot] com and I will delete the data as soon as possible.
BridgeVs Option Menu
The BridgeVs Option menu offers four options:

The error tracking feature, as explained in the Error Tracking section, can be switched on or off at any time. To enable diagnostic logging set Enable Logging to true. Logs will be saved in %TEMP%\BridgeVs\logs.txt. Be careful, logging is synchronous so it will slow down the transmission process.
The LINQPad installation path can also be changed should you prefer to use a portable version after the configuration is completed. Bear in mind that the folder provided must contain the LINQPad.exe, otherwise it won't change the path. The Serialization Type is the method used to transmit debugging variables to LINQPad. Binary serialization is set by default. Json.NET is also available.
Troubleshooting
If after bridging and rebuilding your solution the magnifying glass still does not appear, make sure that in this folder "C:\Users\youruser\Documents\Visual Studio 201x\Visualizers" there is/are assemblies with this name template "AssemblyName.Visualizer.V1x.dll" (where x is the version number of Visual Studio). If the folder does not contain any assembly then please open a new bug. There are a number of dependent assemblies required by the custom visualizer (BridgeVs.DynamicCore.dll, BridgeVs.Grapple.dll, BridgeVs.Shared.dll, Newtonsoft.Json.dll, System.IO.Abstractions.dll, SharpRaven.dll) which are copied in these two folders during the Configuration:
- C:\Users\youruser\Documents\Visual Studio 201x\Visualizers
- C:\Users\youruser\Documents\LINQPad Plugins
Please do not delete these files. If they are accidentally deleted, the extension must be re-installed.
Do not keep two instances of two different versions of LINQPad running (e.g. LINQPad 4 and LINQPad 5) at the same time. If you do so, the data will automatically be sent to the lower version of LINQPad.
How it works
LINQBridgeVs uses a technique called Aspect Oriented Programming. AOP is a programming paradigm that aims to increase modularity, by allowing separations of cross-cutting concerns (read behaviors) without modifying the code itself. Usually this is achieved by adding an extra step into the build process after the assembly is created. Specifically, in Visual Studio the Build Engine is called MsBuild and it is to be extended to use AOP. This can be done by either copying a custom Target file to a specific MsBuild folder or by adding Target tags in a project file like the following:
<!-- To modify your build process, add your task inside one of the targets below and uncomment it.
       Other similar extension points exist, see Microsoft.Common.targets. -->
 <Target Name="BeforeBuild">
  </Target>
  <Target Name="AfterBuild">
  </Target>
This extension uses custom build Targets in order to avoid the modification of each individual project.
When a solution is Bridged, every project in the solution is essentially flagged. Configuration values are stored in the Windows Registry at this location \HKEY_CURRENT_USER\Software\LINQBridgeVs

For each flagged project there are custom tasks that run before and after a project is built:
- Mapper Task - This task creates a Custom Debugger Visualizer assembly for each project.
- SInjection Task - SInjection stands for "Serializable Injection". This task reads the built assembly and marks every public class and struct as Serializable. It also ensures that any type is serializable using the BinaryFormatter.
- Clean Task - This task deletes the Custom Debugger Visualizer assemblies generated by the Mapper task.
Architecture of a Debugger Visualizer
From the MSDN documentation:
Visualizers are components of the Visual Studio debugger user interface. A visualizer creates a dialog box or another interface to display a variable or object in a manner that is appropriate to its data type. For example, an HTML visualizer interprets an HTML string and displays the result as it would appear in a browser window; a bitmap visualizer interprets a bitmap structure and displays the graphic it represents. The Visual Studio debugger includes six standard visualizers.
The process of creating custom visualizers to extend the debugger is not too complicated. However, it requires a lot of setup either for mapping a class to custom visualizer but, also to prepare the class for serialization.
The architecture of a debugger visualizer has two parts:
- The debugger side runs within the Visual Studio debugger.
- The debugger-side code creates and displays the user interface for your visualizer.
The debuggee side runs within the process Visual Studio is debugging (the debuggee). The debuggee side has to send that data object to the debugger side, which can then display it using a user interface you create. In order to send that data, the object needs to be serialized. Unless you use a serializer, like JSON.NET, that requires no markup on neither the class itself nor on the properties, the class must be marked as Serialized, or with other specific attributes depending on the serializer.
Below is an example of what is needed to map a class to a custom debugger visualizer:
using DebuggerVisualizerExample;
using Microsoft.VisualStudio.DebuggerVisualizers;
using Microsoft.Windows.Form;

[assembly: System.Diagnostics.DebuggerVisualizer(
    typeof(DebuggerSide),
    typeof(VisualizerObjectSource),
    Target = typeof(Class1),
    Description = "My First Visualizer")]
[assembly: System.Diagnostics.DebuggerVisualizer(
    typeof(DebuggerSide),
    typeof(VisualizerObjectSource),
    Target = typeof(Class2),
    Description = "My First Visualizer")]
[assembly: System.Diagnostics.DebuggerVisualizer(
    typeof(DebuggerSide),
    typeof(VisualizerObjectSource),
    Target = typeof(Class3),
    Description = "My First Visualizer")]
namespace DebuggerVisualizerExample
{
    [Serializable]
    public class Class1 { }

    [Serializable]
    public class Class2 { }

    [Serializable]
    public class Class3 { }

    public class DebuggerSide : DialogDebuggerVisualizer
    {
        protected override void Show(IDialogVisualizerService windowService, IVisualizerObjectProvider objectProvider)
        {
            MessageBox.Show(objectProvider.GetObject()); //obviously MessageBox can't show any object we pass to it
        }
    }
}
For each class (Class1, Class2, Class3) a global assembly attribute that maps the type to a debugger visualizer is needed. This extension does all of this automatically. Internally it uses the .NET BinaryFormatter to send the data from the debuggee to the debugger. If the BinaryFormatter fails to serialize the data, JSON.NET is used instead.
Special Thanks to my Sponsors
A very special thanks goes to Sentry, Advanced Installer, NDepend, TypeMock and Jetbrains for sponsoring this project.
![]()


![]()

Support
Your opinion is important, if you have some spare time please leave a review on the Visual Studio Marketplace.
Acknowledgments
I have also used several community open source projects to make this extension. So if you like LINQBridgeVs I recommend checking out the following:
- LINQPad super useful scratch pad for C#, VB, F# and SQL. Without it this extension would not exist.
- SharpRaven C# client for Sentry.
- Mono.Cecil very famous and useful AOP library designed, written and maintained by JB Evain to generate and inspect programs and libraries in the ECMA CIL format.
- JSON.NET is an awesome serializer. It has become part of the .NET Framework and it is used by millions worlwide, now it has become the standard. LINQBridgeVs mainly uses the BinaryFormatter, but should it fail, it uses JSON.NET as a fallback mechanism.
- VsRestart is an extension that restart Visual Studio under Administrator privileges. Unfortunately the project seems abandoned. The extension works only with Visual Studio 2013. However it seems the code works just fine with any Visual Studio version.
- MahApps which was the first open source project to make WPF truly modern.