All Projects → drewnoakes → Il Visualizer

drewnoakes / Il Visualizer

.NET debugging visualiser for runtime-generated IL code (via DynamicMethod, etc) for VS2017 and VS2015

Projects that are alternatives of or similar to Il Visualizer

Linqbridgevs
Dumps the content of variables during debugging in Visual Studio to LINQPad
Stars: ✭ 114 (+103.57%)
Mutual labels:  visual-studio, debugger
Angrdbg
Abstract library to generate angr states from a debugger state
Stars: ✭ 49 (-12.5%)
Mutual labels:  debugger
Cn Vscode Docs
VScode说明文档翻译
Stars: ✭ 970 (+1632.14%)
Mutual labels:  visual-studio
Intrinsics Dude
Opensource Visual Studio extension for compiler instrinsics in C/C++
Stars: ✭ 44 (-21.43%)
Mutual labels:  visual-studio
Annwvyn
Annwvyn C++ Open Source designed-for-VR game engine and application developement framework
Stars: ✭ 34 (-39.29%)
Mutual labels:  visual-studio
Workstations
Vagrant virtual workstations and development environments with Visual Studio, Docker, IIS and SQL Server on Windows for .NET development
Stars: ✭ 45 (-19.64%)
Mutual labels:  visual-studio
Mu
A small, simple editor for beginner Python programmers. Written in Python and Qt5.
Stars: ✭ 960 (+1614.29%)
Mutual labels:  debugger
Ui For Uwp
This repo contains the source code for Telerik UI for Universal Windows Platform (UWP), which includes 20+ UI controls for developers building UWP applications.
Stars: ✭ 1,077 (+1823.21%)
Mutual labels:  visual-studio
Gitlab.visualstudio
GitLab Extension for Visual Studio
Stars: ✭ 48 (-14.29%)
Mutual labels:  visual-studio
Stdex
std C++ 11 library impementation with extra features using only C++ 98 and POSIX threads
Stars: ✭ 43 (-23.21%)
Mutual labels:  visual-studio
Vim Padre
Debugger plugin for VIM
Stars: ✭ 42 (-25%)
Mutual labels:  debugger
Hashlink Debugger
Visual Studio Code Debugger for Haxe/HashLink applications
Stars: ✭ 35 (-37.5%)
Mutual labels:  debugger
Pytest Pudb
Pytest PuDB debugger integration
Stars: ✭ 45 (-19.64%)
Mutual labels:  debugger
Ansible Role Php Xdebug
Ansible Role - PHP Xdebug
Stars: ✭ 34 (-39.29%)
Mutual labels:  debugger
Gdbgui
Browser-based frontend to gdb (gnu debugger). Add breakpoints, view the stack, visualize data structures, and more in C, C++, Go, Rust, and Fortran. Run gdbgui from the terminal and a new tab will open in your browser.
Stars: ✭ 8,339 (+14791.07%)
Mutual labels:  debugger
Vsmacdeepclean
Visual Studio for macOS add-in / extension that brings you tasty features.
Stars: ✭ 33 (-41.07%)
Mutual labels:  visual-studio
Sdk
Core functionality needed to create .NET Core projects, that is shared between Visual Studio and CLI
Stars: ✭ 996 (+1678.57%)
Mutual labels:  visual-studio
Javafx Webview Debugger
Full Featured Google Chrome Dev Tools to JavaFX WebView browser debugging.
Stars: ✭ 45 (-19.64%)
Mutual labels:  debugger
Ios Sdk
AppSpector is a debugging service for mobile apps
Stars: ✭ 56 (+0%)
Mutual labels:  debugger
Indium
A JavaScript development environment for Emacs
Stars: ✭ 1,058 (+1789.29%)
Mutual labels:  debugger

IL Visualiser

Originally developed by Haibo Luo in 2005 and posted in a series of blog posts (part one, part two).

Converted to a Git repository and upgraded to VS2015 by Drew Noakes. Conversion to VS2017 by @dadhi.

Usage

When paused in the debugger, select an instance of a subclass of MethodBase (such as DynamicMethod, MethodBuilder, ConstructorBuilder, ...) and launch a visualiser:

There are two ways to use this visualiser.

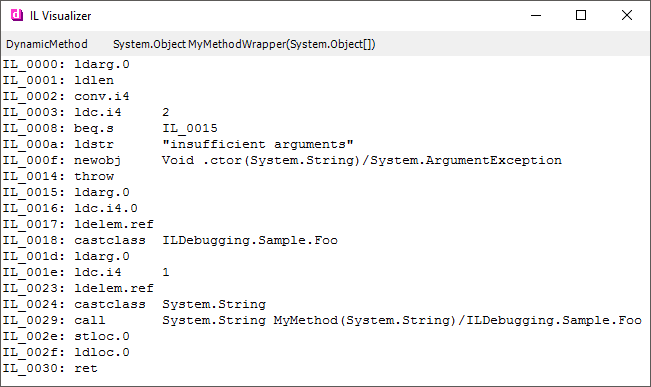
IL Visualizer (Modal)

Selecting "IL Visualizer" pops up a window showing the IL code.

This window is modal and debugging may only continue once the window is closed.

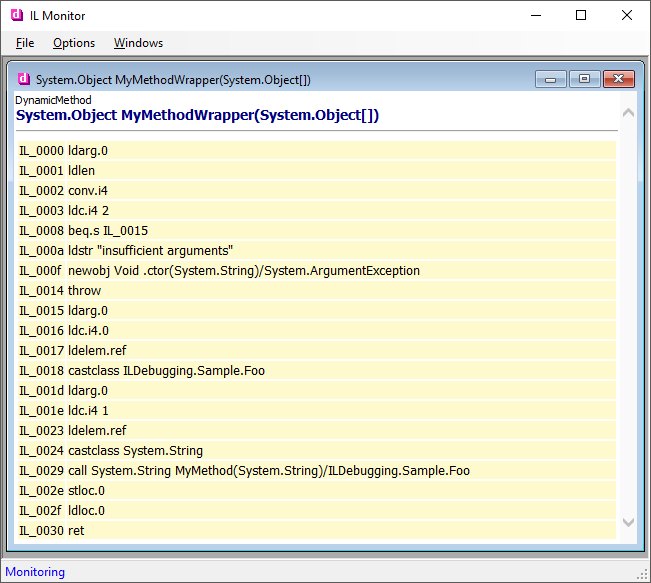
Out of Process (Non-modal)

Sometimes you don't want to close the window before continuing your debugging session. For such cases, you can run IL Monitor as a separate process, then select "Send to IL Monitor":

IL Monitor is a standalone MDI application that allows displaying mutliple IL views.

Installation

(Notes apply to VS 2015 and 2017, but are similar for earlier versions)

  1. Download the latest release for your version of Visual Studio, or build from source

  2. Copy ILDebugging.Decoder.dll and ILDebugging.Visualizer.dll to one of:

  • %USERPROFILE%\Documents\Visual Studio 2015\Visualizers
  • %USERPROFILE%\Documents\Visual Studio 2017\Visualizers
  • VisualStudioInstallPath_\Common7\Packages\Debugger\Visualizers
  1. Restart the debugging session (you don't have to restart Visual Studio)

Note: If you get error "Operation not supported" when invoking the visualizer, restart Visual Studio and try again.

If you wish to use Send to IL Monitor, you run ILDebugging.Monitor.exe before attempting to use it from the debugger.

Earlier Visual Studio Versions

You can target earlier versions of Visual Studio by updating the assembly references for Microsoft.VisualStudio.DebuggerVisualizers.dll to the relevant version.

License

THE CODE IS PROVIDED "AS IS", WITH NO WARRANTIES INTENDED OR IMPLIED. USE AT YOUR OWN RISK!

Note that the project description data, including the texts, logos, images, and/or trademarks, for each open source project belongs to its rightful owner. If you wish to add or remove any projects, please contact us at [email protected].