LMGraphView
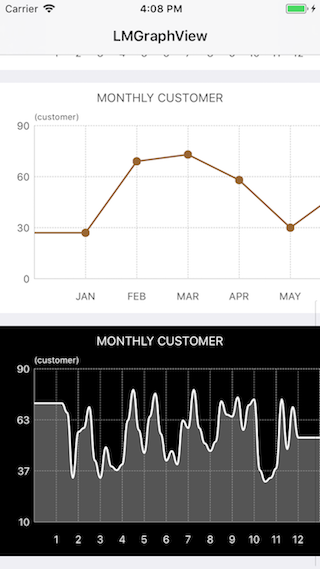
LMGraphView is a simple and customizable graph view for iOS.

Features
- Display a scrollable line graph view with mutiple graph plots.
- Show popover when touch on every graph points.
- Allow for a large amount of customization.
Requirements
- iOS 8.0 or higher
- ARC
Installation
From CocoaPods
pod 'LMGraphView'Manually
- Drag the
LMGraphViewfolder into your project. - Add
#import "LMLineGraphView.h"to the top of classes that will use it.
Usage
You can easily integrate the LMGraphView with a few lines of code. For an example usage look at the code below.
LMLineGraphView *graphView = [[LMLineGraphView alloc] initWithFrame:frame];
graphView.xAxisValues = @[@{ @1 : @"JAN" },
                          @{ @2 : @"FEB" },
                          @{ @3 : @"MAR" },
                          @{ @4 : @"APR" },
                          @{ @5 : @"MAY" },
                          @{ @6 : @"JUN" },
                          @{ @7 : @"JUL" },
                          @{ @8 : @"AUG" },
                          @{ @9 : @"SEP" },
                          @{ @10 : @"OCT" },
                          @{ @11 : @"NOV" },
                          @{ @12 : @"DEC" }];
graphView.yAxisMaxValue = 90;
graphView.yAxisUnit = @"(customer)";
graphView.title = @"MONTHLY CUSTOMER";
[self.view addSubview:graphView];

LMGraphPlot *plot = [[LMGraphPlot alloc] init];
plot.strokeColor = [UIColor brownColor];
plot.fillColor = [UIColor clearColor];
plot.graphPointColor = [UIColor brownColor];
plot.graphPoints = @[LMGraphPointMake(CGPointMake(1, 47), @"1", @"47"),
                     LMGraphPointMake(CGPointMake(2, 69), @"2", @"69"),
                     LMGraphPointMake(CGPointMake(3, 77), @"3", @"77"),
                     LMGraphPointMake(CGPointMake(4, 60), @"4", @"60"),
                     LMGraphPointMake(CGPointMake(5, 59), @"5", @"59"),
                     LMGraphPointMake(CGPointMake(6, 40), @"6", @"40"),
                     LMGraphPointMake(CGPointMake(7, 60), @"7", @"60"),
                     LMGraphPointMake(CGPointMake(8, 45), @"8", @"45"),
                     LMGraphPointMake(CGPointMake(9, 50), @"9", @"50"),
                     LMGraphPointMake(CGPointMake(10, 70), @"10", @"70"),
                     LMGraphPointMake(CGPointMake(11, 56), @"11", @"56"),
                     LMGraphPointMake(CGPointMake(12, 30), @"12", @"30")];
graphView.graphPlots = @[plot];
Customization
You can customize the following properties of LMGraphView in LMGraphLayout:
@property (nonatomic, assign) BOOL startPlotFromZero;
@property (nonatomic, assign) BOOL drawMovement;

@property (nonatomic, assign) BOOL xAxisScrollableOnly;
@property (nonatomic, assign) BOOL xAxisGridHidden;
@property (nonatomic, assign) BOOL xAxisGridDashLine;
@property (nonatomic, assign) CGFloat xAxisIntervalInPx;
@property (nonatomic, assign) CGFloat xAxisMargin;

@property (nonatomic, assign) BOOL xAxisZeroHidden;
@property (nonatomic, assign) BOOL xAxisZeroDashLine;
@property (nonatomic, assign) CGFloat xAxisLinesWidth;
@property (nonatomic, strong) UIColor *xAxisLinesStrokeColor;
@property (nonatomic, assign) CGFloat xAxisLabelHeight;
@property (nonatomic, strong) UIFont *xAxisLabelFont;
@property (nonatomic, strong) UIColor *xAxisLabelColor;

@property (nonatomic, assign) NSUInteger yAxisSegmentCount;
@property (nonatomic, assign) BOOL yAxisZeroHidden;
@property (nonatomic, assign) BOOL yAxisZeroDashLine;
@property (nonatomic, assign) BOOL yAxisGridHidden;
@property (nonatomic, assign) BOOL yAxisGridDashLine;
@property (nonatomic, strong) UIColor *yAxisLinesStrokeColor;
@property (nonatomic, assign) CGFloat yAxisLinesWidth;
@property (nonatomic, assign) CGFloat yAxisLabelWidth;
@property (nonatomic, assign) CGFloat yAxisLabelHeight;
@property (nonatomic, strong) UIFont *yAxisLabelFont;
@property (nonatomic, strong) UIColor *yAxisLabelColor;

@property (nonatomic, strong) UIFont *yAxisUnitLabelFont;
@property (nonatomic, strong) UIColor *yAxisUnitLabelColor;

@property (nonatomic, assign) CGFloat titleLabelHeight;
@property (nonatomic, strong) UIFont *titleLabelFont;
@property (nonatomic, strong) UIColor *titleLabelColor;

@property (nonatomic, assign) CGFloat movementLineWidth;
@property (nonatomic, strong) UIColor *movementLineColor;
@property (nonatomic, strong) UIColor *movementDotColor;
(See sample Xcode project in /LMGraphViewDemo)
License
LMGraphView is licensed under the terms of the MIT License.
Contact
Minh Luong Nguyen
