JackBister / Logsuck
Programming Languages
Labels
Projects that are alternatives of or similar to Logsuck
Logsuck


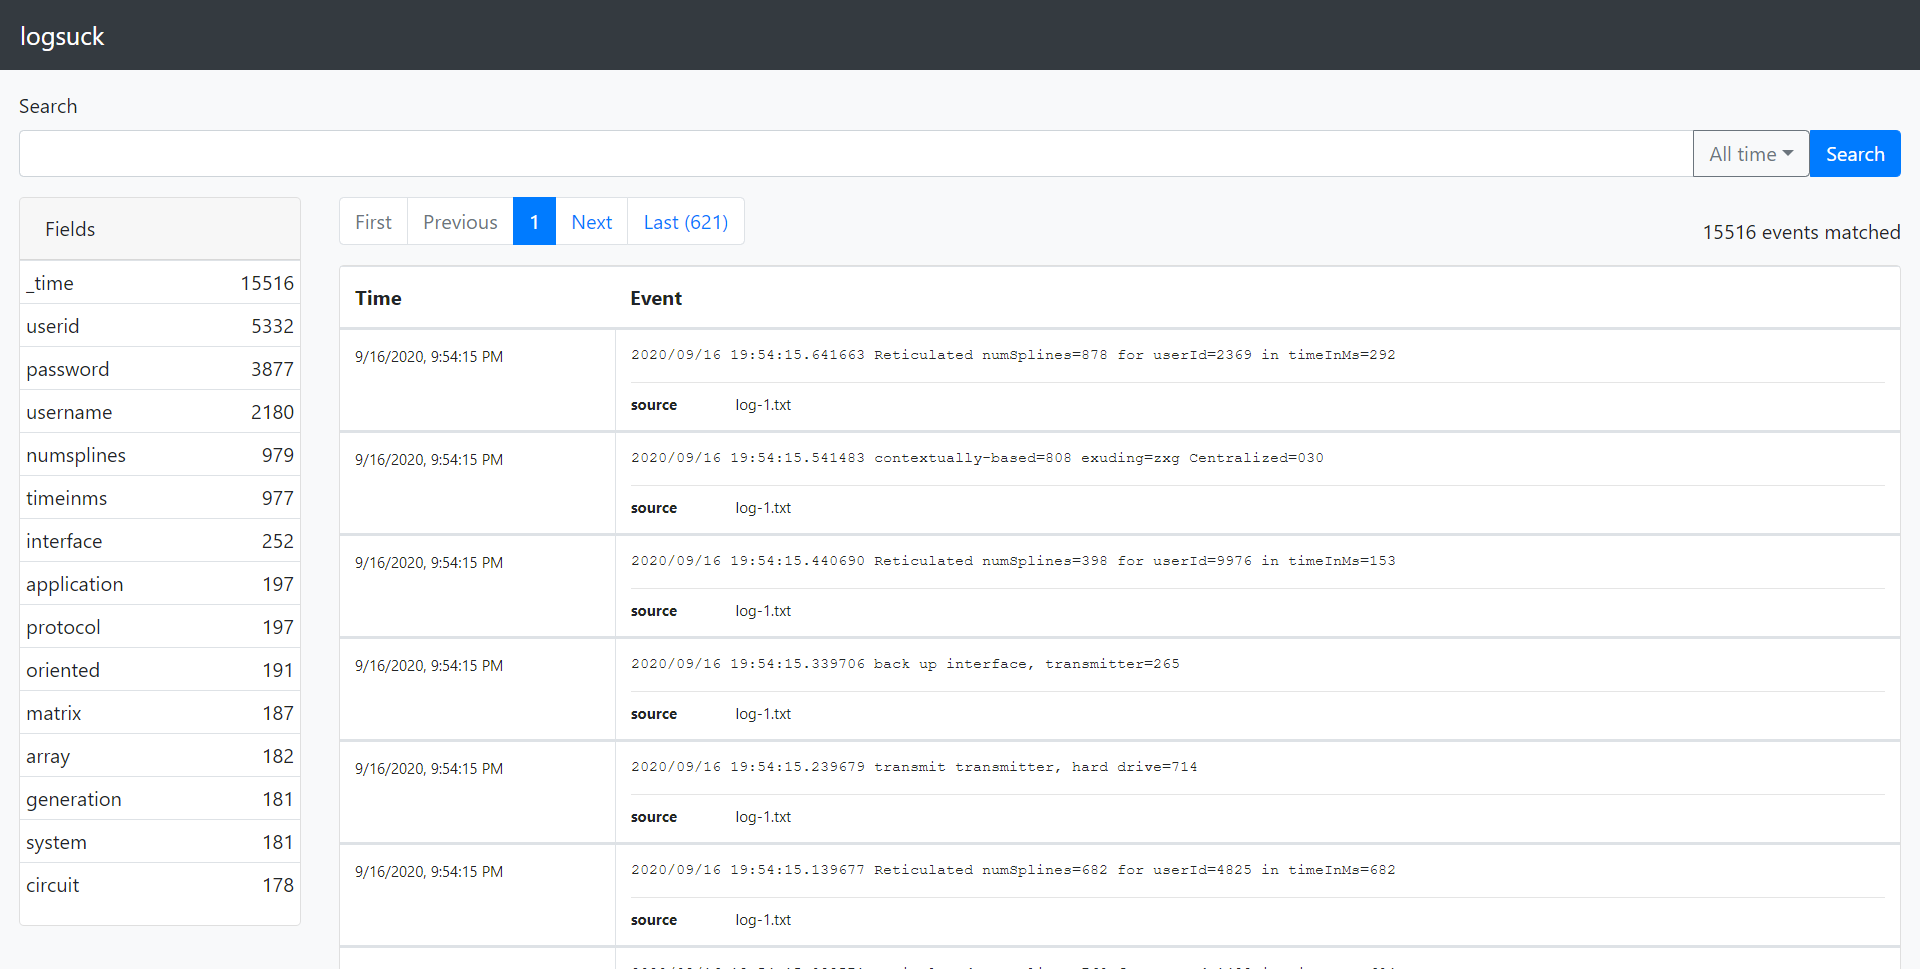
Logsuck is a program that makes it easier for you to deal with your logs. It serves a similar purpose to Splunk or the ELK stack. You can use it to search your logs, correlate logs from different log files with each other and set up alerts and dashboards based on your logs. On top of that, Logsuck is extremely simple to deploy, and is free.
Logsuck does not currently aim to be able to ingest millions of events per second or to have every enterprise feature you can imagine. The target audience for Logsuck is smaller development teams or solo developers who need a powerful tool that is simple to set up and keep running.
Logsuck is currently pre-1.0. This means that there may be changes made to the database schemas used internally by Logsuck which could cause incompatibilities between versions. If that occurs, you will need to delete your logsuck.db file before you can use the new version, which will result in your existing search index being deleted. You can work around this by running the new version in parallel with the old version for a while, until you feel like the data that is only in the old database is old enough to be irrelevant. After 1.0, if a schema change is made, a migration will be provided to handle the upgrade gracefully to the extent that it is possible.
Getting started
Getting started with Logsuck is easy. Logsuck can be ran in two different modes: Single mode or forwarder/recipient mode.
Single mode means you run Logsuck on a server which will both handle reading your log files and serving the Logsuck GUI. This is useful if you are running all of your applications on a single server, or you can even use it to run Logsuck locally to read logs while developing.
Forwarder/recipient mode means you have one recipient instance which will receive events over the network from several forwarder instances. The recipient will also serve the Logsuck GUI. This is useful if you have your applications spread out across multiple servers but want to be able to search them all in one central place.
Note that the different modes of Logsuck do not require different builds of Logsuck. All Logsuck executables are capable of running in single mode, or running as forwarders or recipients.
The guides below assume that you are using a Linux distribution, but Logsuck executables are available for Windows as well.
Single mode
To run Logsuck in single mode, start off by downloading the Logsuck executable to the server:
wget https://github.com/JackBister/logsuck/releases/download/v0.4.0/logsuck-v0_4_0-x64-linux.zip
unzip logsuck-v0_4_0-x64-linux.zip
Then, create a configuration file. In this case we will mostly use default settings to read Logsuck's own logs:
echo '{ "files": [ { "fileName": "logsuck.txt" } ] }' > logsuck.json
Finally, start Logsuck:
./logsuck 2> logsuck.txt
Logsuck is now running. Navigate to http://localhost:8080 and you should see the GUI. Try pressing the search button while leaving the search field empty and you should find some events. Congratulations, you are now running Logsuck in single mode! Continue reading to learn more about configuring Logsuck.
Forwarder/Recipient mode
Setting up Logsuck in forwarder/recipient mode is slightly more complicated. Lets again start off by downloading the Logsuck executable:
wget https://github.com/JackBister/logsuck/releases/download/v0.4.0/logsuck-v0_4_0-x64-linux.zip
unzip logsuck-v0_4_0-x64-linux.zip
This time, we will create two different directories which will be the working directories for each of the two Logsuck instances we need to run.
mkdir forwarder
mkdir recipient
Now, create the configuration for the recipient instance. This configuration will set Logsuck up to listen for events from Logsuck forwarders on port 9000.
echo '{ "recipient": { "enabled": true, "address": ":9000" } }' > ./recipient/logsuck.json
And create the configuration for the forwarder instance. This will configure the forwarder to read its own log and send its events to port 9000 on localhost, which is where the recipient will be running.
echo '{ "files": [ { "fileName": "logsuck-forwarder.txt" } ], "forwarder": { "enabled": true, "recipientAddress": "http://localhost:9000" } }' > ./forwarder/logsuck.json
Start the recipient:
cd recipient && ../logsuck 2> logsuck-recipient.txt
Open a new shell and start the forwarder:
cd forwarder && ../logsuck 2> logsuck-forwarder.txt
You should now be able to navigate to http://localhost:8080 in the browser and see the GUI served by the recipient instance. If you leave the search field empty and press the search button, you should see events show up. If you look at the "source" field underneath the events, you should see that it is always "logsuck-forwarder.txt", confirming that they were sent by the forwarder. You are now running Logsuck in forwarder/recipient mode! Continue reading to learn more about configuring Logsuck.
Configuration
Command line options
There are a few configuration options available on the command line when running Logsuck. It is recommended that you use JSON configuration for production usage of Logsuck, but these options may be useful when running Logsuck locally on a single file.
-config <filename>
The name of the file containing the configuration for Logsuck. If a config file exists, all other command line configuration will be ignored. (default "logsuck.json")
-dbfile <filename>
The name of the file in which Logsuck will store its data. If the name ':memory:' is used, no file will be created and everything will be stored in memory. If the file does not exist, a new file will be created. (default "logsuck.db")
-delimiter <regex>
The delimiter between events in the log. Usually \n. (default "\n")
-fieldextractor <regex>
A regular expression which will be used to extract field values from events. Can be given in two variants:
- An expression containing any number of named capture groups. The names of the capture groups will be used as the field names and the captured strings will be used as the values.
- An expression with two unnamed capture groups. The first capture group will be used as the field name and the second group as the value.
If a field with the name '_time' is extracted and matches the given timelayout, it will be used as the timestamp of the event. Otherwise the time the event was read will be used.
Multiple extractors can be specified by using the fieldextractor flag multiple times. (defaults "(\w+)=(\w+)" and "(?P<_time>\d\d\d\d/\d\d/\d\d \d\d:\d\d:\d\d.\d\d\d\d\d\d)")
-help
Print information about command line options and quit.
-timelayout <string>
The layout of the timestamp which will be extracted in the _time field. For more information on how to write a timelayout and examples, see https://golang.org/pkg/time/#Parse and https://golang.org/pkg/time/#pkg-constants. (default "2006/01/02 15:04:05")
-version
Print version info and quit.
-webaddr <string>
The address on which the search GUI will be exposed. (default ":8080")
JSON configuration
JSON is the recommended way of configuring Logsuck for more complex usage. By default, Logsuck will look in its working directory for a logsuck.json file which will contain the configuration. If the file is found, all command line options will be ignored. There is a JSON schema which documents the configuration file available here.
Search syntax
Search queries in Logsuck generally look like this:
[search] [| <command type> <option>=<value> "value"]...
[search]
This part of the query may contain any combination of the following:
<fragment>NOT <fragment><field>=<fragment><field>!=<fragment><field> IN (<fragment1>, <fragment2>...)<field> NOT IN (<fragment1>, <fragment2>...)
Fragments
A fragment is the Logsuck term for an unquoted or quoted string which should be searched for among the log events. For example, if you search for "hello world" only events containing the string "hello world" (case insensitive) will be matched.
If you specify multiple fragments without any surrounding quotes, they will be matched independently of their order in the event. For example, hello world will match both events containing "hello world" and strings containing "world hello".
You can use * as a wildcard character in fragments. For example, searching for ab* will match the strings "abc", "abcd", etc.
By prepending a fragment with NOT, you can filter out all events containing that fragment.
Fields
A field is a piece of data that is extracted from an event and associated with a key.
There are a few fields that are extracted from all events: _time, source, and host. You can also extract other fields using the fieldExtractors property in the configuration.
There are two ways you can use fields in your searches: You can either filter against one value using <field>=<fragment> or <field>!=<fragment>, or you can filter against multiple values using <field> IN (<fragment1>, <fragment2>...) or <field> NOT IN (<fragment1>, <fragment2>...).
For example, you might use source=*access* to get all events from log files that contain "access" in the file name, or source IN (*access*, *error*) to get all events from log files containing "access" or "error" in their file names.
Commands
Commands are processing steps which are applied to the results of the search up to that point.
The following commands are available:
| rex [field=<field>] "<regex>"
The rex command is used to extract new fields from existing fields using a regular expression.
The regular expression is treated the same as a field extractor in the configuration, meaning that it should either specify a single named capture group or two unnamed capture groups.
If the regular expression matches and contains a named capture group, a new field with the same name as the capture group will be created with the value of the match inside the capture group.
If the regular expression matches and contains two unnamed capture groups, the value of the first capture group will be used as the field name and the value of the second capture group will be used as the field value.
The field option allows you to specify which field the regular expression should be ran against. By default it is ran against the raw event string.
| search startTime="<time>" endTime="<time>" "<search>"
The search command starts a new search. It ignores all previous results and instead sends its own results forward.
| where <field1>=<value1> <field2>=<value2>...
The where command filters events by field value. The benefit of having this as a separate command instead of using the field=value syntax in the search command is that | where can act on fields that are extracted later in the pipeline, such as fields extracted by | rex.
For example you might use a search like userId | rex "userId (?P<userId>\d+)" | where userId=123 to find events containing the string "userId", extract the number following userId in the event, and then filter to only include events where the userId is 123.
Need help?
If you have any questions about using Logsuck after reading the documentation, please create an issue on this repository! There are no stupid questions here. You asking a question will help improve the documentation for everyone, so it is very much appreciated!
Contributing
Contributions in the form of pull requests and issues are welcome! Here are some tips on running Logsuck locally for developing.
First of all, you will need a version of Go with support for Go modules and the embed package (1.16 is used when building in CI), as well as a fairly recent Node/npm installation (Node v12 and npm v6 are used in CI). If cross compiling for Windows, you need gcc-mingw-w64.
Logsuck consists of two parts: A Go application for the backend and a preact GUI for the frontend. When the Go application is built, the frontend is bundled into the executable using the embed package. This bundling step allows Logsuck to be deployed as a single executable.
Since the frontend is necessary to build the backend, lets start off by building the frontend. All frontend code is contained in the ./internal/web/static directory.
cd internal/web/static
npm install && npm run build
This will build the frontend and put it in the ./internal/web/static/dist directory. Time to build the backend.
It is easier to build the backend on Linux than it is for Windows. If using Windows, I would recommend using Windows Subsystem for Linux and cross compiling to a Windows executable instead of trying to build directly on Windows. The official release builds for Windows are cross compiled from an Ubuntu installation.
If compiling for Linux, all you need to do is:
go build ./cmd/logsuck/main.go
to create a ./main file you can run.
If cross compiling for Windows, try the following instead:
GOOS=windows GOARCH=amd64 CGO_ENABLED=1 CC=x86_64-w64-mingw32-gcc go build ./cmd/logsuck/main.go
and you should have a ./main.exe file.
If you are working on the frontend, you can do the following things to make your life easier:
- Run webpack in watch mode by running
npm run watchin./internal/web/static - Add
{ "web": { "usePackagedFiles": "false" } }to your./logsuck.json. This will make it so that Logsuck will read the files off the filesystem instead of using the files that were bundled into the executable.
With those two steps done, you don't need to restart Logsuck to see the changes you've made to the frontend, and your changes will be compiled when you save. You just need to refresh your browser after making a change to see it in action.
Upcoming features
Logsuck is still heavily in development, so there are many features still being worked on as we race towards version 1.0.
Before version 1.0
- [x] Glob patterns for finding log files
- [ ] Compression for the FTS table to reduce storage requirements
- [ ] Retention setting to delete old events after a certain period of time
- [ ] "Show source" / "Show context" button to view events from the same source that are close in time to the selected event
- [x] Ability to search via time spans that are not relative to the current time, such as "All events between 2020-01-01 and 2020-01-05"
- [x] Ad hoc field extraction using pipes in the search command (equivalent to Splunk's "| rex")
- [ ] E-mail alerts
After version 1.0
- Authentication and authorization
- Creating tables and charts from searches
- Dashboards
- Plugins
- Advanced search commands like dedup, eval, transaction, etc.
- Support for an external database other than logsuck.db
- Your favorite feature
- ... And many more great things!