Map Floodwater of SAR Imagery with SageMaker
A report of the entire project can be found here. Please check the Projects tab for what I'm looking to work on next.
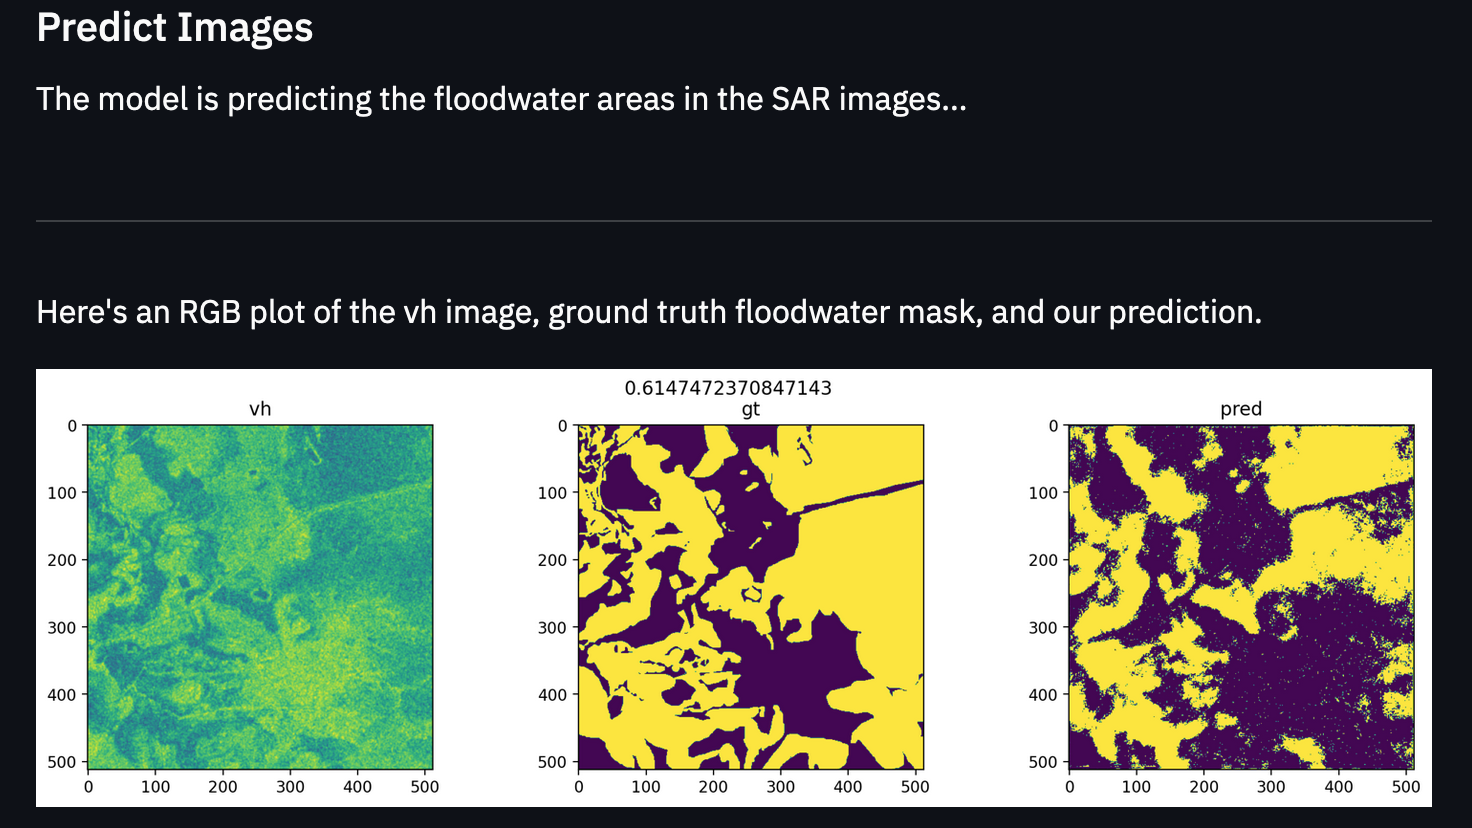
This repository focuses on training semantic segmentation models to predict the presence of floodwater for disaster prevention. The repository contains code from our submission to the STAC Overflow: Map Floodwater from Radar Imagery competition on DrivenData.org.

Here's a view of the Streamlit Web App that makes predictions with SageMaker model endpoint:
You can find the competition page here.
Domain Background
Floods have always led to terrible tragedies. Over the centuries, humanity has learned to build infrastructure to prevent floods, yet many people still suffer and die from floods.
Another approach we can take in terms of prevention is to apply machine learning to predict when a flood is about to happen so that we can evacuate and protect ourselves sooner to mitigate the flooding impact. There are many approaches we can take to do this, but one approach involves using satellite imagery to detect the presence of floodwater via semantic segmentation (classifying each pixel in an image as “does this pixel contain floodwater or not?”).
This is easier said than done. We can use satellites with cameras operating in the visible wavelength range, but those images can be obscured by fog and clouds. One way to deal with this issue is to use cameras that take photos in the microwave wavelength band. The microwave wavelength band is not obscured by cloud and fog and we are able to see right through them while still having a view of the Earth.
As we are focused on using AI for good, this competition is a great opportunity. As we improve our approach to predict natural disasters before they happen, we can reduce suffering and save lives. It is especially important to act on this quickly due to the increasing impacts of climate change.
Problem Statement
For this project, we are trying to build a machine learning model that can do semantic segmentation of floodwater in order to build a tool that provides us with early warnings that can help save lives and reduce damages from floods.
We will be using synthetic-aperture radar (SAR) imagery to predict the presence of floodwater.
Datasets and Inputs
The dataset we’ll be using is a subset of the Sentinel-1 dataset, which contains radar images stored as 512 x 512 pixel GeoTIFFs.
VV Polarization example:

VH Polarization example:

The following quotes are from the DrivenData competition page (Training set - Images): https://www.drivendata.org/competitions/81/detect-flood-water/page/386/
Each pixel in a radar image represents the energy that was reflected back to the satellite measured in decibels (dB). Pixel values can range from negative to positive values. A pixel value of 0.0 indicates missing data.
Sentinel-1 is a phase-preserving dual-polarization SAR system, meaning that it can receive a signal in both horizontal and vertical polarizations. Different polarizations can be used to bring out different physical properties in a scene. The data for this challenge includes two microwave frequency readings: VV (vertical transmit, vertical receive) and VH (vertical transmit, horizontal receive).

Benchmark Model
For the benchmark, we will be using the benchmark from the benchmark blog post of the competition: https://www.drivendata.co/blog/detect-floodwater-benchmark/
The benchmark model is a U-Net model with a ResNet34 as the backbone of the model. This model performs well in most cases when it comes to semantic segmentation tasks. The model starts out as a typical vision model as the backbone (in this case ResNet34), and then that serves as input to the remaining layers which are in a U-Net architecture. A U-Net architecture is divided into two parts: the contracting part which follows the typical CNN architecture which downsamples for classification, followed by an expansive part that upsamples the feature map to an output segmentation map. The second part is crucial for segmentation because in image segmentation we not only need to convert the feature map into a vector but also reconstruct the image from this vector so that we can segment the image.
Evaluation Metrics
Our goal is to get the highest performance we can on the Jaccard index metric (also known as Generalized Intersection over Union (IoU)). The Jaccard index measures the similarity between two label sets. In this case, it measures the size of the intersection divided by the size of the union of non-missing pixels. In other words, it measures how accurately we have segmented floodwater from other matter.

where A is the set of true pixels and B is the set of predicted pixels.
Ref (Performance metric): https://www.drivendata.org/competitions/81/detect-flood-water/page/386/