All Projects → fremag → Memoscope.net

fremag / Memoscope.net

Licence: unlicense
Dump and analyze .Net applications memory ( a gui for WinDbg and ClrMd )

Projects that are alternatives of or similar to Memoscope.net

Nuxt Memwatch
Quickly watch real-time memory stats of your nuxt app
Stars: ✭ 76 (-87.86%)
Mutual labels:  dump, memory
Windbg Cheat Sheet
A practical guide to analyze memory dumps of .Net applications by using Windbg
Stars: ✭ 43 (-93.13%)
Mutual labels:  windbg, memory-leak
AMLeaksFinder
A small tool for automatically detecting the [controller, view memory leak] in the project. 一款用于自动检测项目中【控制器内存泄漏,View 内存泄漏】的小工具,支持 ObjC,Swift。
Stars: ✭ 89 (-85.78%)
Mutual labels:  memory, memory-leak
Mmat
An automatically testing and analysis hprof library for android app (自动分析Android内存泄漏)
Stars: ✭ 137 (-78.12%)
Mutual labels:  memory, memory-leak
moneta
Moneta is a live usermode memory analysis tool for Windows with the capability to detect malware IOCs
Stars: ✭ 384 (-38.66%)
Mutual labels:  memory, dump
mem usage ui
Measuring and graphing memory usage of local processes
Stars: ✭ 124 (-80.19%)
Mutual labels:  memory, memory-leak
Filprofiler
A Python memory profiler for data processing and scientific computing applications
Stars: ✭ 277 (-55.75%)
Mutual labels:  memory, memory-leak
Wikiteam
Tools for downloading and preserving wikis. We archive wikis, from Wikipedia to tiniest wikis. As of 2020, WikiTeam has preserved more than 250,000 wikis.
Stars: ✭ 404 (-35.46%)
Mutual labels:  dump
Volatility
An advanced memory forensics framework
Stars: ✭ 5,042 (+705.43%)
Mutual labels:  memory
Memoryjs
Read and write process memory in Node.js (Windows API functions exposed via Node bindings)
Stars: ✭ 371 (-40.73%)
Mutual labels:  memory
Clickhouse Backup
Tool for easy ClickHouse backup and restore with cloud storages support
Stars: ✭ 359 (-42.65%)
Mutual labels:  dump
Lmdb Embeddings
Fast word vectors with little memory usage in Python
Stars: ✭ 404 (-35.46%)
Mutual labels:  memory
Pytorch Memory Utils
pytorch memory track code
Stars: ✭ 493 (-21.25%)
Mutual labels:  memory
Superdump
A service for automated crash-dump analysis
Stars: ✭ 384 (-38.66%)
Mutual labels:  windbg
Php Memory Profiler
Memory leak profiler for PHP
Stars: ✭ 544 (-13.1%)
Mutual labels:  memory-leak
Pidusage
Cross-platform process cpu % and memory usage of a PID
Stars: ✭ 364 (-41.85%)
Mutual labels:  memory
Dbgshell
A PowerShell front-end for the Windows debugger engine.
Stars: ✭ 566 (-9.58%)
Mutual labels:  windbg
Detoxinstruments
Detox Instruments is a performance–analysis and testing framework, designed to help developers profile their mobile apps in order to better understand and optimize their app's behavior and performance.
Stars: ✭ 513 (-18.05%)
Mutual labels:  memory
Wdbgark
WinDBG Anti-RootKit Extension
Stars: ✭ 450 (-28.12%)
Mutual labels:  windbg
Sympact
🔥 Stupid Simple CPU/MEM "Profiler" for your JS code.
Stars: ✭ 439 (-29.87%)
Mutual labels:  memory

MemoScope.Net Build Code Climate Issue CountDownload

Memoscope.Net Logo Dump and analyze .Net applications memory

Wiki

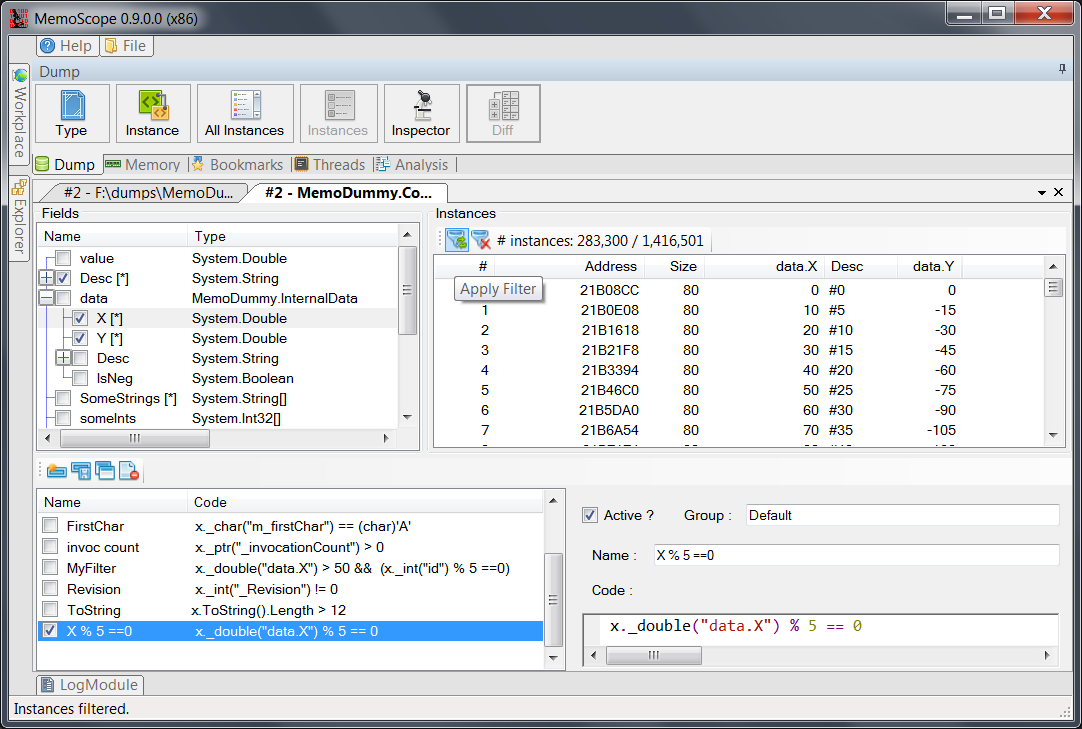
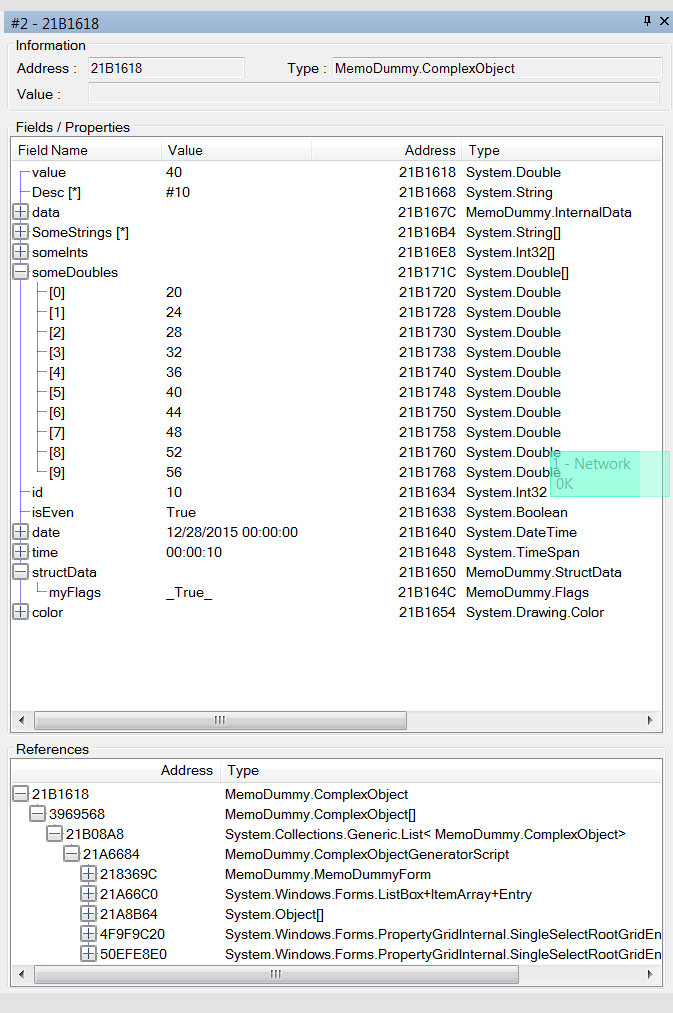
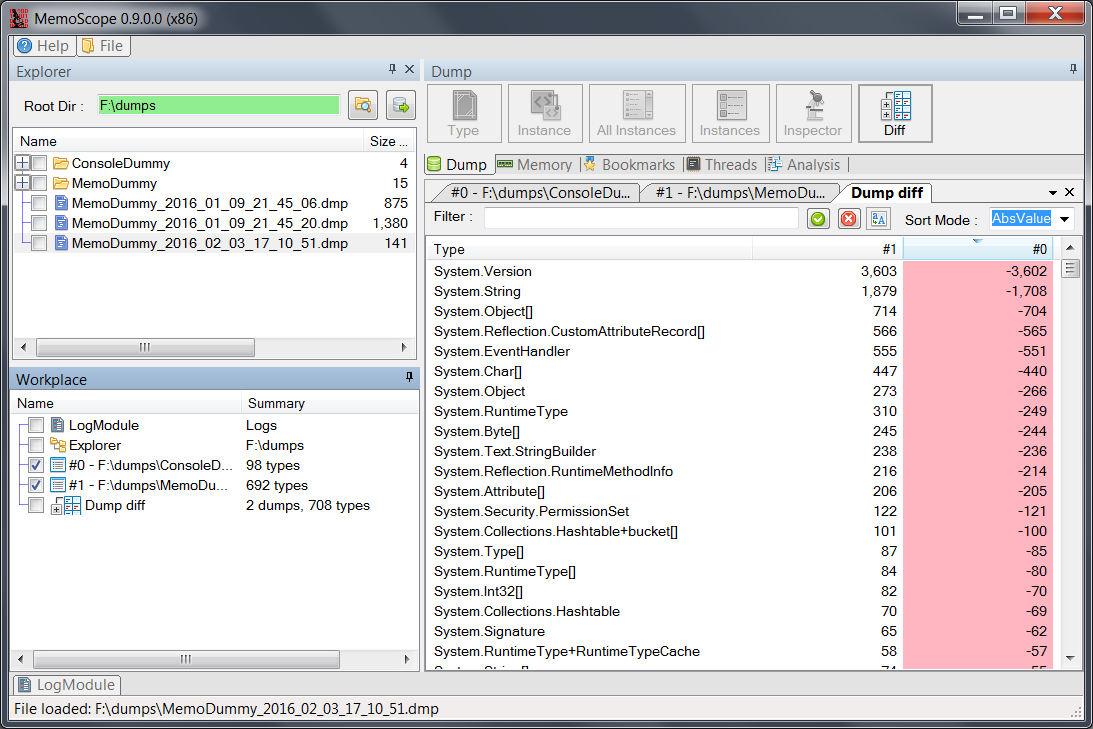
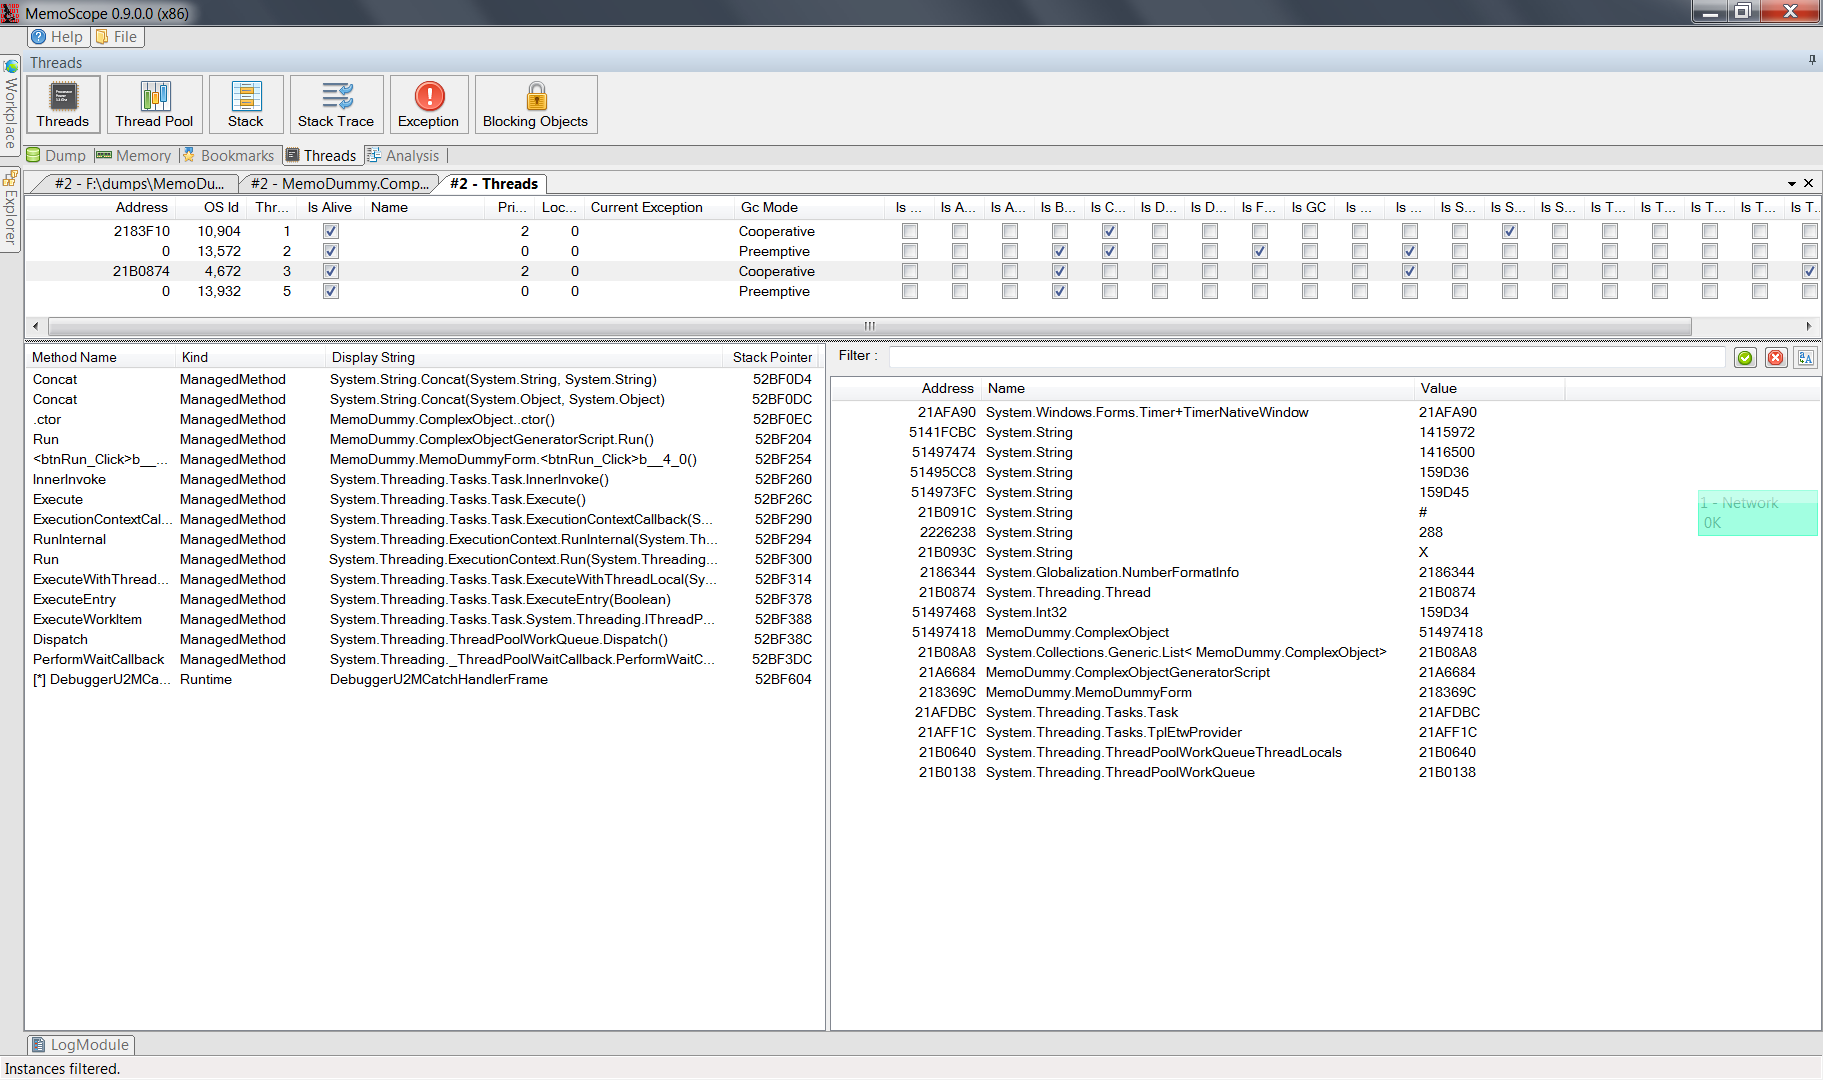
Please, read the wiki to know everything about MemoScope. Lot of pictures, animated gifs and some text for every major features.

TLDR

What it MemoScope.Net ?

It's a tool to analyze .Net process memory: it can dump an application's memory in a file and read it later. The dump file contains all data (objects) and threads (state, stack, call stack)

MemoScope.Net will analyze the data and help you to find memory leaks and deadlocks

Thanks to Lee Culver for his ClrMd library, without it, MemoScope.Net would not exist.

Install

Get binaries from AppVeyor: x86 x64

Use cases

Out of Memory

I know, with 64 bits apps it should not be an issue but computers only have a few a few Go so it may still happen if your application :

  • is using too much memory (peak)
  • runs for days and has a "slow" memory leak

Dead lock

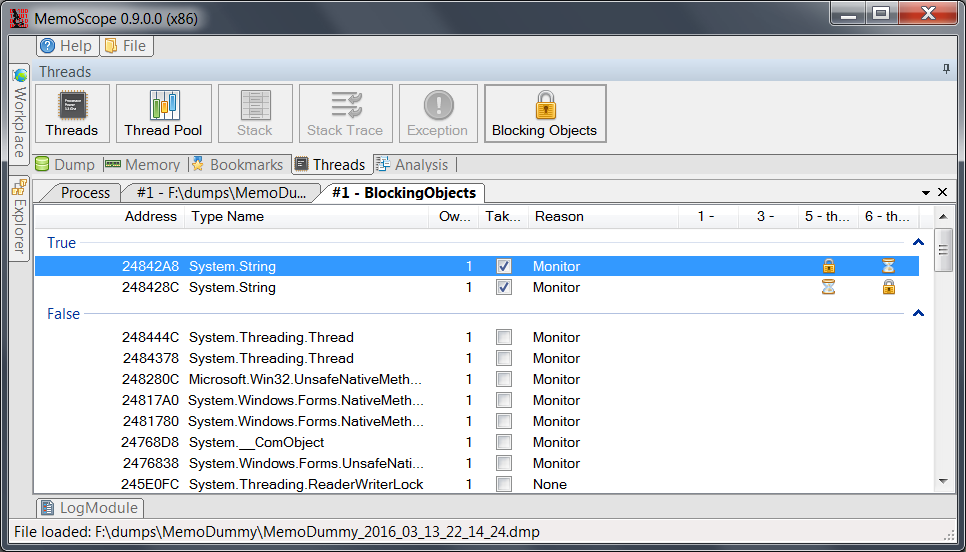
If your application is locked and you want to know where and why: dump the memory, display the threads status and blocking objects to see what thread is holding one that is waited by another thread.

Hard to reproduce bug

Sometimes, users can do weird things with your application and you can't make it happen on your computer so ask the user to dump its application's memory to analyze it on your machine.

Features

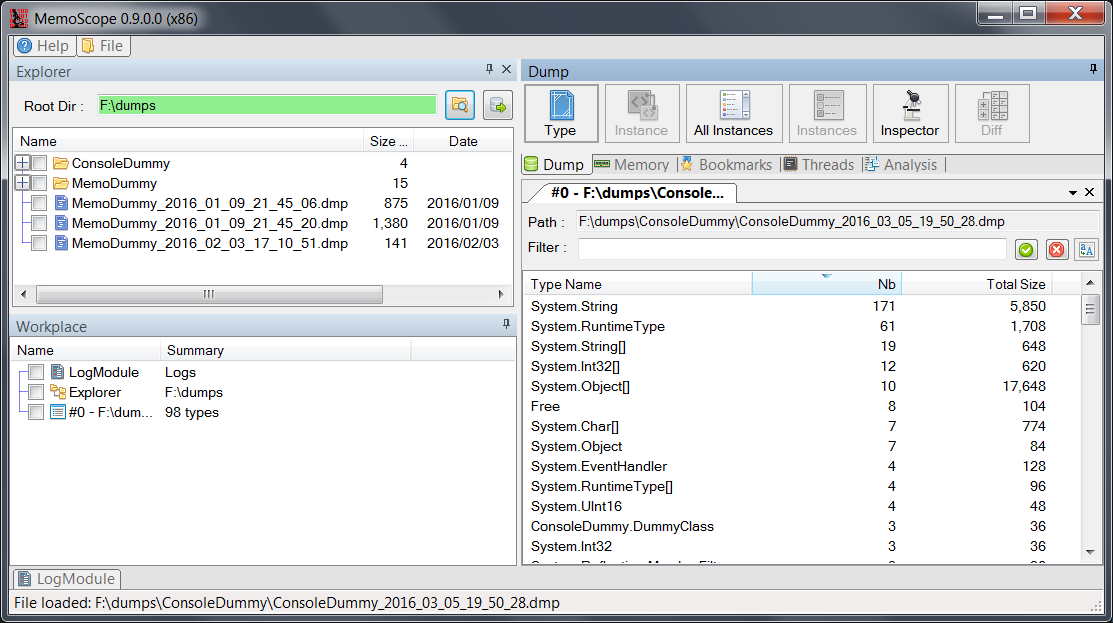
Heap statistics

Query instances

Instances content and references

Compare dumps

Threads, Stacks

Deadlocks

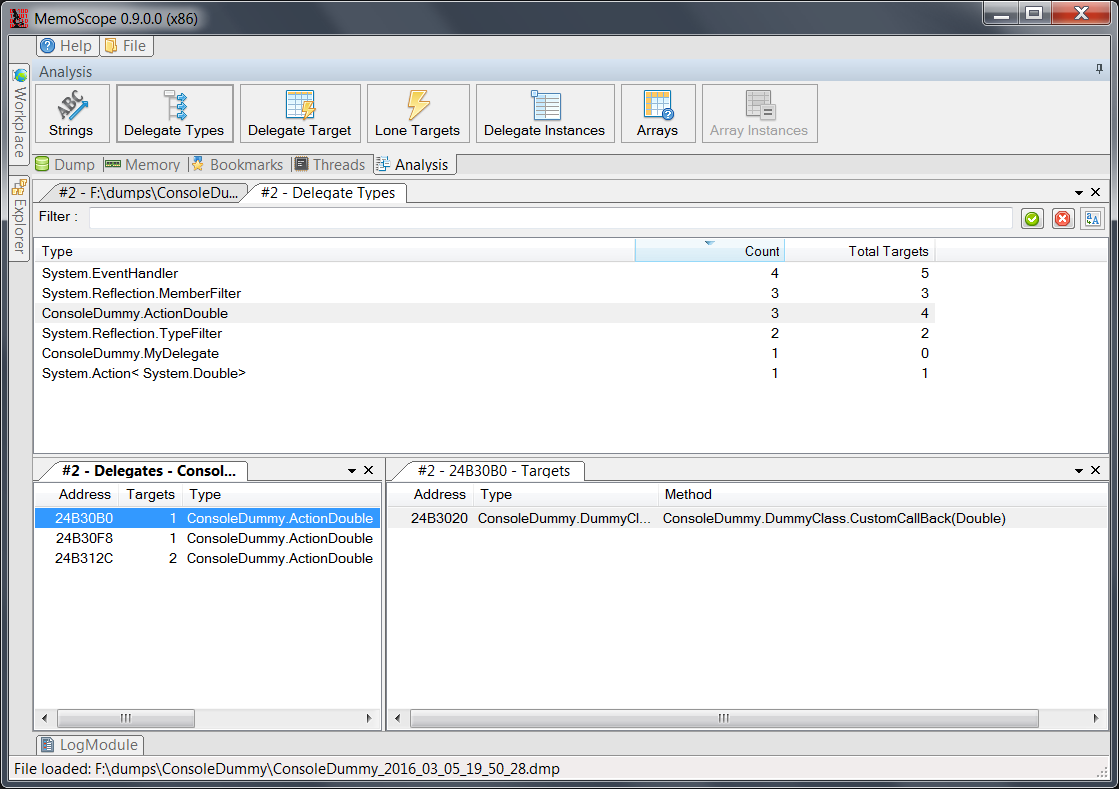
Delegates

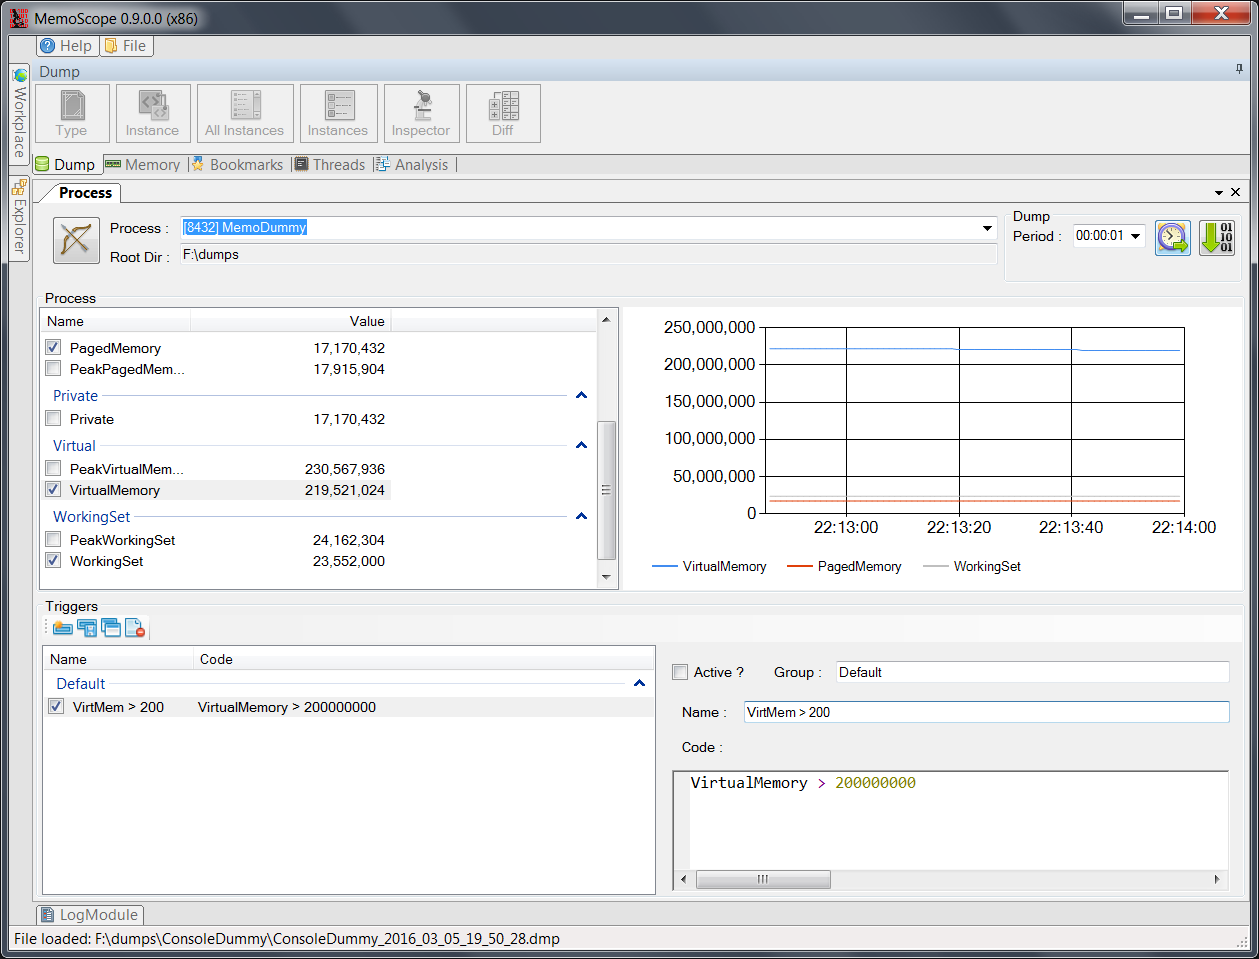
Dump process memory

Dump Process Memory

Note that the project description data, including the texts, logos, images, and/or trademarks, for each open source project belongs to its rightful owner. If you wish to add or remove any projects, please contact us at [email protected].