All Projects → pimlie → Nuxt Memwatch

pimlie / Nuxt Memwatch

Licence: other
Quickly watch real-time memory stats of your nuxt app

Programming Languages

javascript
184084 projects - #8 most used programming language

Projects that are alternatives of or similar to Nuxt Memwatch

Mysql Magic
dump mysql client password from memory
Stars: ✭ 183 (+140.79%)
Mutual labels:  heap, memory, leak
Rxlifecycle
Rx binding of stock Android Activities & Fragment Lifecycle, avoiding memory leak
Stars: ✭ 131 (+72.37%)
Mutual labels:  memory, leak
gctoolkit
Tool for parsing GC logs
Stars: ✭ 1,127 (+1382.89%)
Mutual labels:  memory, heap
AppListManager
📱 AppListManager (Android Library) makes managing application and activity lists easy.
Stars: ✭ 59 (-22.37%)
Mutual labels:  memory, leak
Heap allocator
A simple heap memory allocator in ~200 lines.
Stars: ✭ 661 (+769.74%)
Mutual labels:  heap, memory
AMLeaksFinder
A small tool for automatically detecting the [controller, view memory leak] in the project. 一款用于自动检测项目中【控制器内存泄漏,View 内存泄漏】的小工具,支持 ObjC,Swift。
Stars: ✭ 89 (+17.11%)
Mutual labels:  memory, leak
moneta
Moneta is a live usermode memory analysis tool for Windows with the capability to detect malware IOCs
Stars: ✭ 384 (+405.26%)
Mutual labels:  memory, dump
nested
A memory efficient container for rust nested collections
Stars: ✭ 28 (-63.16%)
Mutual labels:  memory, heap
o1heap
Constant-complexity deterministic memory allocator (heap) for hard real-time high-integrity embedded systems
Stars: ✭ 119 (+56.58%)
Mutual labels:  memory, heap
Memoscope.net
Dump and analyze .Net applications memory ( a gui for WinDbg and ClrMd )
Stars: ✭ 626 (+723.68%)
Mutual labels:  dump, memory
Nativeleakdetector
Win32 memory leak detector with ETW
Stars: ✭ 30 (-60.53%)
Mutual labels:  memory, leak
Himem
HiMem 是知乎内部使用的针对 Android 系统开发的线上应用内存使用监控与分析套件,目前支持 mmap/munmap/malloc/calloc/realloc/free 等库函数的监控,同时提供高性能的 Java 层和 Native 层调用栈捕获能力。
Stars: ✭ 58 (-23.68%)
Mutual labels:  memory
Main arena offset
A simple shell script to get main_arena offset of a given libc
Stars: ✭ 53 (-30.26%)
Mutual labels:  heap
Membrain
🧠 Type-safe memory units
Stars: ✭ 53 (-30.26%)
Mutual labels:  memory
Mongomem
In-memory MongoDB Server. Ideal for testing.
Stars: ✭ 51 (-32.89%)
Mutual labels:  memory
Ps mem
A utility to accurately report the in core memory usage for a program
Stars: ✭ 1,159 (+1425%)
Mutual labels:  memory
Ail Framework
AIL framework - Analysis Information Leak framework
Stars: ✭ 1,091 (+1335.53%)
Mutual labels:  leak
Observer cli
Visualize Erlang/Elixir Nodes On The Command Line
Stars: ✭ 1,058 (+1292.11%)
Mutual labels:  memory
Heap Exploitation
This book on heap exploitation is a guide to understanding the internals of glibc's heap and various attacks possible on the heap structure.
Stars: ✭ 1,043 (+1272.37%)
Mutual labels:  heap
Admin
AutoQuery + Admin UI for ServiceStack Projects
Stars: ✭ 47 (-38.16%)
Mutual labels:  memory

Quickly watch real-time memory stats of your nuxt app

npm npm (scoped with tag)

Introduction

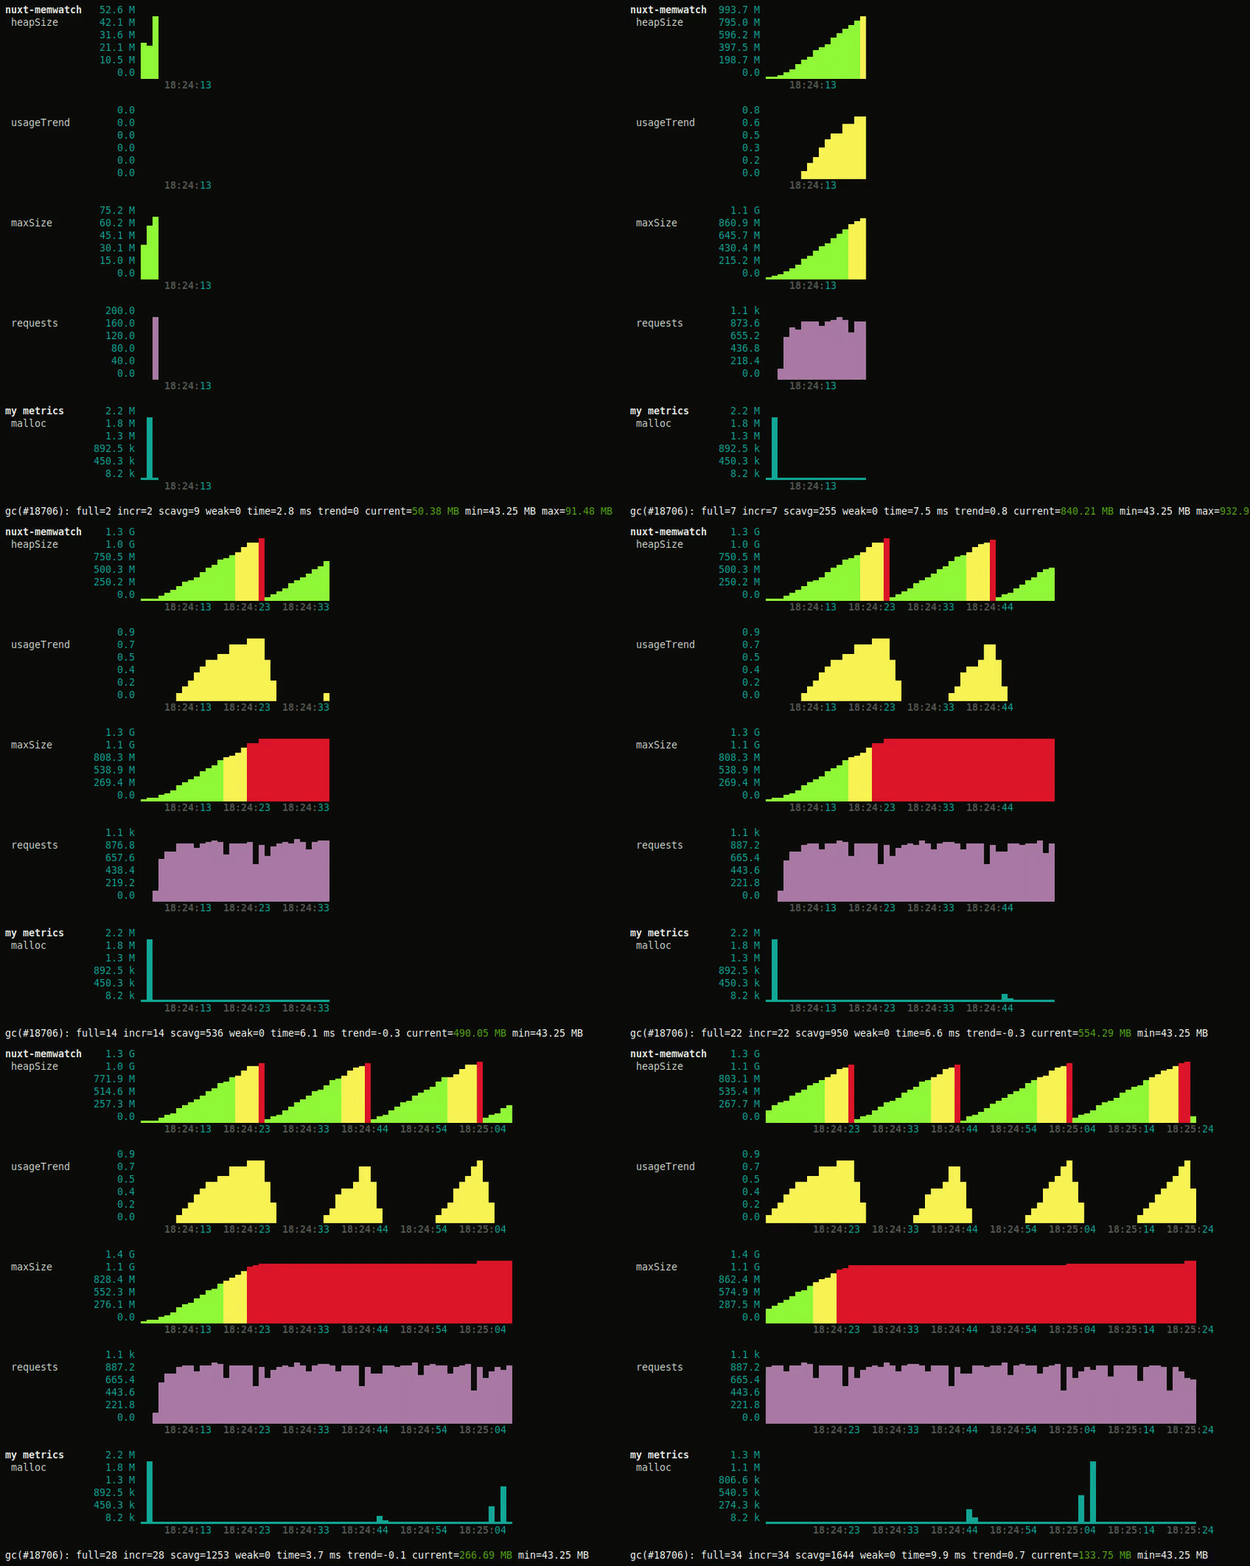
This module gives you better insights in the heap usages of your nuxt server. Especially when using the node-memwatch peer dependency it can be used to help track down memory leaks. This module uses node-memwatcher and node-memwatch, see their readme's for more information

Allthough other tools may provide the same or better functionality, this module is probably the quickest.

nuxt-memwatch demo

Setup

ℹ️ Please note you dont need to re-build your project when en-/disabling this module, you only need to restart the server

Install
npm install --save nuxt-memwatch
// or
yarn add nuxt-memwatch
Install the node-memwatcher peer dependency (recommended)
npm install --save @airbnb/node-memwatch
// or
yarn add @airbnb/node-memwatch
Add nuxt-memwatch to modules section of nuxt.config.js
  modules: [
    ['nuxt-memwatch', { averages: true }],
  ]

or

  modules: [
    'nuxt-memwatch'
  ],
  memwatch: {
    graph: true,
    graphSetup(setup) {
      setup.metrics.malloc = {
        aggregator: 'avg',
        color: 'cyan'
      }
    },
    graphAddMetric(turtleGraph, stats) {
      turtleGraph.metric('my metrics', 'malloc').push(stats.malloced_memory)
    }
  }

Example

You can run the included example by cloning this repo, run yarn install && yarn build and finally yarn start. Then generate some requests by running ab -c100 -n100000 http://127.0.0.1:3000/, this example uses max ~1.3GB of memory which is fine-tuned for node's default heap size limit of 1.5GB (more specifically, 1.5GB is the default limit of the old space)

Running in development mode

Nuxt is not running (memory) 'optimised' in development mode. Memory leaks are likely so although its' possible to use this module in development mode it is not recommended.

FAQ

Please check the node-memwatcher FAQ

Module Options

Besides the default node-memwatcher options, this module provides some extra options

gcAfterEvery number (0)

If set to a number larger then 0, we will force the gc to run after this number of requests. E.g. when set to 1 the gc runs after every request

🔥 This only works when you have either installed the peer dependency or are running node with --expose_gc

nuxtHook string (listen)

Memory leaks and heap usages are probably mostly interesting when the nuxt server is running and serving requests. Therefore we start listening for stats events on the listen hook, unless you are running this module in development mode, then we listen for build:done instead (when you havent change this value). If e.g you would like to debug nuxt generate you could do:

// nuxt.config.js

import { getMemwatch } from 'node-memwatcher'
let memwatch

export default {
  ...
  memwatch: {
    graph: false,
    nuxtHook: 'generate:before'
  },
  hooks: {
    generate: {
      async before() {
        memwatch = await getMemwatch()
      },
      routeCreated() {
        // this probably wont work as you expect
        // as node/v8 will probably be too busy to run the gc
        // but more importantly there is not really a nuxt hook
        // available to do this in the right place
        // This does work however, but the gc call at route `n`
        // can only clear memory usage by previous routes `< n`
        memwatch.gc()
      }
    }
  }
  ...
Note that the project description data, including the texts, logos, images, and/or trademarks, for each open source project belongs to its rightful owner. If you wish to add or remove any projects, please contact us at [email protected].