All Projects β†’ komo-fr β†’ pep_map_site

komo-fr / pep_map_site

Licence: other
🐍 Web page that visualizes the reference relation between PEPs (Python Enhancement Proposals).

Programming Languages

python
139335 projects - #7 most used programming language

Projects that are alternatives of or similar to pep map site

Gem
Stars: ✭ 1,070 (+6194.12%)
Mutual labels:  network-visualization
Phpipam
phpipam development repository
Stars: ✭ 1,578 (+9182.35%)
Mutual labels:  network-visualization
Netwulf
Interactive visualization of networks based on Ulf Aslak's d3 web app.
Stars: ✭ 254 (+1394.12%)
Mutual labels:  network-visualization
Sigmajs
Ξ£ sigma.js for R
Stars: ✭ 58 (+241.18%)
Mutual labels:  network-visualization
App
free software application for social network analysis and visualization
Stars: ✭ 94 (+452.94%)
Mutual labels:  network-visualization
Graphlayouts
new layout algorithms for network visualizations in R
Stars: ✭ 176 (+935.29%)
Mutual labels:  network-visualization
Cytoscape.js Grid Guide
A Cytsocape.js extension to provide a framework for grid interactions such as grid lines and snapping to grid, and guidelines and snap support for alignment of nodes.
Stars: ✭ 40 (+135.29%)
Mutual labels:  network-visualization
fiware-pep-proxy
Support for proxy functions within OAuth2-based authentication schemas. Also implements PEP functions within an XACML-based access control schema.
Stars: ✭ 26 (+52.94%)
Mutual labels:  pep
Particles
A particle simulation engine based on a port of d3-force
Stars: ✭ 104 (+511.76%)
Mutual labels:  network-visualization
Deepgraph
Analyze Data with Pandas-based Networks. Documentation:
Stars: ✭ 232 (+1264.71%)
Mutual labels:  network-visualization
Openwisp Network Topology
Network topology collector and visualizer. Collects network topology data from dynamic mesh routing protocols or other popular networking software like OpenVPN, allows to visualize the network graph, save daily snapshots that can be viewed in the future and more.
Stars: ✭ 67 (+294.12%)
Mutual labels:  network-visualization
Cytoscape.js Expand Collapse
A Cytoscape.js extension to expand/collapse nodes for better management of complexity of compound graphs
Stars: ✭ 83 (+388.24%)
Mutual labels:  network-visualization
Ggnet
Network visualization with ggplot2
Stars: ✭ 182 (+970.59%)
Mutual labels:  network-visualization
Netdiffuser
netdiffuseR: Analysis of Diffusion and Contagion Processes on Networks
Stars: ✭ 57 (+235.29%)
Mutual labels:  network-visualization
MeshNetSimulator
A simulator for sketching mesh network routing strategies
Stars: ✭ 71 (+317.65%)
Mutual labels:  network-visualization
Lenz
Console based MAP πŸ—Ί : with lots of features 🀩
Stars: ✭ 51 (+200%)
Mutual labels:  network-visualization
Workbase
Grakn Workbase (Knowledge IDE)
Stars: ✭ 106 (+523.53%)
Mutual labels:  network-visualization
Netvisix
Netvisix visualizes the network packet flow between hosts
Stars: ✭ 65 (+282.35%)
Mutual labels:  network-visualization
multigraph
multigraph: Plot and Manipulate Multigraphs in R
Stars: ✭ 18 (+5.88%)
Mutual labels:  network-visualization
Awesome Network Analysis
A curated list of awesome network analysis resources.
Stars: ✭ 2,525 (+14752.94%)
Mutual labels:  network-visualization

PEP Map (Ξ± ver)

What is this?

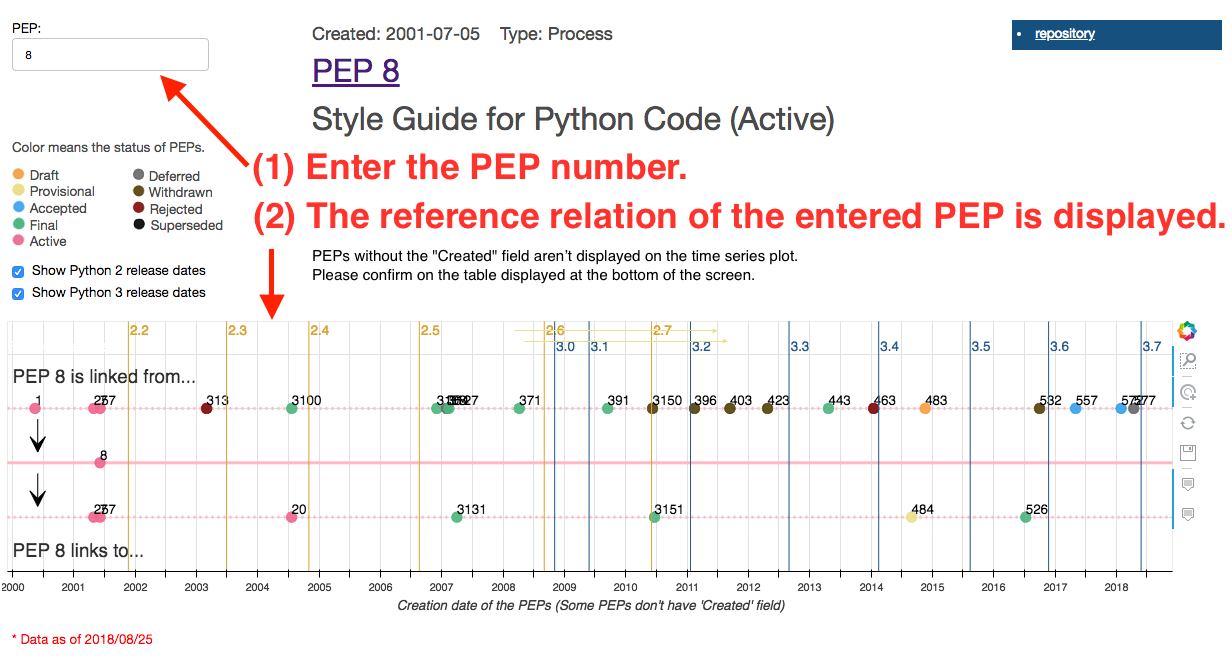
PEP Map is web pages that visualizes the reference relation between PEPs (Python Enhancement Proposals).

Timeline

https://komo-fr.github.io/pep_map_site/timeline.html
Let's enter the PEP number in the left text box.
Then you can see the following information.

  1. Which PEPs do link that PEP?
  2. Which PEPs are linked from that PEP?

PEP Map| Timeline

Note

  • How to look at the time series plot:
    • color: The color of the node means PEP's Status. For PEP status, refer to PEP 1.
    • date (x axis): The value of the "Created" field for each PEP.
      • According to PEP 1, the "Created" field seems to be a required item. However, in fact there are PEPs that "Created" field is empty. If "Created" is empty, it isn't displayed on the time series plot.

Network

https://komo-fr.github.io/pep_map_site/network.html

Let's enter the PEP number in the left text box or tap node.
Then you can see the following information.

  1. Which PEPs do link that PEP?
  2. Which PEPs are linked from that PEP?

PEP Map| Network

Note

  • Node size:
    • The area of the node is proportional to in-degree (the number of other PEP referring to this PEP).
    • if in-degree is 0, the PEP is drawn with 1 / 10 size of PEP that has in-degree is 1.
    • Self loop and PEP 0 (Table of Contents) are not counted.
  • Node color:
    • The color of the node means PEP's Status. For PEP status, refer to PEP 1.

Data

  • How to get the reference relation between PEPs:
    • Whether reference relation exists or not is judged based on <a> tag. Therefore, it is NOT possible to deal with the cases which aren't linked even if mentioning other PEP.
    • The visualized data is NOT the latest version since scraping process isn't performed periodically (This will be resolved in the near future). Please check the data acquisition date with "Data as of ..." in the red in the center of the screen.

If you find mistakes in my English, I'd be happy to tell me in issue πŸ˜†
(へんγͺθ‹±θͺžθ¦‹γ€γ‘γŸγ‚‰Issueγ§ζ•™γˆγ¦γ­)

Note that the project description data, including the texts, logos, images, and/or trademarks, for each open source project belongs to its rightful owner. If you wish to add or remove any projects, please contact us at [email protected].