XhmikosR / Perfmonbar
Licence: gpl-3.0
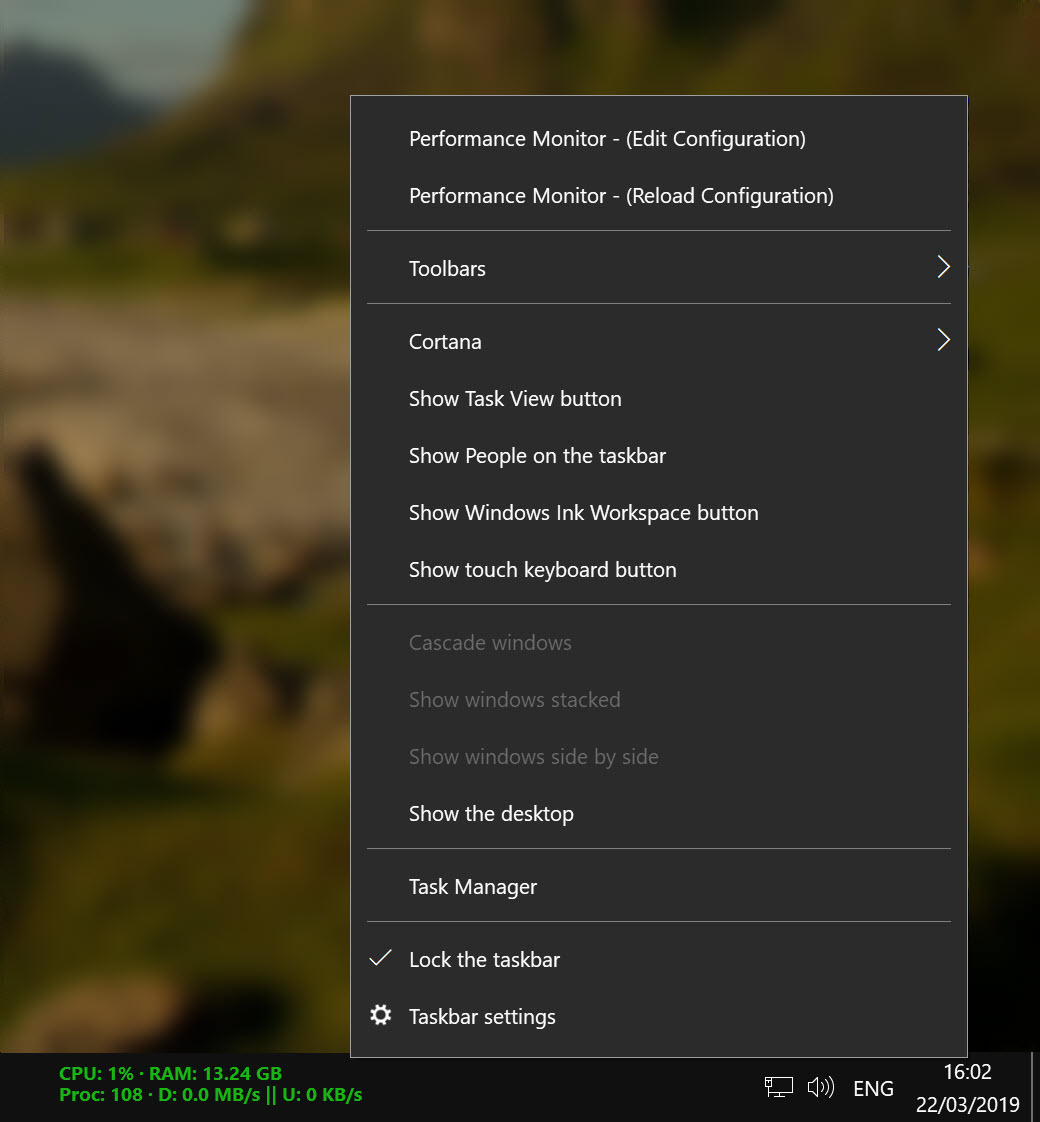
Displays performance counters on the Windows Taskbar
Stars: ✭ 161
Projects that are alternatives of or similar to Perfmonbar
Processhacker
A free, powerful, multi-purpose tool that helps you monitor system resources, debug software and detect malware.
Stars: ✭ 6,285 (+3803.73%)
Mutual labels: monitoring, monitor
Vigil
🚦 Microservices Status Page. Monitors a distributed infrastructure and sends alerts (Slack, SMS, etc.).
Stars: ✭ 804 (+399.38%)
Mutual labels: monitoring, monitor
Eul
🖥️ macOS status monitoring app written in SwiftUI.
Stars: ✭ 6,707 (+4065.84%)
Mutual labels: monitoring, monitor
Simplemonitor
A Python-based network and host monitor
Stars: ✭ 331 (+105.59%)
Mutual labels: monitoring, monitor
Laravel Api Health
Monitor first and third-party services and get notified when something goes wrong!
Stars: ✭ 65 (-59.63%)
Mutual labels: monitoring, monitor
Fileboy
fileboy,文件变更监听通知工具,使用 Go 编写。Fileboy, File Change Monitoring Notification Tool, written with Go.
Stars: ✭ 345 (+114.29%)
Mutual labels: monitoring, monitor
Librehardwaremonitor
Libre Hardware Monitor, home of the fork of Open Hardware Monitor
Stars: ✭ 685 (+325.47%)
Mutual labels: monitoring, monitor
Myperf4j
High performance Java APM. Powered by ASM. Try it. Test it. If you feel its better, use it.
Stars: ✭ 2,281 (+1316.77%)
Mutual labels: monitoring, monitor
Azure Grafana Dashboard Templates
Grafana dashboard templates for Azure
Stars: ✭ 31 (-80.75%)
Mutual labels: monitoring, monitor
Sentry
Sentry is cross-platform application monitoring, with a focus on error reporting.
Stars: ✭ 29,700 (+18347.2%)
Mutual labels: monitoring, monitor
Monitoror
Unified monitoring wallboard — Light, ergonomic and reliable monitoring for anything.
Stars: ✭ 3,400 (+2011.8%)
Mutual labels: monitoring, monitor
Netfil
A kernel network manager with monitoring and limiting capabilities for macOS. #nsacyber
Stars: ✭ 97 (-39.75%)
Mutual labels: monitoring, monitor
Hastic Server
Hastic data management server for analyzing patterns and anomalies from Grafana
Stars: ✭ 292 (+81.37%)
Mutual labels: monitoring, monitor
App perf
Open source application performance monitoring tool with emphasis on ease of setup and use. Providing similar functionality like NewRelic/AppNeta/Skylight etc.
Stars: ✭ 353 (+119.25%)
Mutual labels: monitoring, monitor
Easy Monitor
企业级 Node.js 应用性能监控与线上故障定位解决方案
Stars: ✭ 2,451 (+1422.36%)
Mutual labels: monitoring, monitor
Grassmarlin
Provides situational awareness of Industrial Control Systems (ICS) and Supervisory Control and Data Acquisition (SCADA) networks in support of network security assessments. #nsacyber
Stars: ✭ 621 (+285.71%)
Mutual labels: monitoring, monitor
Auto Cpufreq
Automatic CPU speed & power optimizer for Linux
Stars: ✭ 843 (+423.6%)
Mutual labels: monitoring, monitor
Gatus
⛑ Gatus - Automated service health dashboard
Stars: ✭ 1,203 (+647.2%)
Mutual labels: monitoring, monitor
Pingprom
Prometheus uptime monitoring quickstart
Stars: ✭ 107 (-33.54%)
Mutual labels: monitoring, monitor
Gitlab Ci Monitor
A simple dashboard for monitoring GitLab CI builds. Alpha version.
Stars: ✭ 152 (-5.59%)
Mutual labels: monitoring
Perfmonbar


Website: https://xhmikosr.github.io/perfmonbar/
Notes
- You will have to edit the default
config.xmlto match your system. - The default
config.xmlwill not work for non-English systems. You have to adjust the config file, see below. - For the known issues see issues.
Configuration
The config.xml file must be adapted in the following cases:
- You have a non-English Windows system running. The search strings in the
config.xmlfile must be adapted to the language of the operating system, otherwise the corresponding strings will not be found by Perfmonbar and nothing will be displayed in the taskbar. - You want to display other information in the taskbar. To do this, you have to find the appropriate and available strings and change them in the
config.xmlfile. - You want to change the appearance of the information in the taskbar. To do this, you need to change the corresponding properties in the
config.xmlfile.
Where is the config.xml file?
Usually, the config.xml file can be found under:
C:\Users\{User}\AppData\Roaming\PerfmonBar\config.xml
To quickly get to the directory, you can simply type %APPDATA%\PerfmonBar.
How to find the desired settings?
Open a console and run the command typeperf -q > counters.txt
Then you can search the file counters.txt for the desired performance counters that are available on your computer. The counters are unfortunately called differently in every single language.
Note that the project description data, including the texts, logos, images, and/or trademarks,
for each open source project belongs to its rightful owner.
If you wish to add or remove any projects, please contact us at [email protected].