deepmind / Plplot Ffi
Programming Languages
plplot-ffi
LuaJIT wrapper for PLplot
Installation
This package requires PLplot to be installed in your system. You can download it from the project website, and also install it using brew in OS X:
brew install plplot
or apt in Ubuntu:
apt-get install libplplot12 plplot12-driver-cairo
The PLplot functions will draw the plots into cairo surfaces. The torch-oocairo provides Lua bindings for Torch.
C API
The first thing to do in order to access the PLplot C API is requiring the plplot.api Lua package:
local pl = require 'plplot.api'
Then the namespace pl will contain the functions in the PLplot C API. The functions in this API are usually prefixed by pl, for example plinit will now be accesible via pl.init, plenv via pl.env and so on. The only exception is plend, accesible via pl.plend.
High level interface
This package tries to provide a similar interface to that in torch/gnuplot. In the following examples, cairoContext will always be a structure obtained by calling to the function context_create in torch-oocairo.
### Line plots
local plplot = require 'plplot'

...

local x = torch.DoubleTensor{0,1,2,3,4,5,6,7,8,9,10}
local plots = {}
for i = 1,3 do
    plots[i] = {x, torch.mul(x,i), '*-'}
end

plplot.init(cairoContext, 800, 800)
plplot.plot(plots)
plplot.labels('Line Plot', 'X axis', 'Y axis')
plplot.close()
The third element in the table defining each plots defines the format of that plot:
-
'|'for using boxes. -
'-'for using lines. -
Any other character will be printed in all the points of the plot. This behaviour can be combined with lines. For example,
'-*'will print characters*separated by lines.
If only one tensor is defined, then x values {0,1,2...} will be assumed.
Histograms
local plplot = require 'plplot'

...

plplot.init(cairoContext, 800, 800)
plplot.hist(torch.randn(10000), 20)
plplot.labels('Histogram', 'X axis', 'Y axis')
plplot.close()
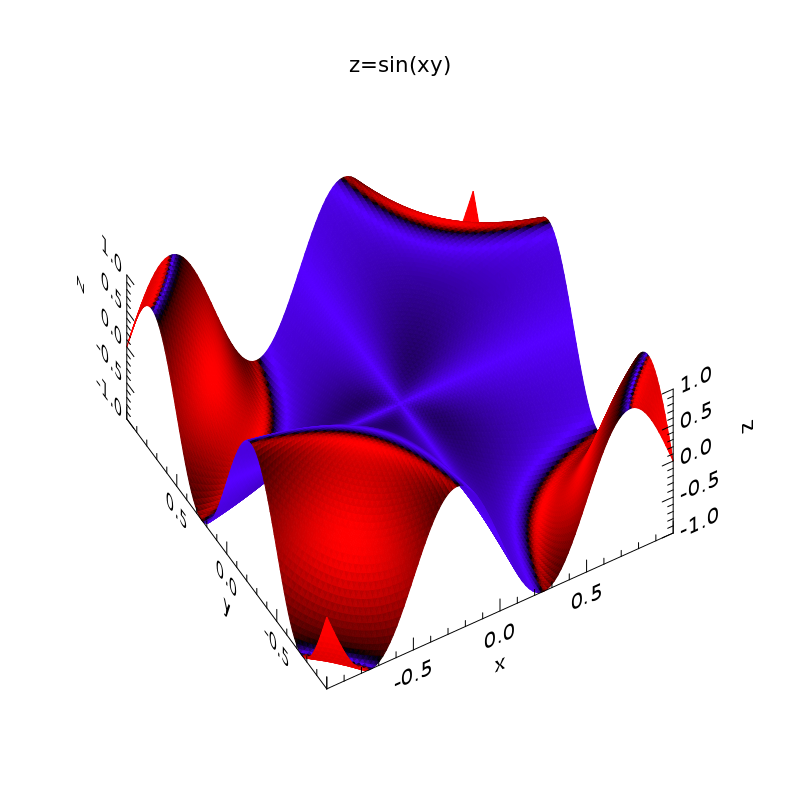
Surfaces
local plplot = require 'plplot'

...

x = torch.linspace(-1,1)
z = torch.sin(torch.zeros(x:size(1),x:size(1)):addr(x,x)*math.pi*2)

plplot.init(cairoContext, WIDTH, HEIGTH)
plplot.splot({x,x,z})
plplot.labels3d('x', 'y', 'z')
plplot.title('z=sin(xy)')
plplot.close()
If only one tensor is defined, then x and y values {0,1,2...} will be assumed.
Labels
There are three functions to add labels to the plot:
-
plplot.title(title): Adds a title. -
plplot.labels(title, xlabel, ylabel): Adds a title and labels for the two axis in a 2D plot. -
plplot.3dlabels(xlabel, ylabel, zlabel): Adds labels for all the axis in a 3D plot.
Colors
The function plplot.colors(axisColor, color) changes the colors used for the plot. The colors are represented
by tables with three numbers from 0 to 255 corresponding to the RGB components. The parameter axisColor determines
the color that the library will use to print the axis and the labels. The second parameter is a list of colors that
will be used in the same order to show the plots.


