jonnenauha / Prometheus_varnish_exporter
Programming Languages
Labels
Projects that are alternatives of or similar to Prometheus varnish exporter
Varnish exporter for Prometheus
Scrapes the varnishstat -j JSON output on each Prometheus collect and exposes all reported metrics. Metrics with multiple backends or varnish defined identifiers (e.g. VBE.*.happy SMA.*.c_bytes LCK.*.creat) and other metrics with similar structure (e.g. MAIN.fetch_*) are combined under a single metric name with distinguishable labels. Vanish naming conventions are preserved as much as possible to be familiar to Varnish users when building queries, while at the same time trying to following Prometheus conventions like lower casing and using _ separators.
Handles runtime Varnish changes like adding new backends via vlc reload. Removed backends are reported by varnishstat until Varnish is restarted.
Advanced users can use -n -N, they are passed to varnishstat.
I have personally tested the following versions of Varnish to work 6.0.0, 5.2.1, 5.1.2, 4.1.1, 4.1.0, 4.0.3 and 3.0.5. Missing category groupings in 3.x like MAIN. are detected and added automatically for label names to be consistent across versions, assuming of course that the Varnish project does not remove/change the stats.
I won't make any backwards compatibility promises at this point. Your built queries can break on new versions if metric names or labels are refined. If you find bugs or have feature requests feel free to create issues or send PRs.
Installing and running
You can find the latest binary releases for linux, darwin, windows, freebsd, openbsd and netbsd from the github releases page.
By default the exporter listens on port 9131. See prometheus_varnish_exporter -h for available options.
To test that varnishstat is found on the host machine and to preview all exported metrics run
prometheus_varnish_exporter -test
Troubleshooting
Could not get hold of varnishd, is it running?
2020/12/18 20:22:33 [FATAL] Startup test: varnishstat scrape failed: exit status 1
User you are executing as can't find or access varnish services. sudo is a hammer that works, see for proper solutions #62.
Docker
Scraping metrics from Varnish running in a docker container is possible since 1.4.1. Resolve your Varnish container name with docker ps and run the following. This will use docker exec <container-name> to execute varnishstat inside the spesified container.
prometheus_varnish_exporter -docker-container-name <container_name>
I still don't have a easy, clear and user friendly way of running this exporter in a docker container. For community efforts and solutions see this issue.
Grafana dashboards
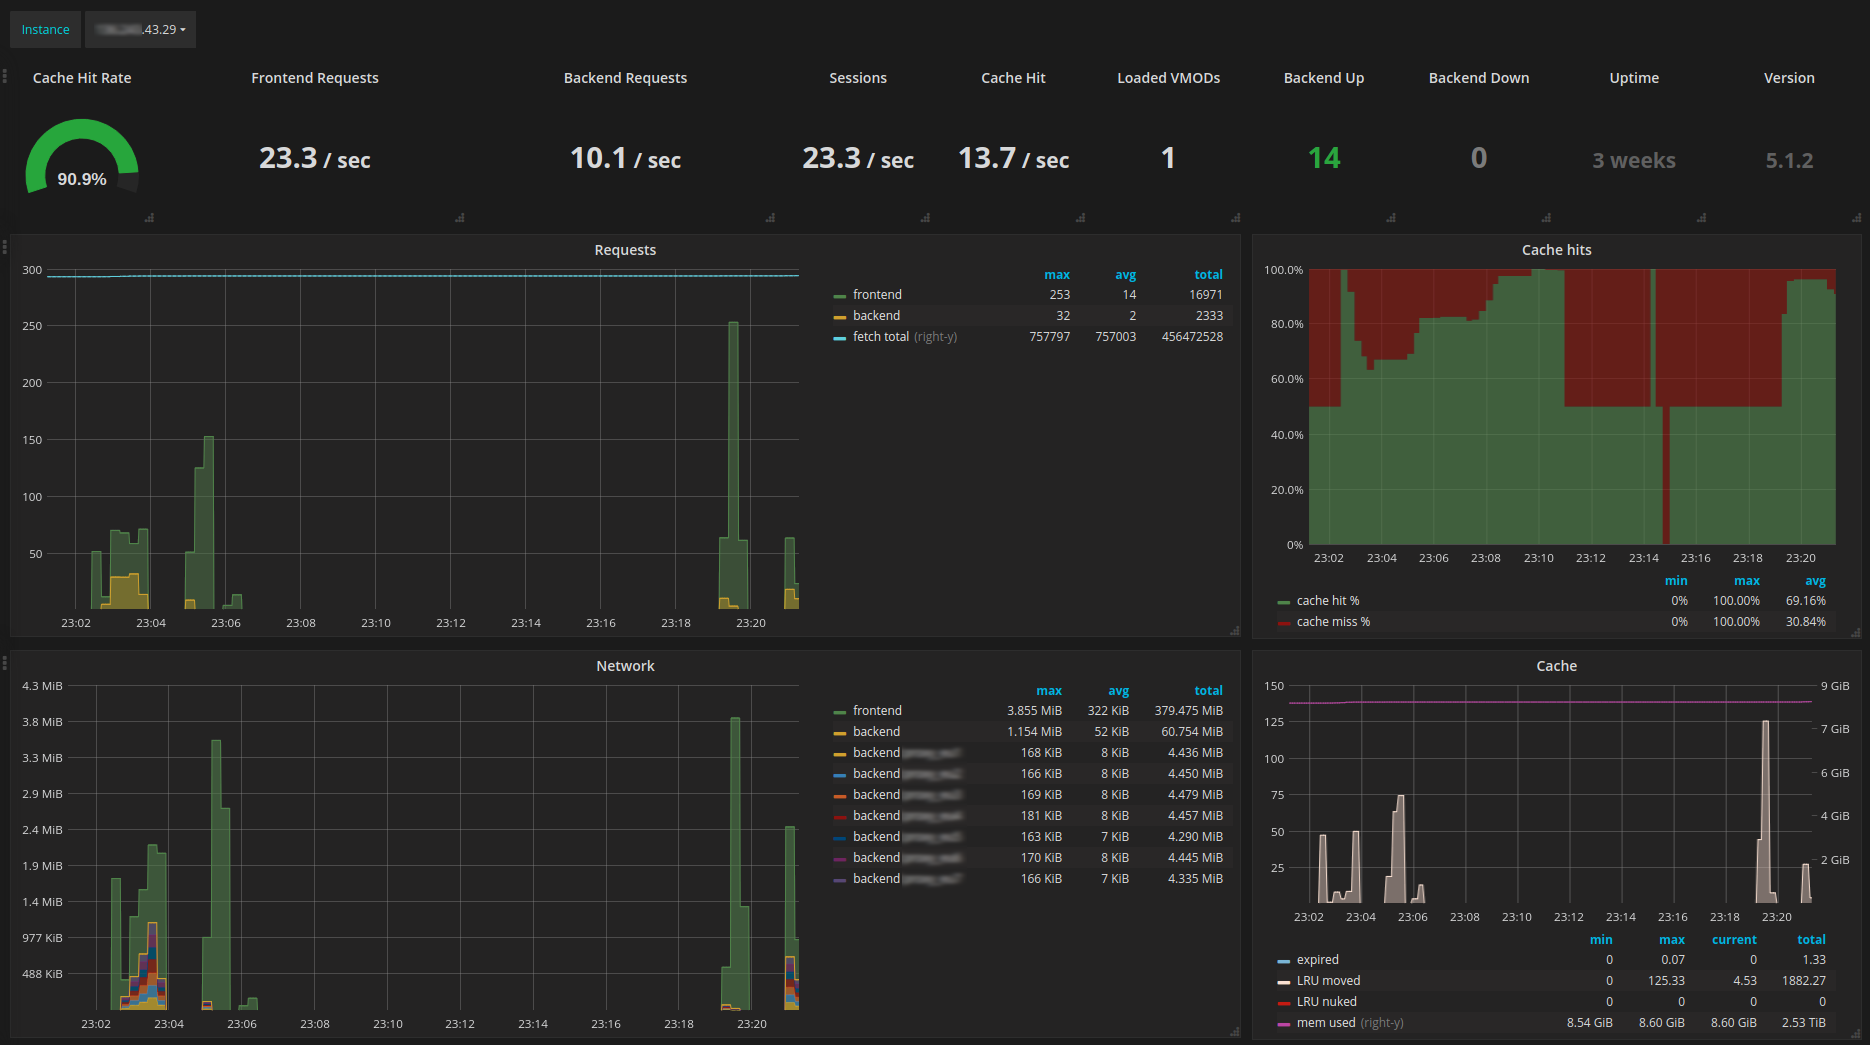
You can download my dashboard seen in the above picture here. I use it at work with our production Varnish instances. I would be interested in your dashboards if you wish to share them or improvement ideas to my current one.
Varnish 4 and VCL UUIDs
Starting with version 1.2 backend and server labels are always set. For backend-related metrics and Varnish 4 the server tag will be set to the VCL UUIDs for that backend. Note that there might be multiple VCLs loaded at the same time and the server tag might not be meaningful in that case.
To aggregate all loaded VCLs into per-backend metric the following Prometheus recording rules are recommended:
backend:varnish_backend_bereq_bodybytes:sum = sum(varnish_backend_bereq_bodybytes) without (server)
backend:varnish_backend_bereq_hdrbytes:sum = sum(varnish_backend_bereq_hdrbytes) without (server)
backend:varnish_backend_beresp_bodybytes:sum = sum(varnish_backend_beresp_bodybytes) without (server)
backend:varnish_backend_beresp_hdrbytes:sum = sum(varnish_backend_beresp_hdrbytes) without (server)
backend:varnish_backend_conn:sum = sum(varnish_backend_conn) without (server)
backend:varnish_backend_happy:sum = sum(varnish_backend_happy) without (server)
backend:varnish_backend_pipe_hdrbytes:sum = sum(varnish_backend_pipe) without (server)
backend:varnish_backend_pipe_in:sum = sum(varnish_backend_pipe_in) without (server)
backend:varnish_backend_pipe_out:sum = sum(varnish_backend_pipe_out) without (server)
backend:varnish_backend_req:sum = sum(varnish_backend_req) without (server)
Build
One time setup
This repot support go modules so out of GOPATH builds are supported. This makes development and buildings easier for go "novices".
You need go 1.11 or higher, otherwise you can keep using GOPATH based development (see old README).
-
Install latest go or use OS repos
golangpackage.
Development
# clone
git clone [email protected]:jonnenauha/prometheus_varnish_exporter.git
cd prometheus_varnish_exporter

# build binary to current directory
go build

# release with cross compilation
./build.sh <version>

