All Projects → apexcharts → React Apexcharts

apexcharts / React Apexcharts

Licence: mit
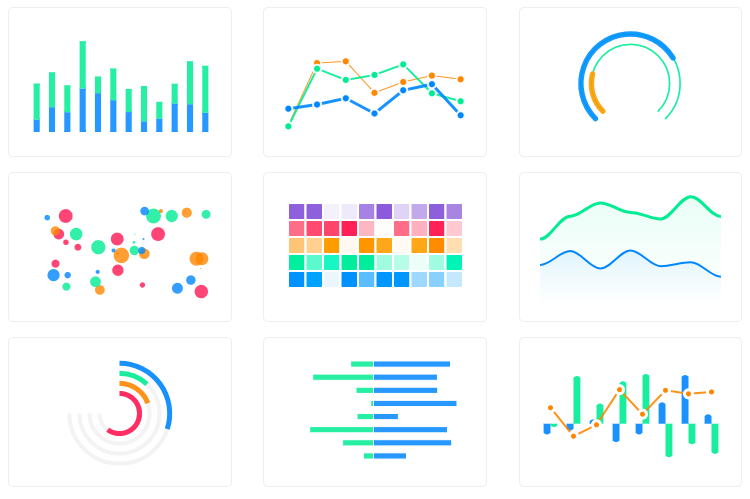
📊 React Component for ApexCharts

Programming Languages

javascript
184084 projects - #8 most used programming language

Projects that are alternatives of or similar to React Apexcharts

React Native Animated Charts
Set of components and helpers for building complex and beautifully animated charts
Stars: ✭ 443 (-34.56%)
Mutual labels:  charts
Abixen Platform
Abixen Platform
Stars: ✭ 530 (-21.71%)
Mutual labels:  charts
Awesome
A curated list of awesome Chart.js resources and libraries
Stars: ✭ 621 (-8.27%)
Mutual labels:  charts
Reactochart
📈 React chart component library 📉
Stars: ✭ 459 (-32.2%)
Mutual labels:  charts
Williamchart
Android Library to rapidly develop attractive and insightful charts in android applications.
Stars: ✭ 4,745 (+600.89%)
Mutual labels:  charts
Clip
Create charts from the command line
Stars: ✭ 5,111 (+654.95%)
Mutual labels:  charts
Charts
Helm charts for applications you run at home
Stars: ✭ 421 (-37.81%)
Mutual labels:  charts
Chartkick
Create beautiful JavaScript charts with one line of Ruby
Stars: ✭ 5,903 (+771.94%)
Mutual labels:  charts
Awesome D3
A list of D3 libraries, plugins and utilities
Stars: ✭ 4,779 (+605.91%)
Mutual labels:  charts
Jhchart
Stars: ✭ 593 (-12.41%)
Mutual labels:  charts
Cutecharts.py
📉 Hand drawing style charts library for Python
Stars: ✭ 460 (-32.05%)
Mutual labels:  charts
Devextreme Angular
Angular UI and data visualization components
Stars: ✭ 497 (-26.59%)
Mutual labels:  charts
Lavacharts
Lavacharts is a graphing / charting library for PHP 5.4+ that wraps Google's Javascript Chart API.
Stars: ✭ 587 (-13.29%)
Mutual labels:  charts
Line Charts
A library for plotting line charts in SVG. Written in all Elm.
Stars: ✭ 445 (-34.27%)
Mutual labels:  charts
Jfreechart
A 2D chart library for Java applications (JavaFX, Swing or server-side).
Stars: ✭ 665 (-1.77%)
Mutual labels:  charts
Aachartcore
📈📊☕️☕️☕️An elegant modern declarative data visualization chart framework for Android. Extremely powerful, supports line, spline, area, areaspline, column, bar, pie, scatter, angular gauges, arearange, areasplinerange, columnrange, bubble, box plot, error bars, funnel, waterfall and polar chart types.极其精美而又强大的 Android 数据可视化图表框架,支持柱状图、条形图、折线图、曲线图、折线填充图、曲线填充图、气泡图、扇形图、环形图、散点图、雷达图、混合图等各种类型的多达几十种的信息图图表,完全满足工作所需.
Stars: ✭ 424 (-37.37%)
Mutual labels:  charts
G
A powerful rendering engine which providing Canvas and SVG draw for G2 & G6
Stars: ✭ 556 (-17.87%)
Mutual labels:  charts
Archarts
Lovely Augmented Reality Charts for iOS - Built with ARKit
Stars: ✭ 679 (+0.3%)
Mutual labels:  charts
Chartify
📊 📈 📉 React.js plugin for building charts using CSS
Stars: ✭ 671 (-0.89%)
Mutual labels:  charts
Keen Js
https://keen.io/ JavaScript SDKs. Track users and visualise the results. Demo http://keen.github.io/keen-dataviz.js/
Stars: ✭ 588 (-13.15%)
Mutual labels:  charts

License build ver

React.js wrapper for ApexCharts to build interactive visualizations in react.

Download and Installation

Installing via npm
npm install react-apexcharts apexcharts

Usage

import Chart from 'react-apexcharts'

To create a basic bar chart with minimal configuration, write as follows:

class App extends Component {
  constructor(props) {
    super(props);

    this.state = {
      options: {
        chart: {
          id: 'apexchart-example'
        },
        xaxis: {
          categories: [1991, 1992, 1993, 1994, 1995, 1996, 1997, 1998, 1999]
        }
      },
      series: [{
        name: 'series-1',
        data: [30, 40, 35, 50, 49, 60, 70, 91, 125]
      }]
    }
  }
  render() {
    return (
      <Chart options={this.state.options} series={this.state.series} type="bar" width={500} height={320} />
    )
  }
}

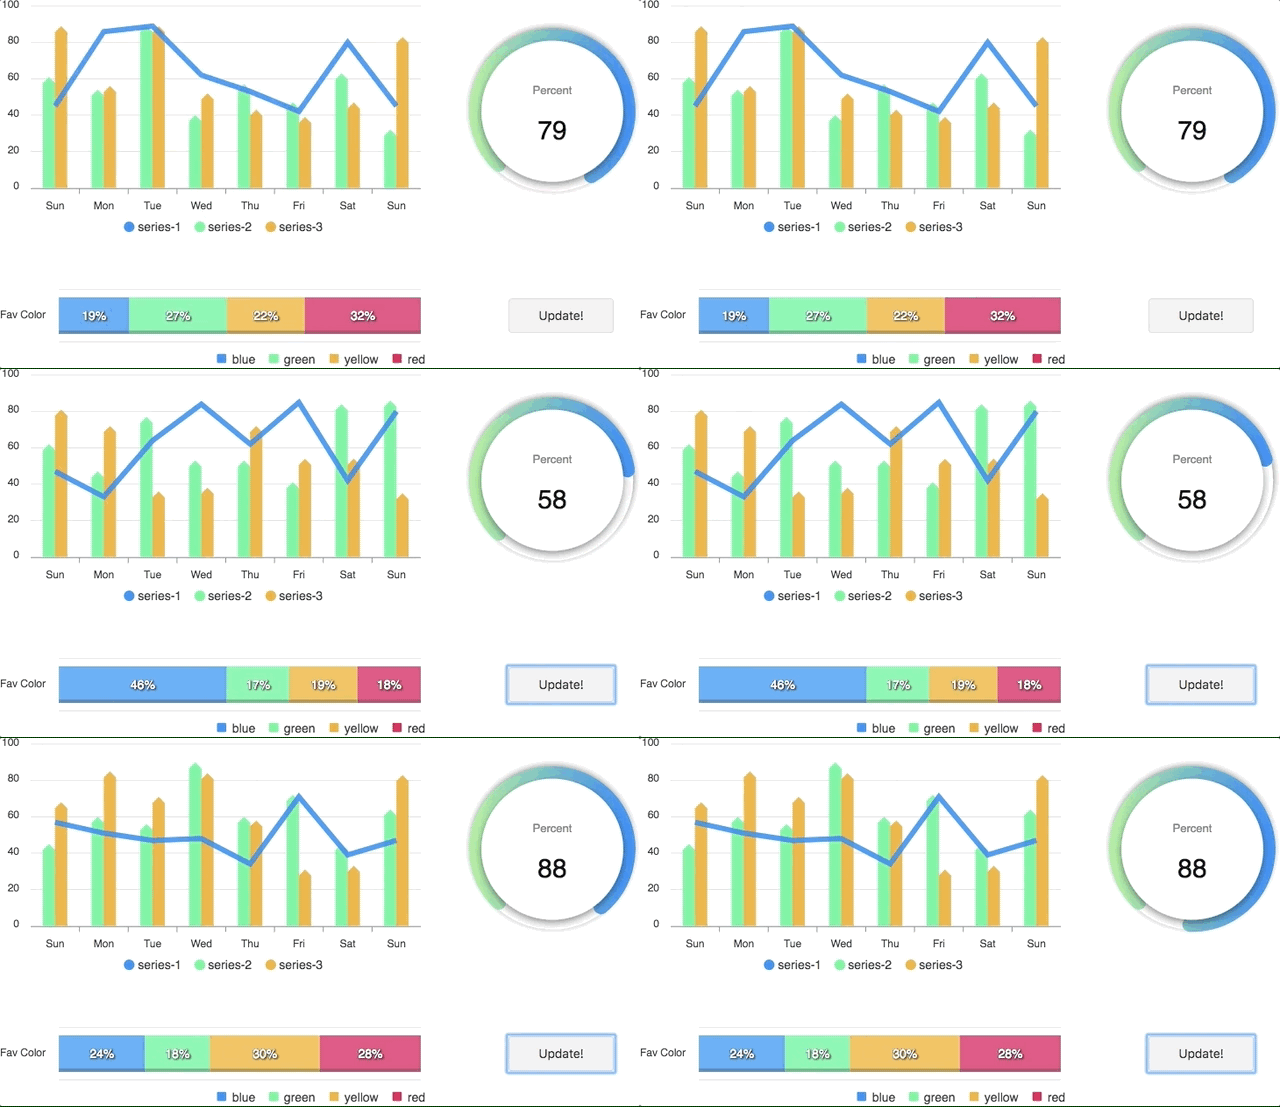
This will render the following chart

How do I update the chart?

Simple! Just change the series or any option and it will automatically re-render the chart.

View this example on codesandbox

Important: While updating the options, make sure to update the outermost property even when you need to update the nested property.

✅ Do this

this.setState({
  options: {
    ...this.state.options,
    xaxis: {
      ...this.state.options.xaxis,
      categories: ['X1', 'X2', 'X3']
    }
  }
})

❌ Not this

this.setState({
  options.xaxis.categories: ['X1', 'X2', 'X3']
})

Props

Prop Type Description
series Array The series is an array which accepts object in the following format. To know more about the format of dataSeries, checkout Series docs on the website.
type String line, area, bar, pie, donut, scatter, bubble, heatmap, radialBar
width Number/String Possible values for width can be 100% or 400px or 400
height Number/String Possible values for width can be 100% or 300px or 300
options Object The configuration object, see options on API (Reference)

How to call methods of ApexCharts programatically?

Sometimes, you may want to call other methods of the core ApexCharts library, and you can do so on ApexCharts global variable directly

Example

ApexCharts.exec('reactchart-example', 'updateSeries', [{
  data: [40, 55, 65, 11, 23, 44, 54, 33]
}])

More info on the .exec() method can be found here

All other methods of ApexCharts can be called this way

What's included

The repository includes the following files and directories.

react-apexcharts/
├── dist/
│   ├── react-apexcharts.min.js
│   └── react-apexcharts.js
└── example/
│   ├── src/
│   ├── public/
│   ├── package.json
│   └── README.md
└── src/
    └── react-apexcharts.jsx

Development

Install dependencies

npm install

Running the example

Basic example including update is included to show how to get started using ApexCharts with React easily.

To run the examples,

cd example
npm install
npm run start

Bundling

To build for Development
npm run dev-build
To build for Production
npm run build

License

React-ApexCharts is released under MIT license. You are free to use, modify and distribute this software, as long as the copyright header is left intact.

Note that the project description data, including the texts, logos, images, and/or trademarks, for each open source project belongs to its rightful owner. If you wish to add or remove any projects, please contact us at [email protected].