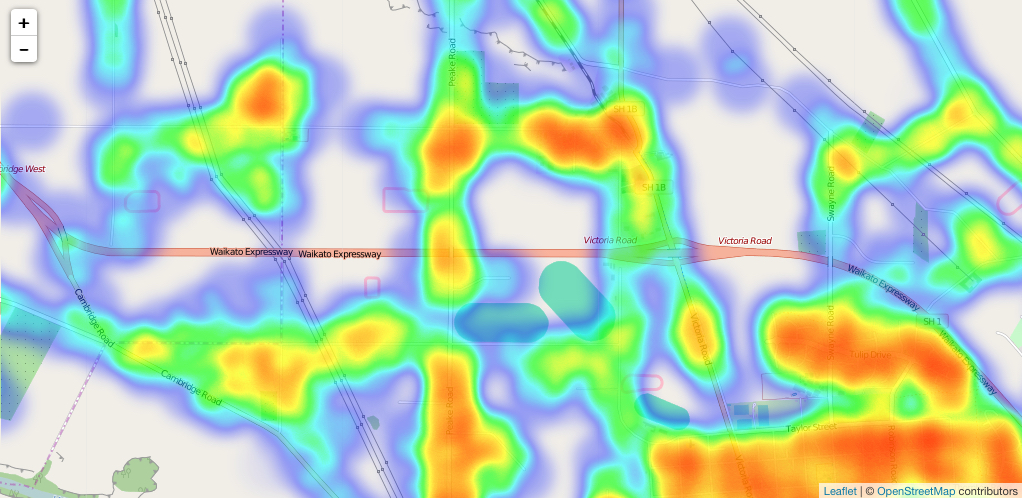
OpenGov / React Leaflet Heatmap Layer
Licence: mit
A custom layer for heatmaps in react-leaflet
Stars: ✭ 122
Programming Languages
javascript
184084 projects - #8 most used programming language
Projects that are alternatives of or similar to React Leaflet Heatmap Layer
leaflet heatmap
简单的可视化湖州通话数据 假设数据量很大,没法用浏览器直接绘制热力图,把绘制热力图这一步骤放到线下计算分析。使用Apache Spark并行计算数据之后,再使用Apache Spark绘制热力图,然后用leafletjs加载OpenStreetMap图层和热力图图层,以达到良好的交互效果。现在使用Apache Spark实现绘制,可能是Apache Spark不擅长这方面的计算或者是我没有设计好算法,并行计算的速度比不上单机计算。Apache Spark绘制热力图和计算代码在这 https://github.com/yuanzhaokang/ParallelizeHeatmap.git .
Stars: ✭ 13 (-89.34%)
Mutual labels: heatmap, leaflet
Heatmap.js
🔥 JavaScript Library for HTML5 canvas based heatmaps
Stars: ✭ 5,685 (+4559.84%)
Mutual labels: leaflet, heatmap
Leaflet.layergroup.collision
Leaflet plugin for uncluttering L.Markers using basic collision detection.
Stars: ✭ 82 (-32.79%)
Mutual labels: leaflet
Leaflet Elevation
Leaflet plugin that allows to add elevation profiles using d3js
Stars: ✭ 88 (-27.87%)
Mutual labels: leaflet
Academic Drawing
Providing codes (including Matlab and Python) for visualizing numerical experiment results.
Stars: ✭ 110 (-9.84%)
Mutual labels: heatmap
Calendarheatmap
A calendar based heatmap which presenting a time series of data points in colors.
Stars: ✭ 113 (-7.38%)
Mutual labels: heatmap
Flutter map marker cluster
Provides beautiful animated marker clustering functionality for flutter_map. Inspired by Leaflet.markercluster
Stars: ✭ 101 (-17.21%)
Mutual labels: leaflet
Wait4disney
Shanghai Disney Waiting Queue Statistics 上海迪士尼排队情况
Stars: ✭ 99 (-18.85%)
Mutual labels: heatmap
Webclient Javascript
MapGIS Client for JavaScript, is a cloud GIS network client development platform. It makes a perfect fusion of traditional WebGIS and cloud GIS; also integrates four mainstream map open source frameworks and visualization libraries such as Echarts, MapV, and D3, etc.. Therefore, highly-efficient visual expression and analysis of big data and real-time streaming data have been further enhanced.
Stars: ✭ 88 (-27.87%)
Mutual labels: leaflet
Btrfs Heatmap
Visualize the layout of data on your btrfs filesystem over time
Stars: ✭ 110 (-9.84%)
Mutual labels: heatmap
Leaflet Providers
An extension to Leaflet that contains configurations for various free tile providers.
Stars: ✭ 1,603 (+1213.93%)
Mutual labels: leaflet
Pinpoint
JavaScript library for creating beautifully simple maps in seconds
Stars: ✭ 83 (-31.97%)
Mutual labels: leaflet
Leaflet.browser.print
A leaflet plugin which allows users to print the map directly from the browser
Stars: ✭ 94 (-22.95%)
Mutual labels: leaflet
Readsb
Readsb is a Mode-S/ADSB/TIS decoder for RTLSDR, BladeRF, Modes-Beast and GNS5894 devices.
Stars: ✭ 91 (-25.41%)
Mutual labels: leaflet
Physt
Python histogram library - histograms as updateable, fully semantic objects with visualization tools. [P]ython [HYST]ograms.
Stars: ✭ 107 (-12.3%)
Mutual labels: heatmap
react-leaflet-heatmap-layer
react-leaflet-heatmap-layer provides a simple <HeatmapLayer /> component for creating a heatmap layer in a react-leaflet map.
Usage
Use directly as a fixed layer:
import React from 'react';
import { render } from 'react-dom';
import { Map, Marker, Popup, TileLayer } from 'react-leaflet';
import HeatmapLayer from '../src/HeatmapLayer';
import { addressPoints } from './realworld.10000.js';
class MapExample extends React.Component {
render() {
return (
<div>
<Map center={[0,0]} zoom={13}>
<HeatmapLayer
fitBoundsOnLoad
fitBoundsOnUpdate
points={addressPoints}
longitudeExtractor={m => m[1]}
latitudeExtractor={m => m[0]}
intensityExtractor={m => parseFloat(m[2])} />
<TileLayer
url='http://{s}.tile.osm.org/{z}/{x}/{y}.png'
attribution='© <a href="http://osm.org/copyright">OpenStreetMap</a> contributors'
/>
</Map>
</div>
);
}
}
render(<MapExample />, document.getElementById('app'));
Or use it inside a layer control to toggle it:
import React from 'react';
import { render } from 'react-dom';
import { Map, Marker, Popup, TileLayer } from 'react-leaflet';
import HeatmapLayer from '../src/HeatmapLayer';
import { addressPoints } from './realworld.10000.js';
class MapExample extends React.Component {
render() {
return (
<div>
<Map center={position} zoom={13} style={{ height: '100%' }} >
<LayersControl>
<LayersControl.BaseLayer name="Base" checked>
<TileLayer
url="http://{s}.tile.osm.org/{z}/{x}/{y}.png"
attribution="© <a href=http://osm.org/copyright>OpenStreetMap</a> contributors"
/>
</LayersControl.BaseLayer>
<LayersControl.Overlay name="Heatmap" checked>
<FeatureGroup color="purple">
<Marker position={[50.05, -0.09]} >
<Popup>
<span>A pretty CSS3 popup.<br /> Easily customizable. </span>
</Popup>
</Marker>
<HeatmapLayer
fitBoundsOnLoad
fitBoundsOnUpdate
points={addressPoints}
longitudeExtractor={m => m[1]}
latitudeExtractor={m => m[0]}
intensityExtractor={m => parseFloat(m[2])}
/>
</FeatureGroup>
</LayersControl.Overlay>
<LayersControl.Overlay name="Marker">
<FeatureGroup color="purple">
<Marker position={position} >
<Popup>
<span>A pretty CSS3 popup.<br /> Easily customizable. </span>
</Popup>
</Marker>
</FeatureGroup>
</LayersControl.Overlay>
</LayersControl>
</Map>
</div>
);
}
}
render(<MapExample />, document.getElementById('app'));
API
The HeatmapLayer component takes the following props:
-
points: required an array of objects to be processed -
longitudeExtractor: required a function that returns the object's longitude e.g.marker => marker.lng -
latitudeExtractor: required a function that returns the object's latitude e.g.marker => marker.lat -
intensityExtractor: required a function that returns the object's intensity e.g.marker => marker.val -
fitBoundsOnLoad: boolean indicating whether map should fit data in bounds of map on load -
fitBoundsOnUpdate: boolean indicating whether map should fit data in bounds of map on Update -
max: max intensity value for heatmap (default: 3.0) -
radius: radius for heatmap points (default: 30) -
maxZoom: maximum zoom for heatmap (default: 18) -
minOpacity: minimum opacity for heatmap (default: 0.01) -
blur: blur for heatmap points (default: 15) -
gradient: object defining gradient stop points for heatmap e.g.{ 0.4: 'blue', 0.8: 'orange', 1.0: 'red' }(default:simpleheatpackage default gradient) -
onStatsUpdate: called on redraw with a { min, max } object containing the min and max number of items found for a single coordinate
Example
To try the example:
- Clone this repository
- run
npm installin the root of your cloned repository - run
npm run example - Visit localhost:8000
Contributing
See CONTRIBUTING.md
Credits
This package was inspired by Leaflet.heat.
License
react-leaflet-heatmap-layer is MIT licensed.
See LICENSE.md for details.
Note that the project description data, including the texts, logos, images, and/or trademarks,
for each open source project belongs to its rightful owner.
If you wish to add or remove any projects, please contact us at [email protected].

