Raruto / Leaflet Elevation
Licence: gpl-3.0
Leaflet plugin that allows to add elevation profiles using d3js
Stars: ✭ 88
Programming Languages
javascript
184084 projects - #8 most used programming language
Projects that are alternatives of or similar to Leaflet Elevation
vaguely-rude-places
The map of Vaguely Rude Place Names
Stars: ✭ 19 (-78.41%)
Mutual labels: geojson, leaflet
Kepler
The open source full-stack geosocial network platform
Stars: ✭ 125 (+42.05%)
Mutual labels: geojson, leaflet
R Community Explorer
Data-Driven Exploration of the R Community
Stars: ✭ 43 (-51.14%)
Mutual labels: leaflet, d3js
Leaflet.timeline
Display arbitrary GeoJSON on a map with a timeline slider and play button
Stars: ✭ 291 (+230.68%)
Mutual labels: geojson, leaflet
leaflet-geojson-selector
Show GeoJSON Layer like as Interactive Menu List
Stars: ✭ 88 (+0%)
Mutual labels: geojson, leaflet
Mapstore2
Modern webmapping with OpenLayers, Leaflet and React
Stars: ✭ 251 (+185.23%)
Mutual labels: geojson, leaflet
leaflet heatmap
简单的可视化湖州通话数据 假设数据量很大,没法用浏览器直接绘制热力图,把绘制热力图这一步骤放到线下计算分析。使用Apache Spark并行计算数据之后,再使用Apache Spark绘制热力图,然后用leafletjs加载OpenStreetMap图层和热力图图层,以达到良好的交互效果。现在使用Apache Spark实现绘制,可能是Apache Spark不擅长这方面的计算或者是我没有设计好算法,并行计算的速度比不上单机计算。Apache Spark绘制热力图和计算代码在这 https://github.com/yuanzhaokang/ParallelizeHeatmap.git .
Stars: ✭ 13 (-85.23%)
Mutual labels: leaflet, d3js
Leaflet.vectorgrid
Display gridded vector data (sliced GeoJSON or protobuf vector tiles) in Leaflet 1.0.0
Stars: ✭ 436 (+395.45%)
Mutual labels: geojson, leaflet
Leaflet Geoman
🍂🗺️ The most powerful leaflet plugin for drawing and editing geometry layers
Stars: ✭ 1,088 (+1136.36%)
Mutual labels: geojson, leaflet
Leaflet.path.drag
Drag functionality for Leaflet vector layers
Stars: ✭ 72 (-18.18%)
Mutual labels: leaflet
Nivo
nivo provides a rich set of dataviz components, built on top of the awesome d3 and React libraries
Stars: ✭ 9,550 (+10752.27%)
Mutual labels: d3js
Dex
Dex : The Data Explorer -- A data visualization tool written in Java/Groovy/JavaFX capable of powerful ETL and publishing web visualizations.
Stars: ✭ 1,238 (+1306.82%)
Mutual labels: d3js
Leaflet.layergroup.collision
Leaflet plugin for uncluttering L.Markers using basic collision detection.
Stars: ✭ 82 (-6.82%)
Mutual labels: leaflet
Geojson Geometries Lookup
⚡️ Fast geometry in geometry lookup for large GeoJSONs.
Stars: ✭ 68 (-22.73%)
Mutual labels: geojson
Mongoose Geojson Schema
Schema definitions for GeoJSON types for use with Mongoose JS
Stars: ✭ 66 (-25%)
Mutual labels: geojson
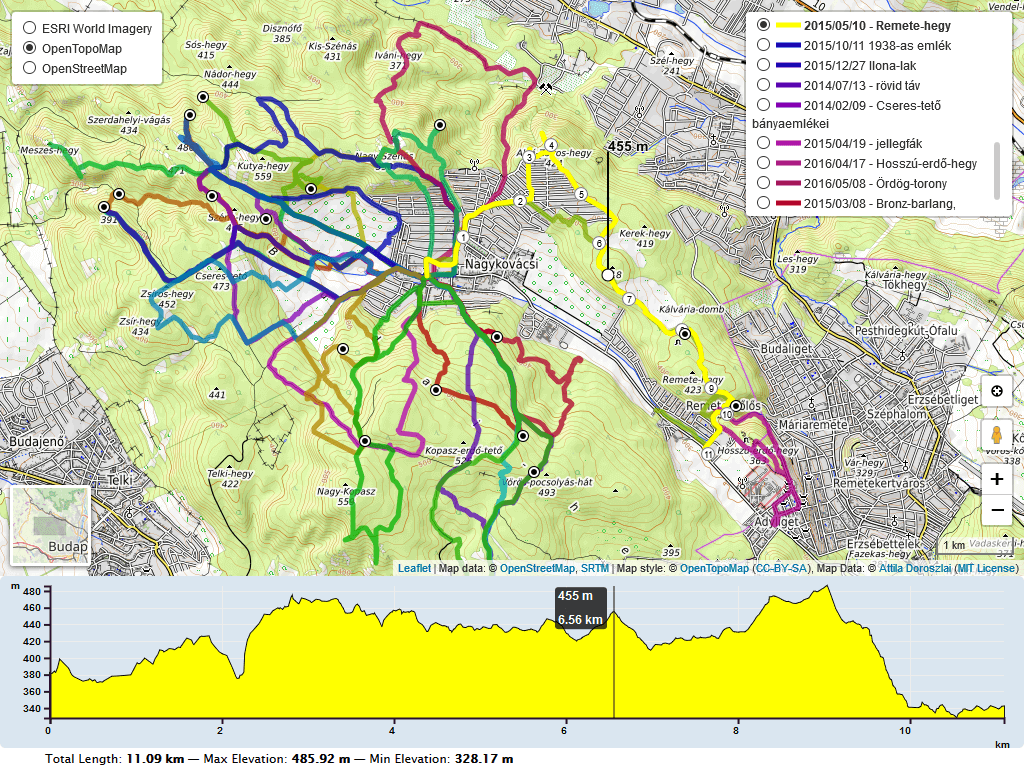
leaflet-elevation.js

![]()
A Leaflet plugin that allows to add elevation profiles using d3js
For a working example see one of the following demos:
- loading .gpx file
- loading .geojson file
- loading .kml file
- loading .tcx file
- loading strings
- loading geojson group
- loading local .gpx file
- hoverable chart / hidden map
- hoverable chart / hidden chart
- hoverable tracks
- toggable tracks
- toggable charts
Initially based on the work of Felix “MrMufflon” Bache
How to use
-
include CSS & JavaScript
<head>
...
<style> html, body, #map, #elevation-div { height: 100%; width: 100%; padding: 0; margin: 0; } #map { height: 75%; } #elevation-div {	height: 25%; font: 12px/1.5 "Helvetica Neue", Arial, Helvetica, sans-serif; } </style>

<!-- leaflet-ui -->
<script src="https://unpkg.com/[email protected]/dist/leaflet.js"></script>
<script src="https://unpkg.com/[email protected]/dist/leaflet-ui.js"></script>

<!-- leaflet-elevation -->
<link rel="stylesheet" href="https://unpkg.com/@raruto/leaflet-elevation/dist/leaflet-elevation.css" />
<script src="https://unpkg.com/@raruto/leaflet-elevation/dist/leaflet-elevation.js"></script>
...
</head>
-
choose the div container used for the slippy map
<body>
...
<div id="map"></div>
...
</body>
-
create your first simple “leaflet-elevation” slippy map
<script>
  // Full list options at "leaflet-elevation.js"
  var elevation_options = {

    // Default chart colors: theme lime-theme, magenta-theme, ...
    theme: "lightblue-theme",

    // Chart container outside/inside map container
    detached: true,

    // if (detached), the elevation chart container
    elevationDiv: "#elevation-div",

    // if (!detached) autohide chart profile on chart mouseleave
    autohide: false,

    // if (!detached) initial state of chart profile control
    collapsed: false,

    // if (!detached) control position on one of map corners
    position: "topright",

    // Autoupdate map center on chart mouseover.
    followMarker: true,

    // Autoupdate map bounds on chart update.
    autofitBounds: true,

    // Chart distance/elevation units.
    imperial: false,

    // [Lat, Long] vs [Long, Lat] points. (leaflet default: [Lat, Long])
    reverseCoords: false,

    // Acceleration chart profile: true || "summary" || "disabled" || false
    acceleration: false,

    // Slope chart profile: true || "summary" || "disabled" || false
    slope: false,

    // Speed chart profile: true || "summary" || "disabled" || false
    speed: false,

    // Display time info: true || "summary" || false
    time: false,

    // Display distance info: true || "summary"
    distance: true,

    // Display altitude info: true || "summary"
    altitude: true,

    // Summary track info style: "line" || "multiline" || false
    summary: 'multiline',

    // Toggle chart ruler filter.
    ruler: true,

    // Toggle chart legend filter.
    legend: true,

    // Toggle "leaflet-almostover" integration
    almostOver: true,

    // Toggle "leaflet-distance-markers" integration
    distanceMarkers: false,

    // Render chart profiles as Canvas or SVG Paths
    preferCanvas: true

  };

  // Instantiate map (leaflet-ui).
  var map = new L.Map('map', { mapTypeId: 'terrain', center: [41.4583, 12.7059], zoom: 5 });

  // Instantiate elevation control.
  var controlElevation = L.control.elevation(elevation_options).addTo(map);

  // Load track from url (allowed data types: "*.geojson", "*.gpx", "*.tcx")
  controlElevation.load("https://raruto.github.io/leaflet-elevation/examples/via-emilia.gpx");

</script>
Related: Leaflet-UI presets, QGIS Integration
Compatibile with:
![]()
![]()
![]()
Contributors: MrMufflon, HostedDinner, ADoroszlai, Raruto
Note that the project description data, including the texts, logos, images, and/or trademarks,
for each open source project belongs to its rightful owner.
If you wish to add or remove any projects, please contact us at [email protected].