VegaliteR ggplot2 "bindings" for Vega-Lite
Stars: ✭ 157 (+265.12%)
Mutual labels: datavisualization
RedashMake Your Company Data Driven. Connect to any data source, easily visualize, dashboard and share your data.
Stars: ✭ 20,147 (+46753.49%)
Mutual labels: bi
PlotsOfDataShiny App for comparison of samples
Stars: ✭ 47 (+9.3%)
Mutual labels: datavisualization
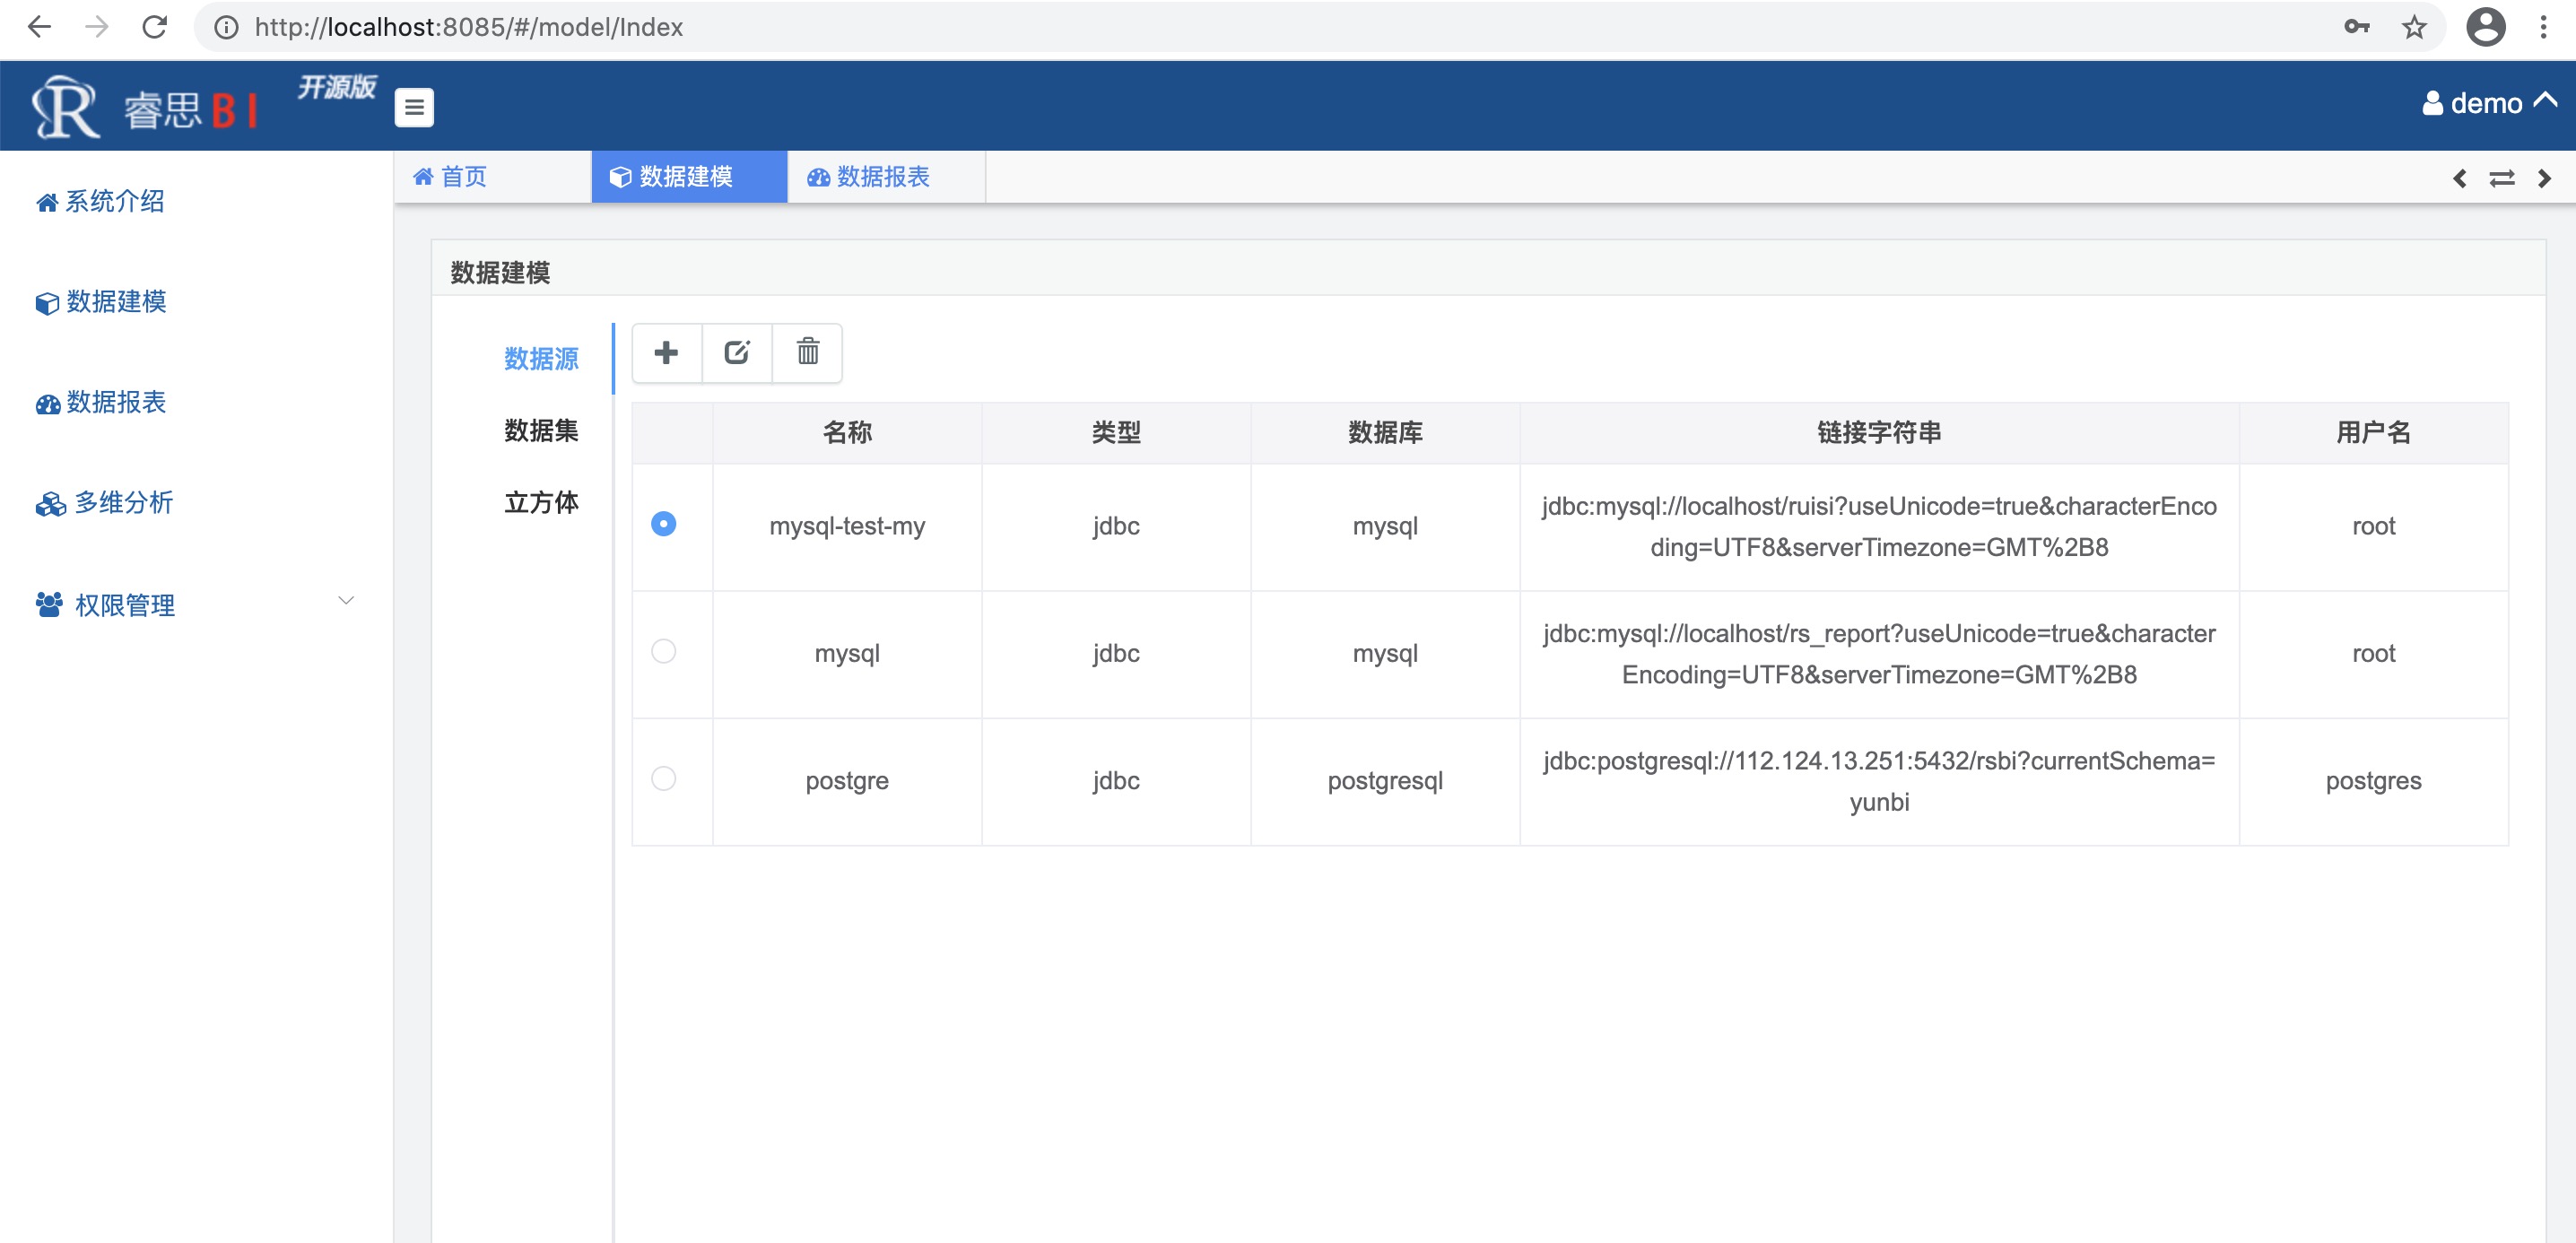
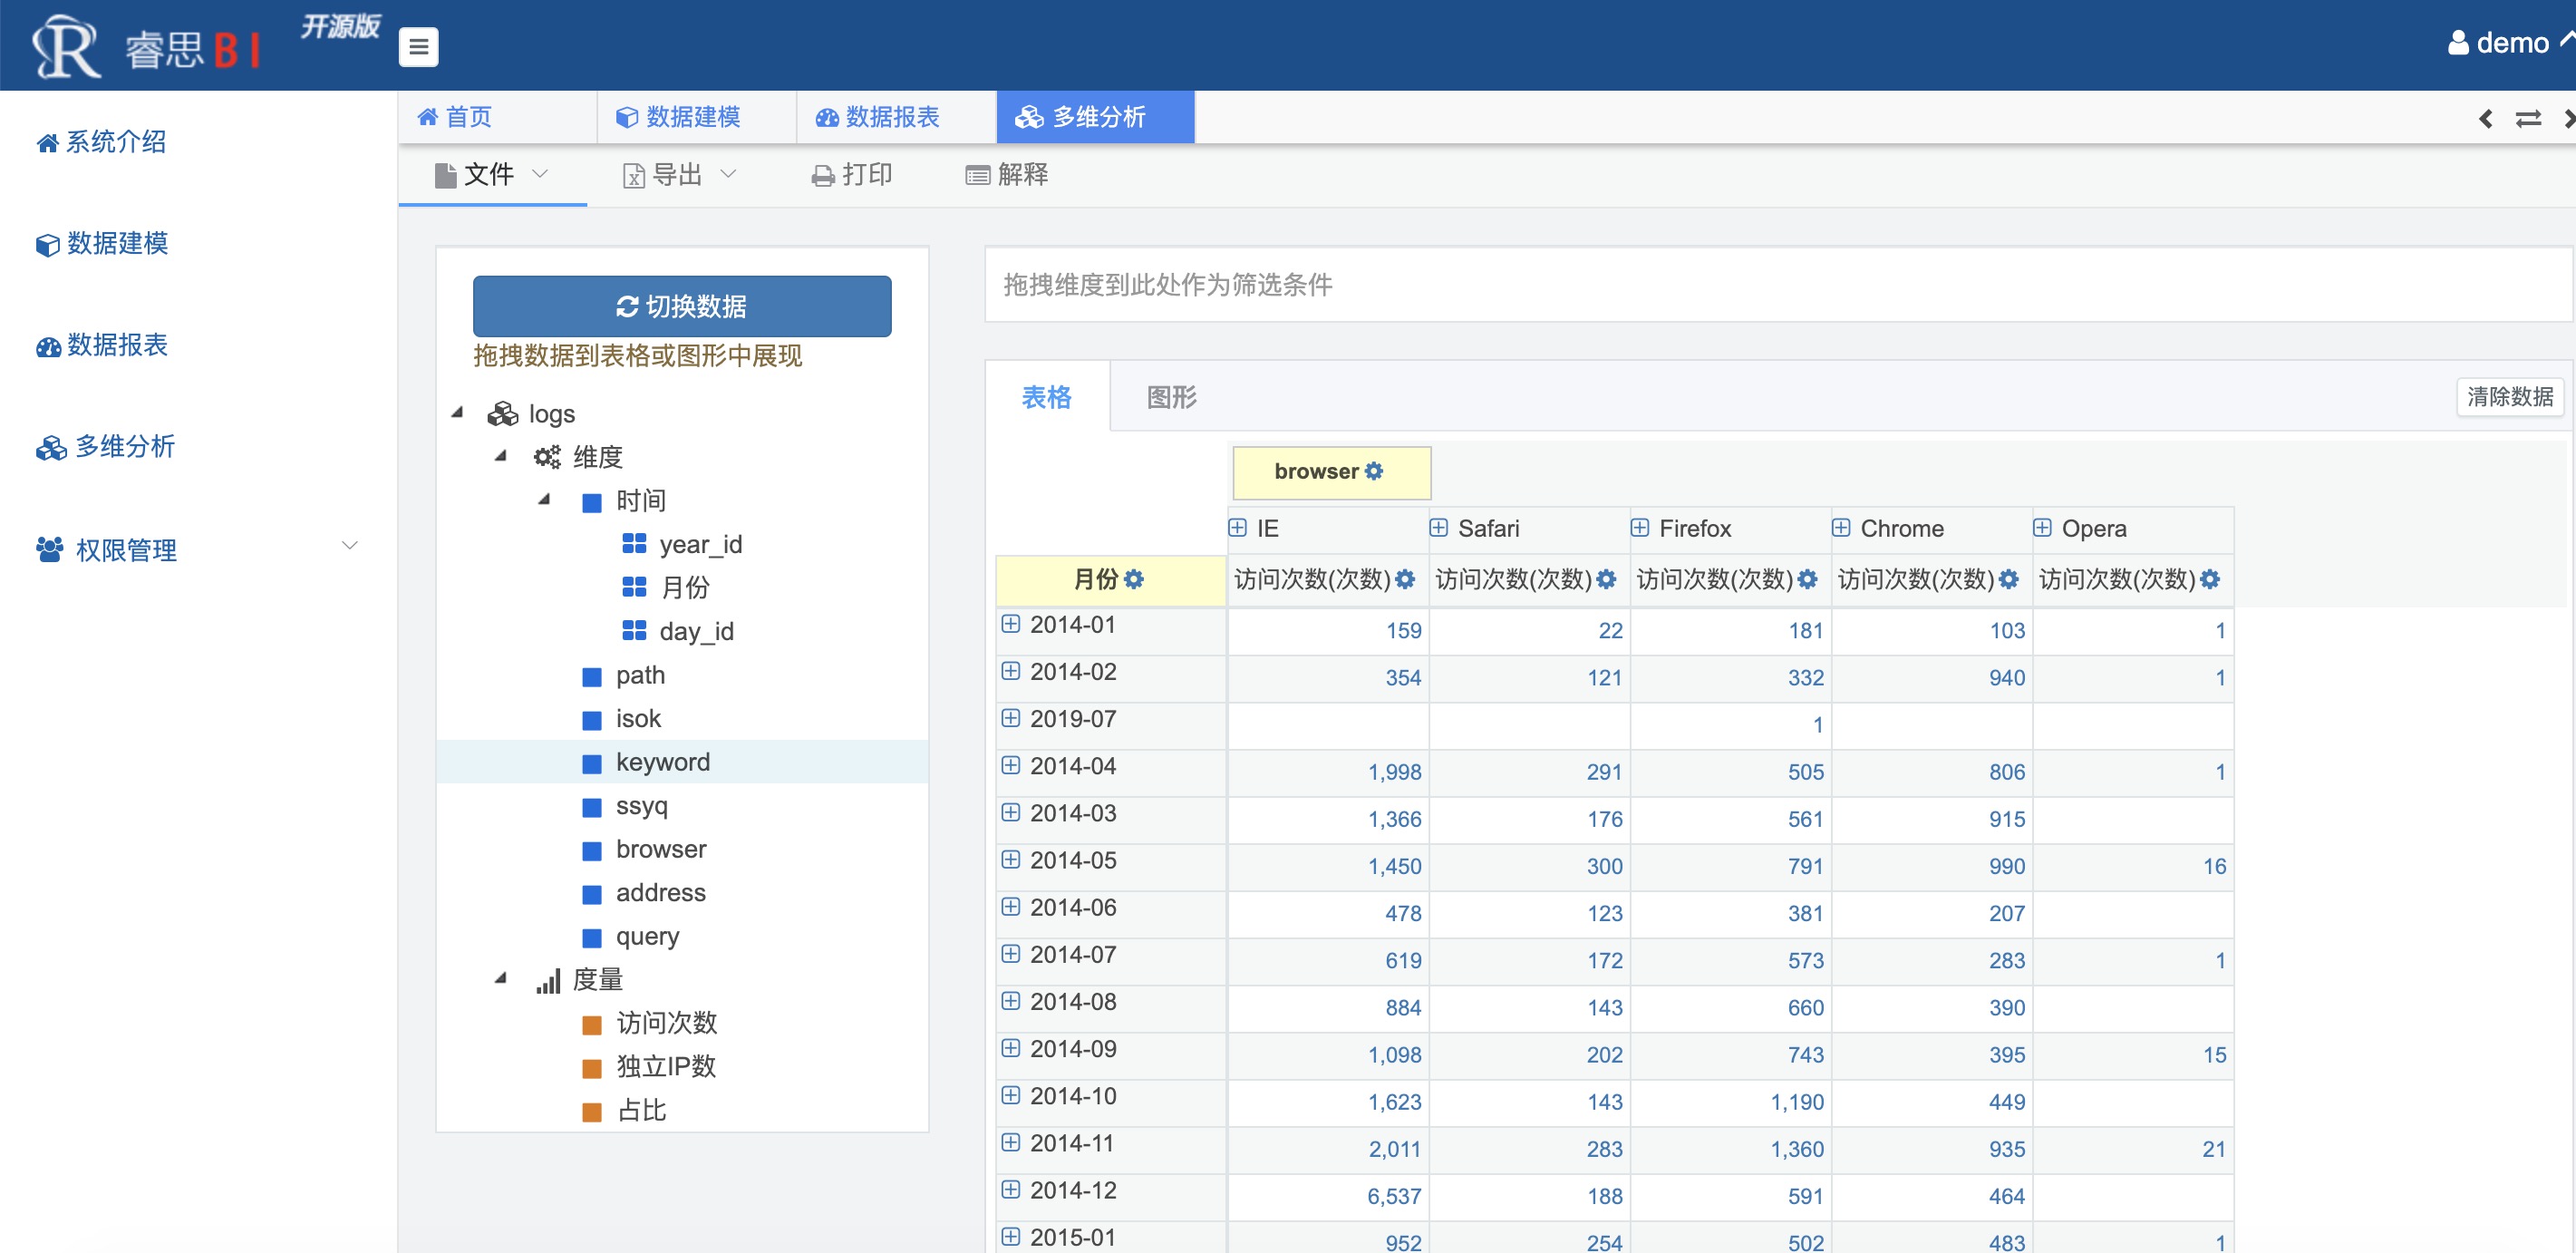
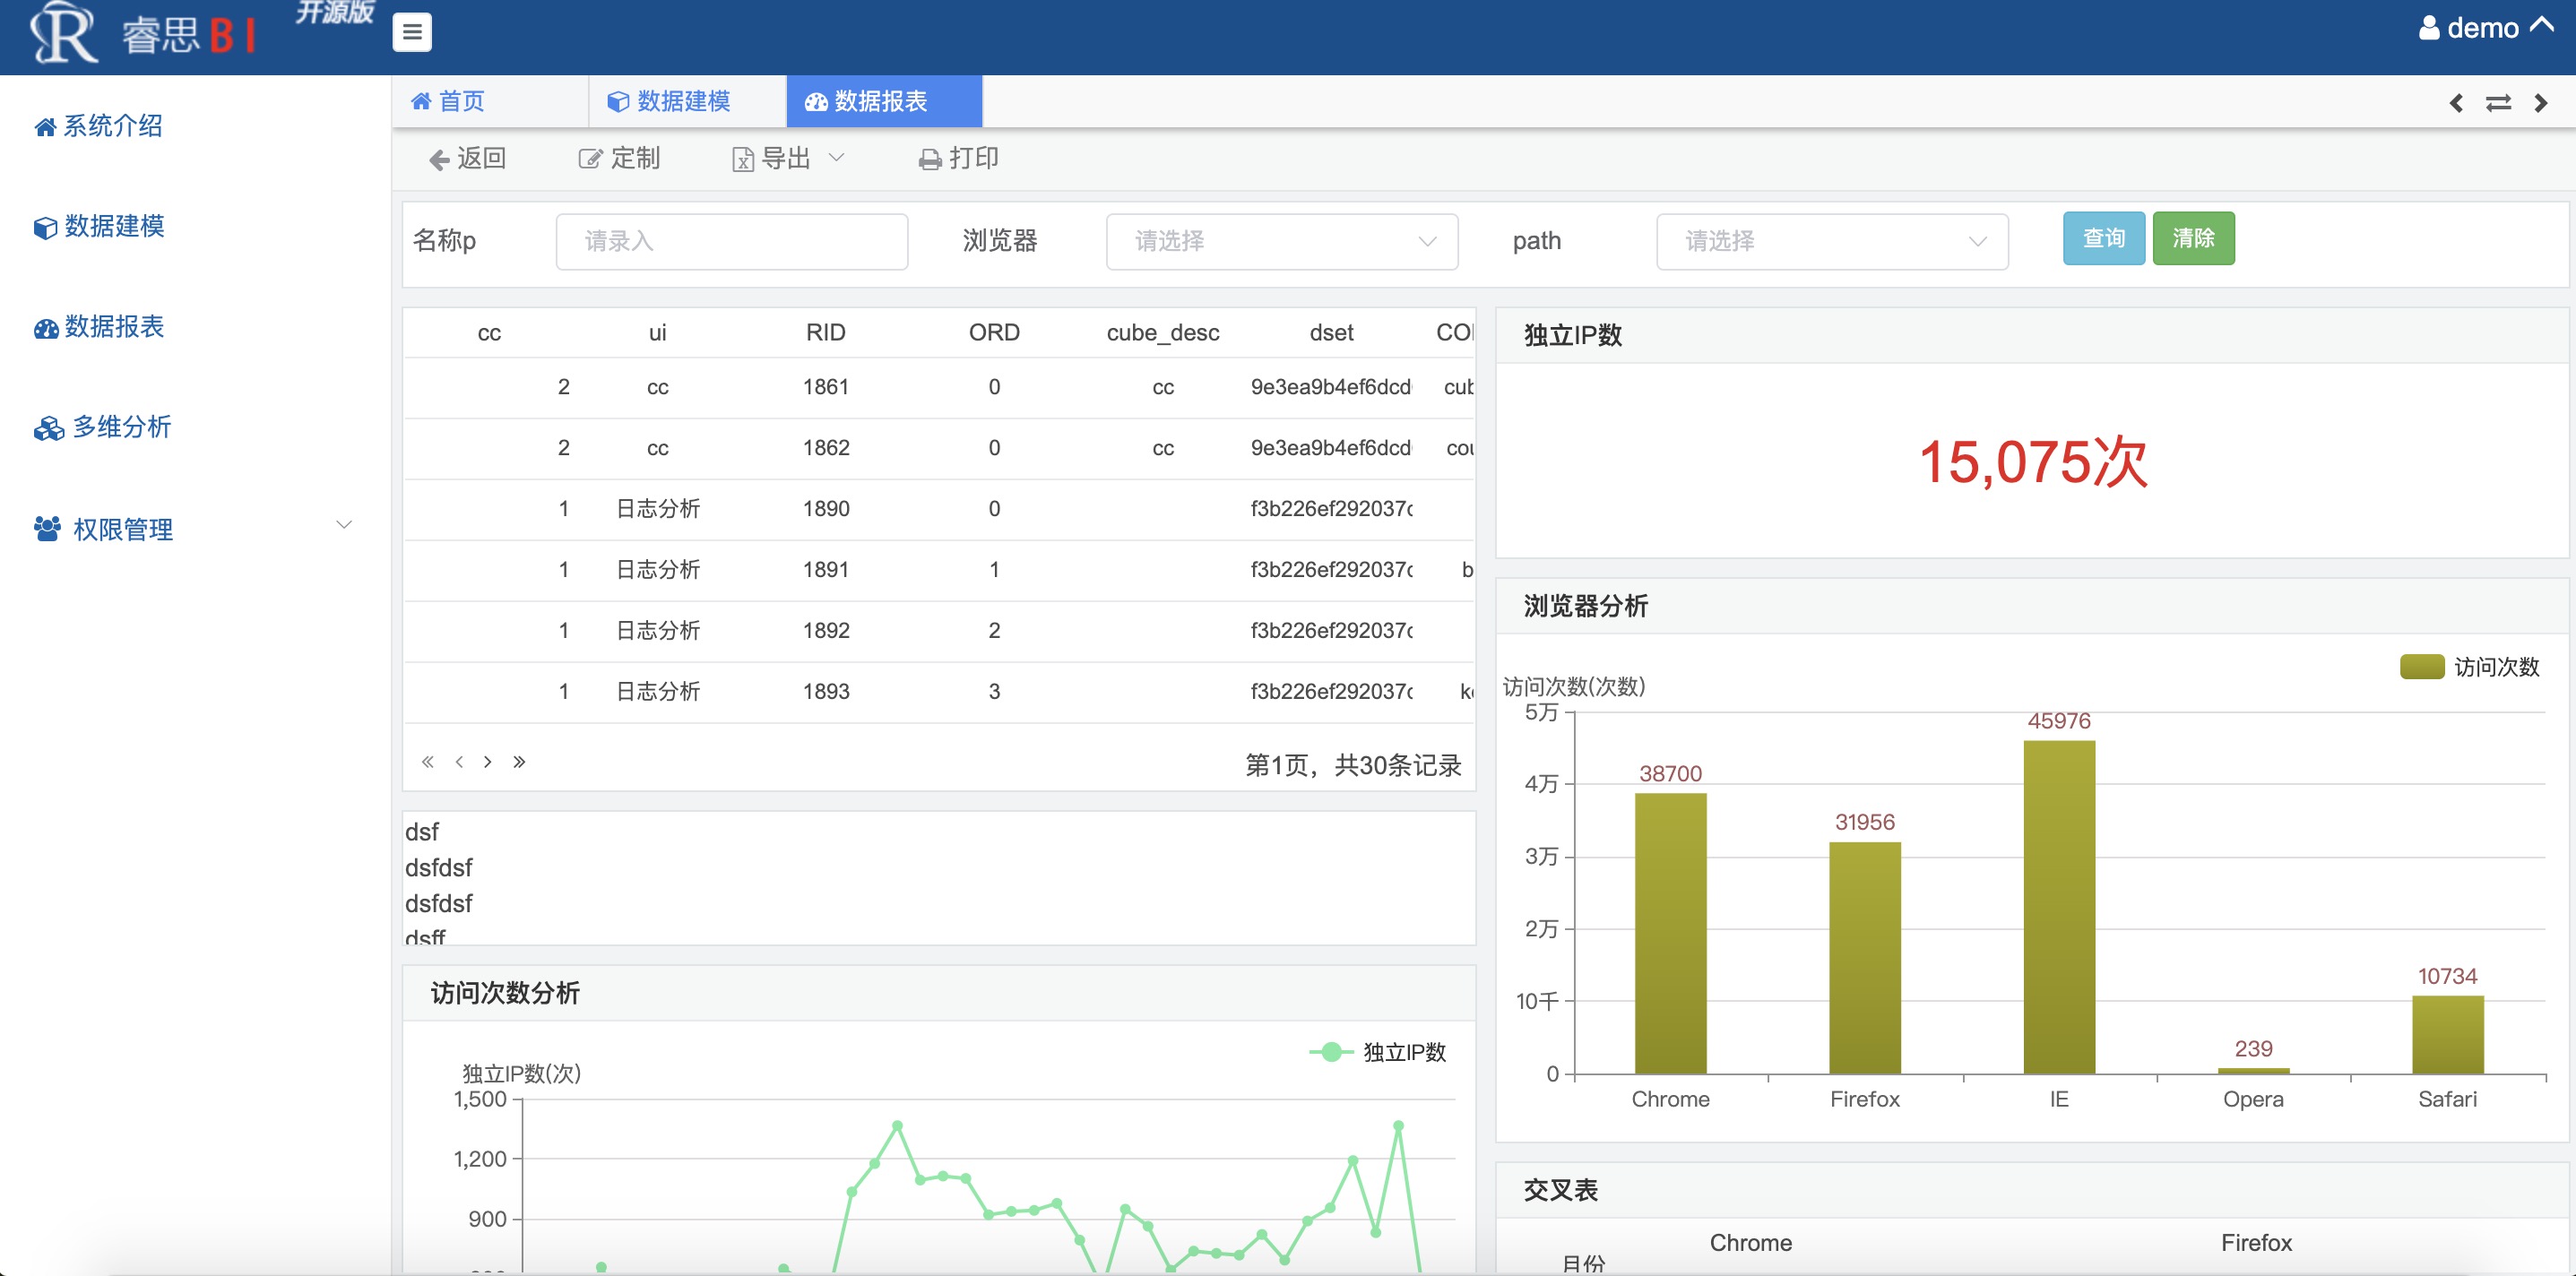
olap睿思BI-OLAP开源多维分析系统
Stars: ✭ 101 (+134.88%)
Mutual labels: bi
JimuReport「低代码可视化报表」类似excel操作风格,在线拖拽完成设计!功能涵盖: 报表设计、图形报表、打印设计、大屏设计等,完全免费!秉承“简单、易用、专业”的产品理念,极大的降低报表开发难度、缩短开发周期、解决各类报表难题。
Stars: ✭ 2,895 (+6632.56%)
Mutual labels: bi
MetabaseThe simplest, fastest way to get business intelligence and analytics to everyone in your company 😋
Stars: ✭ 26,803 (+62232.56%)
Mutual labels: bi
Timeline PlusTimeline - chronological visualization of your data
Stars: ✭ 140 (+225.58%)
Mutual labels: datavisualization
PySimpleGUILaunched in 2018. It's 2022 and PySimpleGUI is actively developed & supported. Create complex windows simply. Supports tkinter, Qt, WxPython, Remi (in browser). Create GUI applications trivially with a full set of widgets. Multi-Window applications are also simple. 3.4 to 3.11 supported. 325+ Demo programs & Cookbook for rapid start. Extensive d…
Stars: ✭ 10,846 (+25123.26%)
Mutual labels: datavisualization
PerspectiveA data visualization and analytics component, especially well-suited for large and/or streaming datasets.
Stars: ✭ 3,989 (+9176.74%)
Mutual labels: bi
FlowVizA Power BI template that provides easy to understand, actionable flow metrics and predictive analytics for your agile teams using Azure DevOps, Azure DevOps Server and/or TFS.
Stars: ✭ 150 (+248.84%)
Mutual labels: datavisualization
rsbi-vue睿思BI开源版-VUE版本,快速分析数据及可视化,0代码编写。
Stars: ✭ 50 (+16.28%)
Mutual labels: bi
seedseed自助报表展示系统
Stars: ✭ 63 (+46.51%)
Mutual labels: bi
SupersetApache Superset is a Data Visualization and Data Exploration Platform
Stars: ✭ 42,634 (+99048.84%)
Mutual labels: bi
V Chart PluginEasily bind a chart to the data stored in your Vue.js components.
Stars: ✭ 188 (+337.21%)
Mutual labels: datavisualization
panel-chemistry🧪📈 🐍. The purpose of the panel-chemistry project is to make it really easy for you to do DATA ANALYSIS and build powerful DATA AND VIZ APPLICATIONS within the domain of Chemistry using using Python and HoloViz Panel.
Stars: ✭ 94 (+118.6%)
Mutual labels: datavisualization
DatavVue数据可视化组件库(类似阿里DataV,大屏数据展示),提供SVG的边框及装饰、图表、水位图、飞线图等组件,简单易用,长期更新(React版已发布)
Stars: ✭ 5,916 (+13658.14%)
Mutual labels: bi
PlotTwistPlotTwist - a web app for plotting and annotating time-series data
Stars: ✭ 21 (-51.16%)
Mutual labels: datavisualization
datartDatart is a next generation Data Visualization Open Platform
Stars: ✭ 1,042 (+2323.26%)
Mutual labels: bi
WordCloudSharp☁️ Ported from http://wordcloud.codeplex.com/
Stars: ✭ 49 (+13.95%)
Mutual labels: datavisualization