All Projects β†’ nbrown02 β†’ FlowViz

nbrown02 / FlowViz

Licence: MIT license
A Power BI template that provides easy to understand, actionable flow metrics and predictive analytics for your agile teams using Azure DevOps, Azure DevOps Server and/or TFS.

Projects that are alternatives of or similar to FlowViz

rust-azure-devops
[No longer maintain] πŸ¦€ Rust extension for Azure DevOps
Stars: ✭ 26 (-82.67%)
Mutual labels:  vsts, vsts-extension, azure-devops, azure-devops-extension
azure-boards-estimate
Estimate - Planning Poker for Azure Boards
Stars: ✭ 62 (-58.67%)
Mutual labels:  vsts, azure-devops, azure-boards, azure-devops-extension
azure-flutter-tasks
Easily build and deploy with latest Flutter build tasks for Azure DevOps Pipelines Tasks
Stars: ✭ 66 (-56%)
Mutual labels:  vsts, vsts-extension, azure-devops
webpack-vsts-extension
Webpack build task for Visual Studio Team Services
Stars: ✭ 16 (-89.33%)
Mutual labels:  vsts, azure-devops, azure-devops-extension
Flask jsondash
🐍 πŸ“Š πŸ“ˆ Build complex dashboards without any front-end code. Use your own endpoints. JSON config only. Ready to go.
Stars: ✭ 3,215 (+2043.33%)
Mutual labels:  charts, dataviz
Carbon Charts
πŸ“Š πŸ“ˆβ €Robust dataviz framework implemented using D3 & typescript
Stars: ✭ 287 (+91.33%)
Mutual labels:  charts, dataviz
Layercake
graphics framework for sveltejs
Stars: ✭ 329 (+119.33%)
Mutual labels:  charts, dataviz
Keen Js
https://keen.io/ JavaScript SDKs. Track users and visualise the results. Demo http://keen.github.io/keen-dataviz.js/
Stars: ✭ 588 (+292%)
Mutual labels:  charts, dataviz
silky-charts
A silky smooth D3/React library
Stars: ✭ 38 (-74.67%)
Mutual labels:  charts, dataviz
React Jsx Highcharts
Highcharts built with proper React components
Stars: ✭ 336 (+124%)
Mutual labels:  charts, dataviz
Explorer
Data Explorer by Keen - point-and-click interface for analyzing and visualizing event data.
Stars: ✭ 725 (+383.33%)
Mutual labels:  charts, dataviz
React Chartjs 2
React components for Chart.js, the most popular charting library
Stars: ✭ 4,667 (+3011.33%)
Mutual labels:  charts, datavisualization
fusioncharts-dist
FusionCharts JavaScript Charting library. Over 95+ charts and 1,400+ maps to choose from, with integrations available for all popular JavaScript frameworks & back-end programming languages.
Stars: ✭ 65 (-56.67%)
Mutual labels:  charts, dataviz
awesome-power-bi
⭐️⭐️⭐️ Awesome Power BI dashboards, visuals, development resources, learning materials and more πŸ”₯πŸ”₯πŸ”₯
Stars: ✭ 61 (-59.33%)
Mutual labels:  power-bi, powerbi
proteic
Streaming and static data visualization for the modern web.
Stars: ✭ 37 (-75.33%)
Mutual labels:  charts, dataviz
Awesome D3
A list of D3 libraries, plugins and utilities
Stars: ✭ 4,779 (+3086%)
Mutual labels:  charts, datavisualization
React Fusioncharts Component
ReactJS component for FusionCharts JavaScript Charting library.
Stars: ✭ 73 (-51.33%)
Mutual labels:  charts, dataviz
Reaviz
πŸ“Š Data visualization library for React based on D3
Stars: ✭ 1,141 (+660.67%)
Mutual labels:  charts, dataviz
azure-pipelines-lighthouse
Embed Google Lighthouse HTML reports into Azure Pipelines
Stars: ✭ 37 (-75.33%)
Mutual labels:  azure-devops, azure-devops-extension
Covid Charts
A collection of JavaScript-based data visualization tools and data for depicting spread of the COVID-19
Stars: ✭ 88 (-41.33%)
Mutual labels:  charts, datavisualization

FlowViz - Metrics for teams using Azure DevOps

What is it?

This dashboard is for all Agile teams using Azure DevOps, Azure DevOps Server and/or TFS, who want to leverage their data to have better conversations and make more informed decisions. It was built due to years of frustration with 'velocity' and other traditional agile metrics. These are centered on flow, as well as providing forecasting techniques you can use to give customers greater confidence/transparency in your delivery.

Prerequisites

Connectivity

  • Open the .pbit file
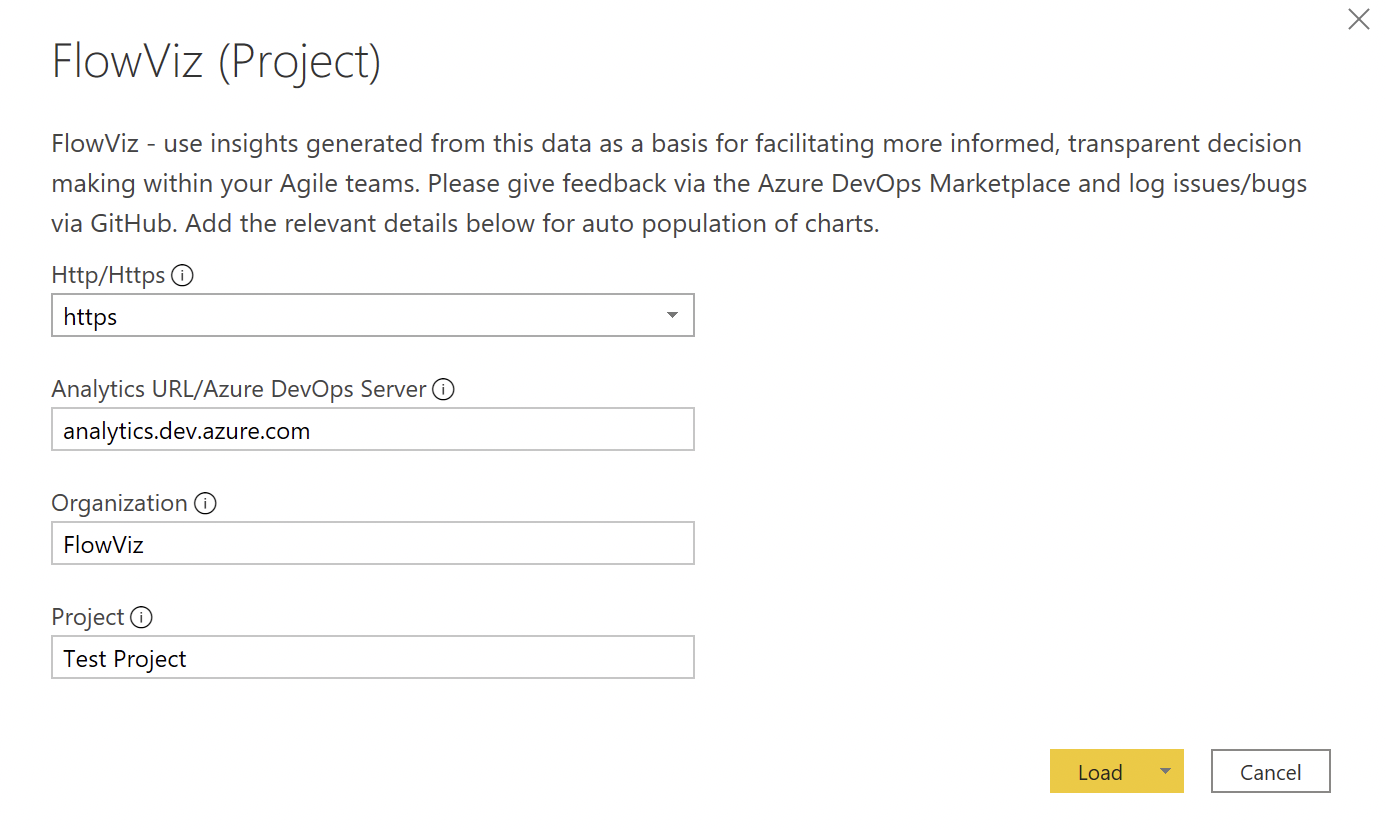
  • Select http/https (only choose http if your Azure DevOps Server is HTTP)
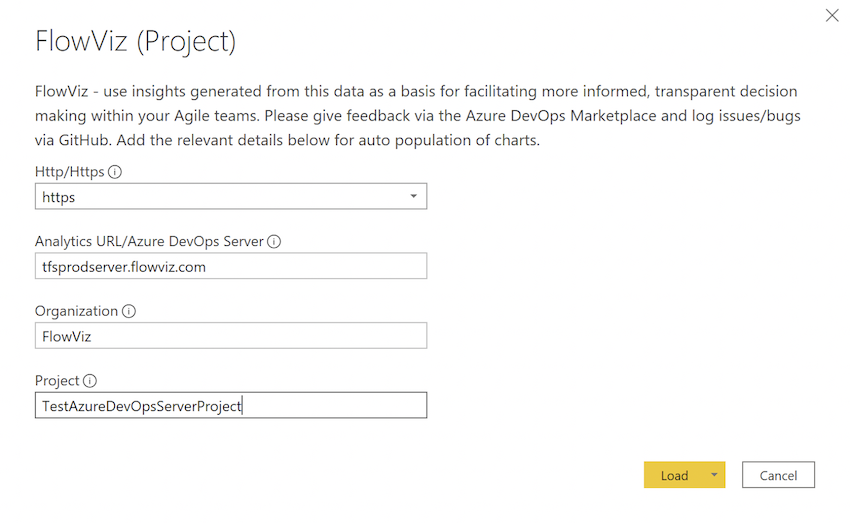
  • Add the Analytics / Azure DevOps Server URL - for Azure DevOps services enter 'analytics.dev.azure.com' / for Azure DevOps Server enter your server details
  • Add your organization and project name

Don't confuse the team name with the project name, a common mistake. If the URL you use is "http://dev.azure.com/Microsoft-UK/AzureDevOpsTeam/Database", then Microsoft-UK is the Organization Name, AzureDevOpsTeam is the Project name, Database is the team name.

  • It should then look something like this:

Azure DevOps Services: alt text

Azure DevOps Server: alt text

  • Hit 'Load'

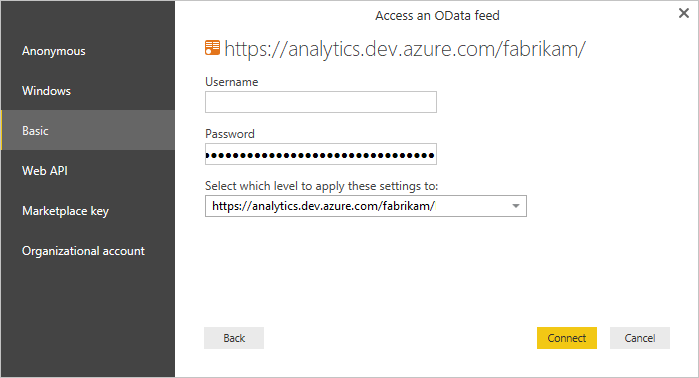
  • If you are prompted for a login, you can choose:

    • 'Organizational' and enter your Organization email/password (if required) and sign in
    • 'Basic' and use a Personal Access Token (PAT) to login, entering it in the password field (user can be left as blank - make sure it has 'Read' access to Analytics)

    alt text

  • Once signed in hit 'Load' and wait for your charts to populate!

What do these charts mean? How can I learn more?

There is a FlowViz Fundamentals course now available - use the code LAUNCH20 for a 20% discount

For questions on charts, how to use them and other questions check out the Wiki.

If you want to embed these charts into Azure DevOps, check out this brilliant blog for guidance.
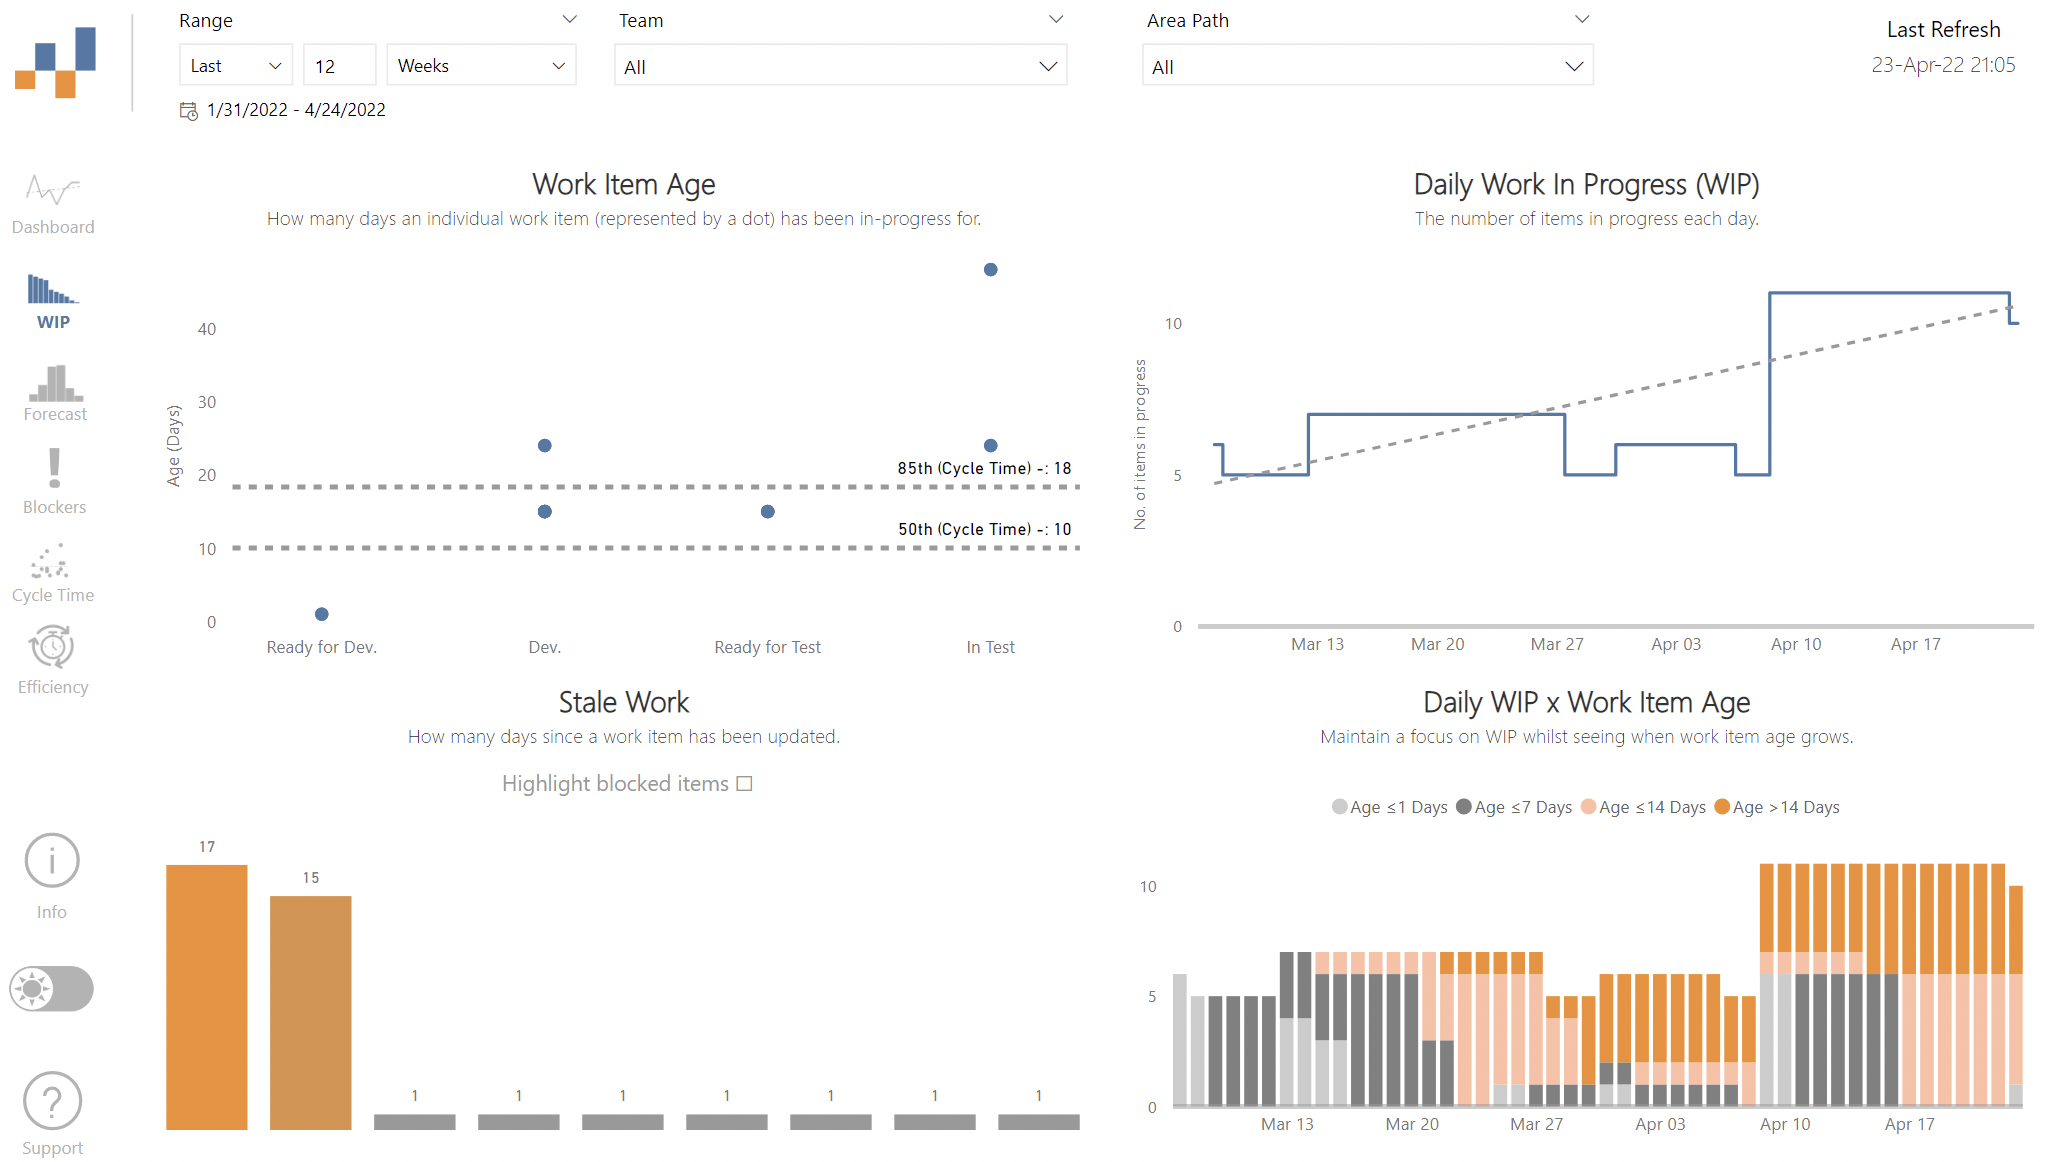
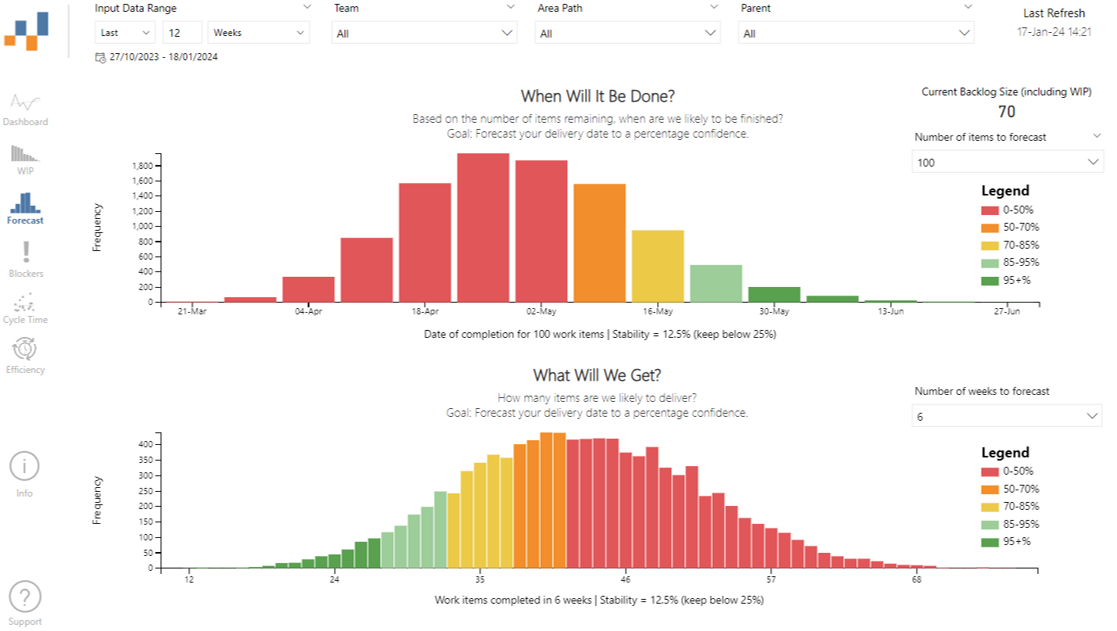
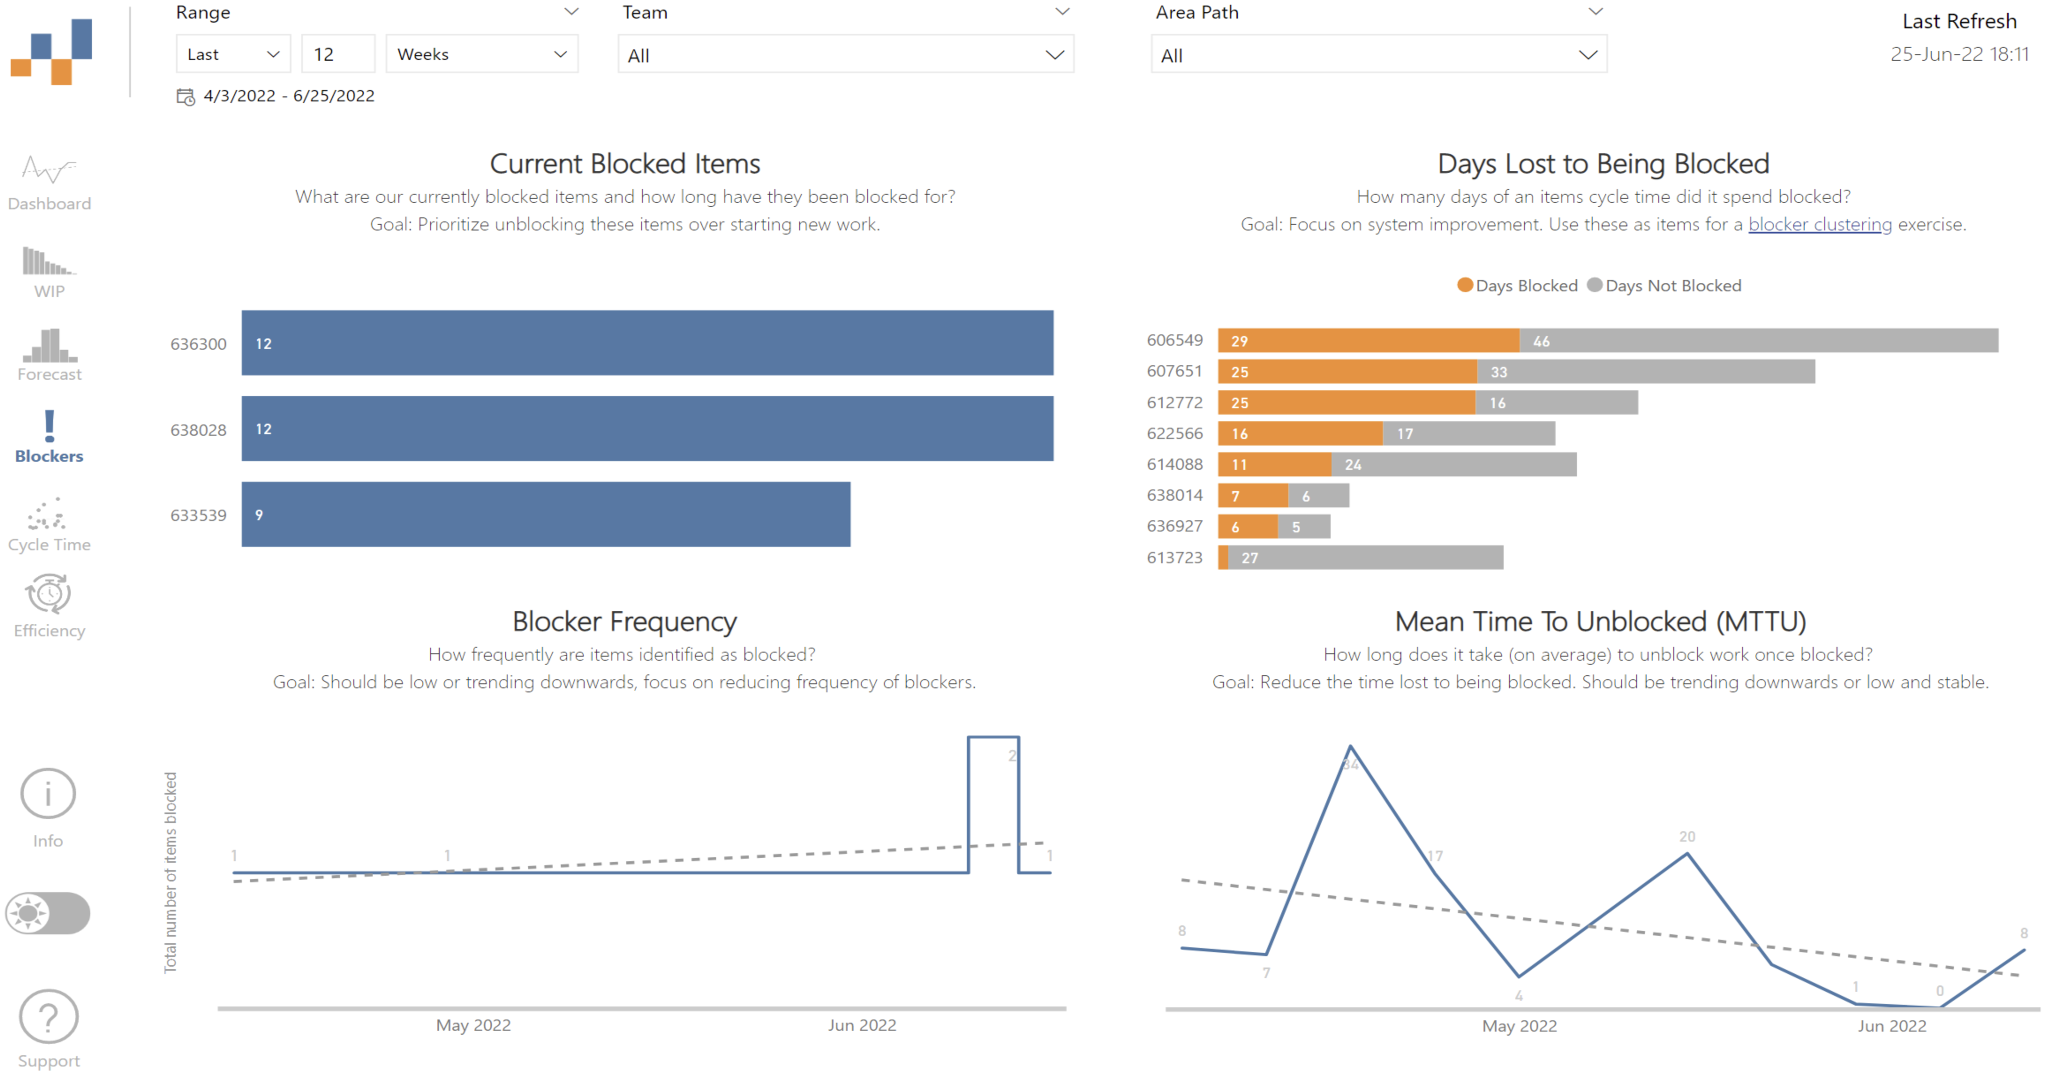
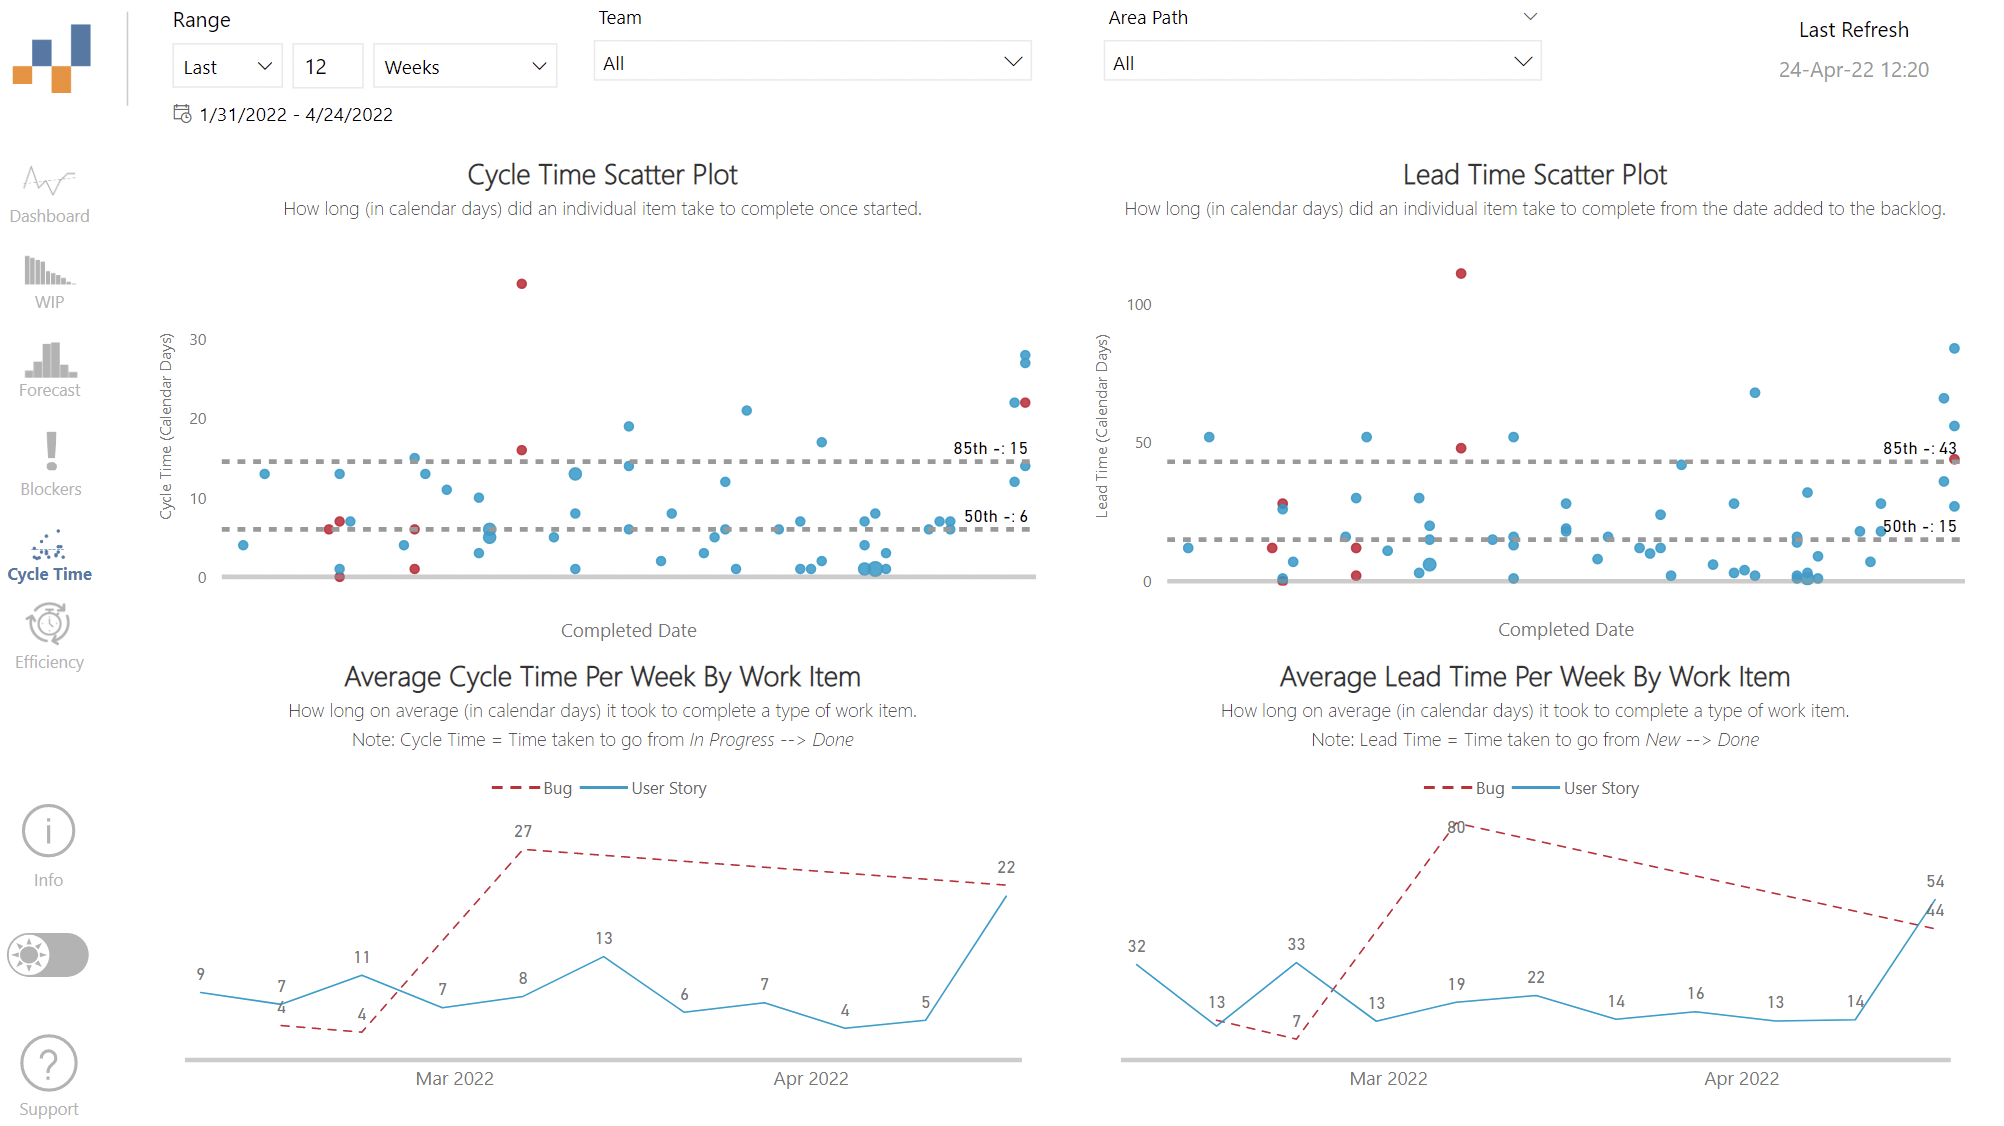
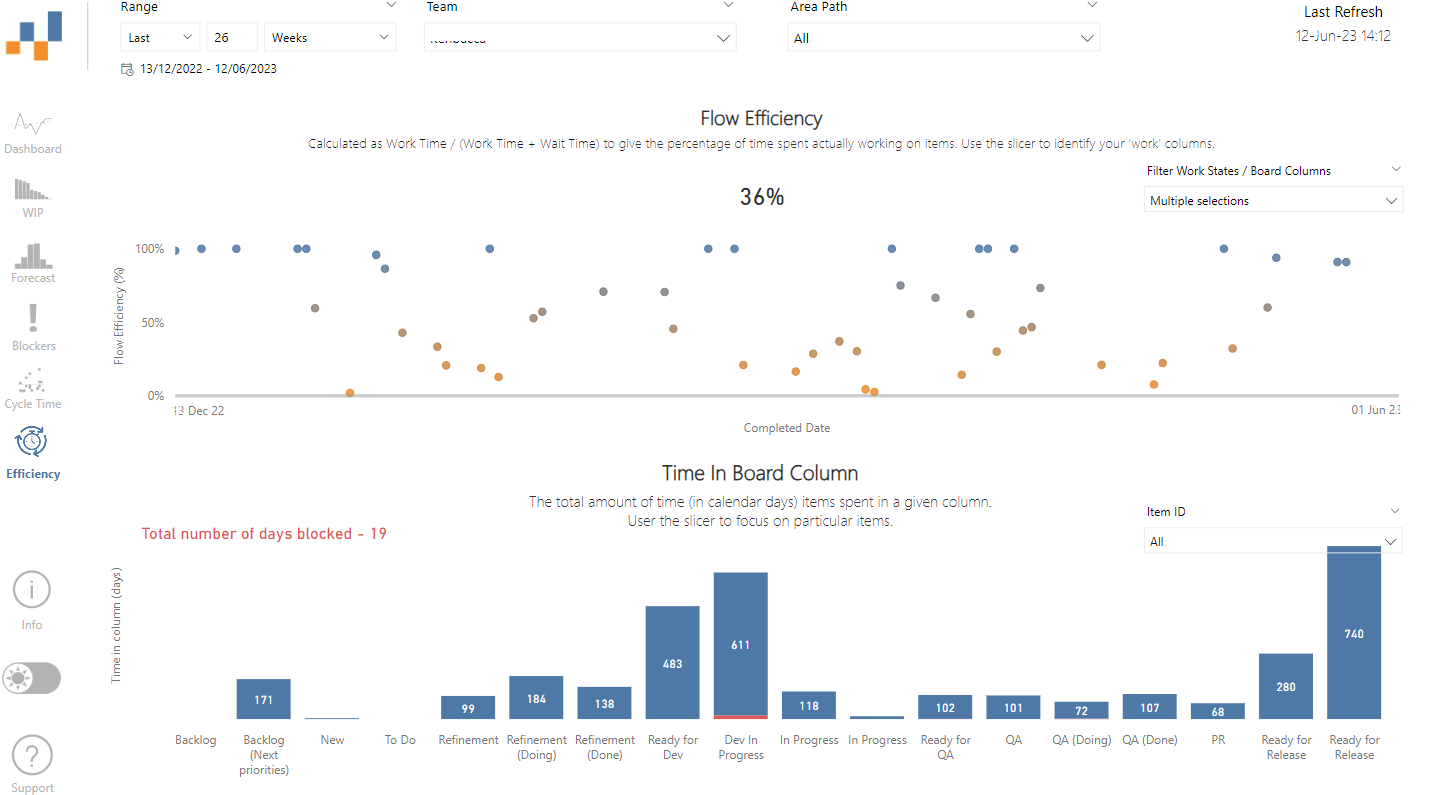
Screenshots

alt text

alt text

alt text

alt text

alt text

alt text

alt text

Feedback

FlowViz is built and maintained by Nicolas Brown and is published using Agile Extensions for assistance (big thank you to them!) Please email [email protected] for ideas, improvements and feedback.

You can also ask in the #flowviz channel in the Azure DevOps Club Slack community:

Image

Thank you

Thank you to all the people who helped inspire and/or build this, providing feedback and answering my questions especially:

Note that the project description data, including the texts, logos, images, and/or trademarks, for each open source project belongs to its rightful owner. If you wish to add or remove any projects, please contact us at [email protected].