shinyCanvas
Create and customize an interactive canvas using the 'D3' JavaScript library and the 'htmlwidgets' package.
The canvas can be used directly from the R console, from 'RStudio', in Shiny apps and R Markdown documents.
When in Shiny the canvas is observed by the server and can be used as a functional slider (with animation) to work in a two dimensional space.
The main objective is to create a new object for Shiny that represents a functional slider extending the one dimensional shiny::sliderInput.
For an interactive bl.ock page to try the d3js code go to here.
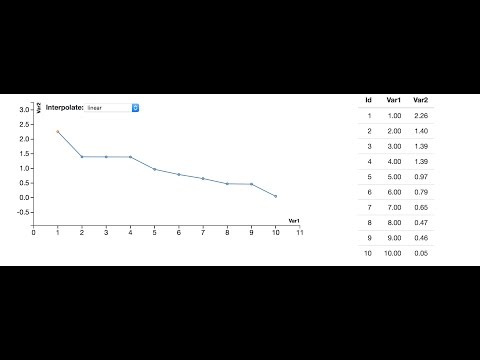
The user inputs a data.frame that contains corrdinates x,y and then can:
- add/remove points to the plot
- change position of the points
- change the type of interpolation between points
- run animation on the interpolated curve to collect a sample from it
Usage as an htmlwidget in the RStudio viewer
canvas(obj = data.frame(x=1:10,y=runif(10)))
Usage in a Shiny app
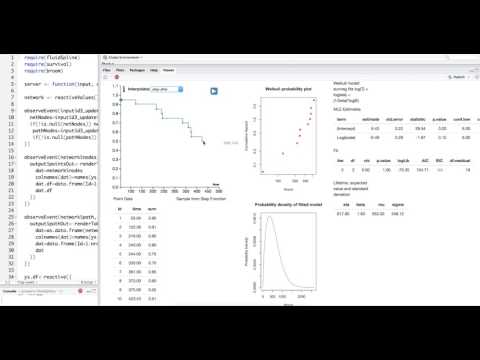
When run in the Shiny environment, Shiny is observing the points and returns to the server their x,y mapping. So instead of predefining scenarios in simulations you can let the user define the relationship between two variables.
Reactive Canvas:


Click Pictures to see Youtube Videos
Basic Usage:
Script to run example below
Survival Analysis Example:
library(shinyCanvas)
library(shiny)
server <- function(input, output) {

  network <- reactiveValues()

  df<-reactive({
    data.frame(Var1=1:10,Var2=sort(rexp(10),decreasing = T))
  })

  observeEvent(input$d3_update,{
    netNodes=input$d3_update$.pointsData
    if(!is.null(netNodes)) network$nodes <- jsonlite::fromJSON(netNodes)

    pathNodes=input$d3_update$.pathData
    if(!is.null(pathNodes)) network$path <- jsonlite::fromJSON(pathNodes)
  })

  observeEvent(network$nodes,{
    output$pointsOut<-renderTable({
      dat=network$nodes
      colnames(dat)=names(df())
      dat.df=data.frame(Id=1:nrow(dat),dat)
      dat.df
    })
  })

  observeEvent(network$path,{
    output$pathOut<-renderTable({
      dat=as.data.frame(network$path)
      colnames(dat)=names(df())
      dat=data.frame(Id=1:nrow(dat),dat)
      dat
    })
  })

  output$d3 <- renderCanvas({
    isolate({canvas(obj = df(),animate = TRUE,duration=500,pathRadius=10)})
  })
}

ui <- fluidPage(
  column(6,canvasOutput(outputId="d3")),
  column(3,
         p('Plot Points'),
         tableOutput('pointsOut')
         ),
  column(3,
         p('Path Sample'),
         tableOutput('pathOut')
         )
)

shinyApp(ui = ui, server = server)