citybasebrooks / Siac
Projects that are alternatives of or similar to Siac
SIAC
SIAC is a SIEM In A Can. It's pronounced like "sigh-ack." SIAC can run in the cloud, on bare metal, or a hybrid environment.
Background
As the name implies, SIAC is a SIEM. The purpose of this project is not to provide an off-the-shelf security monitoring and alerting solution, but rather to demonstrate how organizations and individuals can use free and open-source tools to build out modern information security capabilities. SIAC is capable of scaling to N nodes and handling tens of thousands of events per second (EPS). This work is based on CityBase's security engineering R&D.
The SIAC project documentation has been released for a few reasons:
-
More and more organizations are eager to build out their own toolchain, but aren't sure where to start. We hope that this documentation can change that.
-
Security budget is a scarce commodity and defenders are often being asked to implement enterprise solutions without an enterprise budget.
-
Sharing security knowledge is good, and makes our industry better.
Disclaimers
These are very important and contain information required to operate SIAC securely in production.
-
This project presents a dramatically scaled down version of a SIEM and it has not been subjected to any kind of performance testing.
-
This example stack does not implement any encryption for data in transit. Certificate and key management policies can vary greatly between organizations and their environments. When implementing any or all of this stack, it is your responsibility to implement encryption in a way that is congruent with the security policies of your organization. All components have support for network-level encryption. Specific to elasticsearch, please investigate options such as X-pack, Search Guard, and Nginx as a reverse proxy.
-
This example stack does not implement any authentication. The policies and procedures for managing secrets can vary greatly between organizations and their environments. When implementing any or all of this stack, it is your responsibility to implement authentication in a way that is congruent with the security policies of your organization. All components have support for client/server authentication and there are also plugins that can help, but to keep it simple, we don't implement any of these in the documentation.
-
For the sake of simplicity, all server-side components live on one machine. All documented components support a distributed and clustered architecture. When implementing any or all of this stack, it is important to determine how these components are broken out, secured, and scaled for your organization.
-
All configuration files represent the bare minimum requirements for getting services up and running, and client components shipping event data. Please consult the full reference configuration files and documentation, where applicable.
Design
Before digging into the rest of the documentation and standing up a SIAC, it might be helpful to understand what this project does and what drove certain design choices.
-
We wanted it to have as little custom code as possible and to work with automation tools such as Salt and Terraform. This speeds up deployment, disaster recovery, and provisioning which are usually bottlenecks in traditional SIEM architecture.
-
It had to support modern Linux operating systems, and run in the cloud. Traditional SIEMs don't do modern or cloud very well.
-
It needed to help us maintain PCI compliance, and provide a good actionable view of data for our auditors which mapped directly to certain controls outlined in the PCI-DSS. This should help any organization cruise through their ROC and evidence collection.
-
Horizontal scalability. Searching and indexing need to be fast. Adding speed and capacity should be as simple as N+1.
-
Modular architecture. There's always new tools in the security space and we wanted to be able to add and remove components without too much complexity.
-
Security and event data correlation should be transparent. Black boxes are old and busted. This should be hot and new.
Capability Overview
According to Wikipedia, there are 7 key capabilities a SIEM should implement:
- Data aggregation
- Correlation
- Alerting
- Dashboards
- Compliance
- Retention
- Forensic analysis
SIAC does all of these.
PCI Compliance
A lot of the dashboarding functionality we'll be looking at is backed by the Wazuh Kibana app.
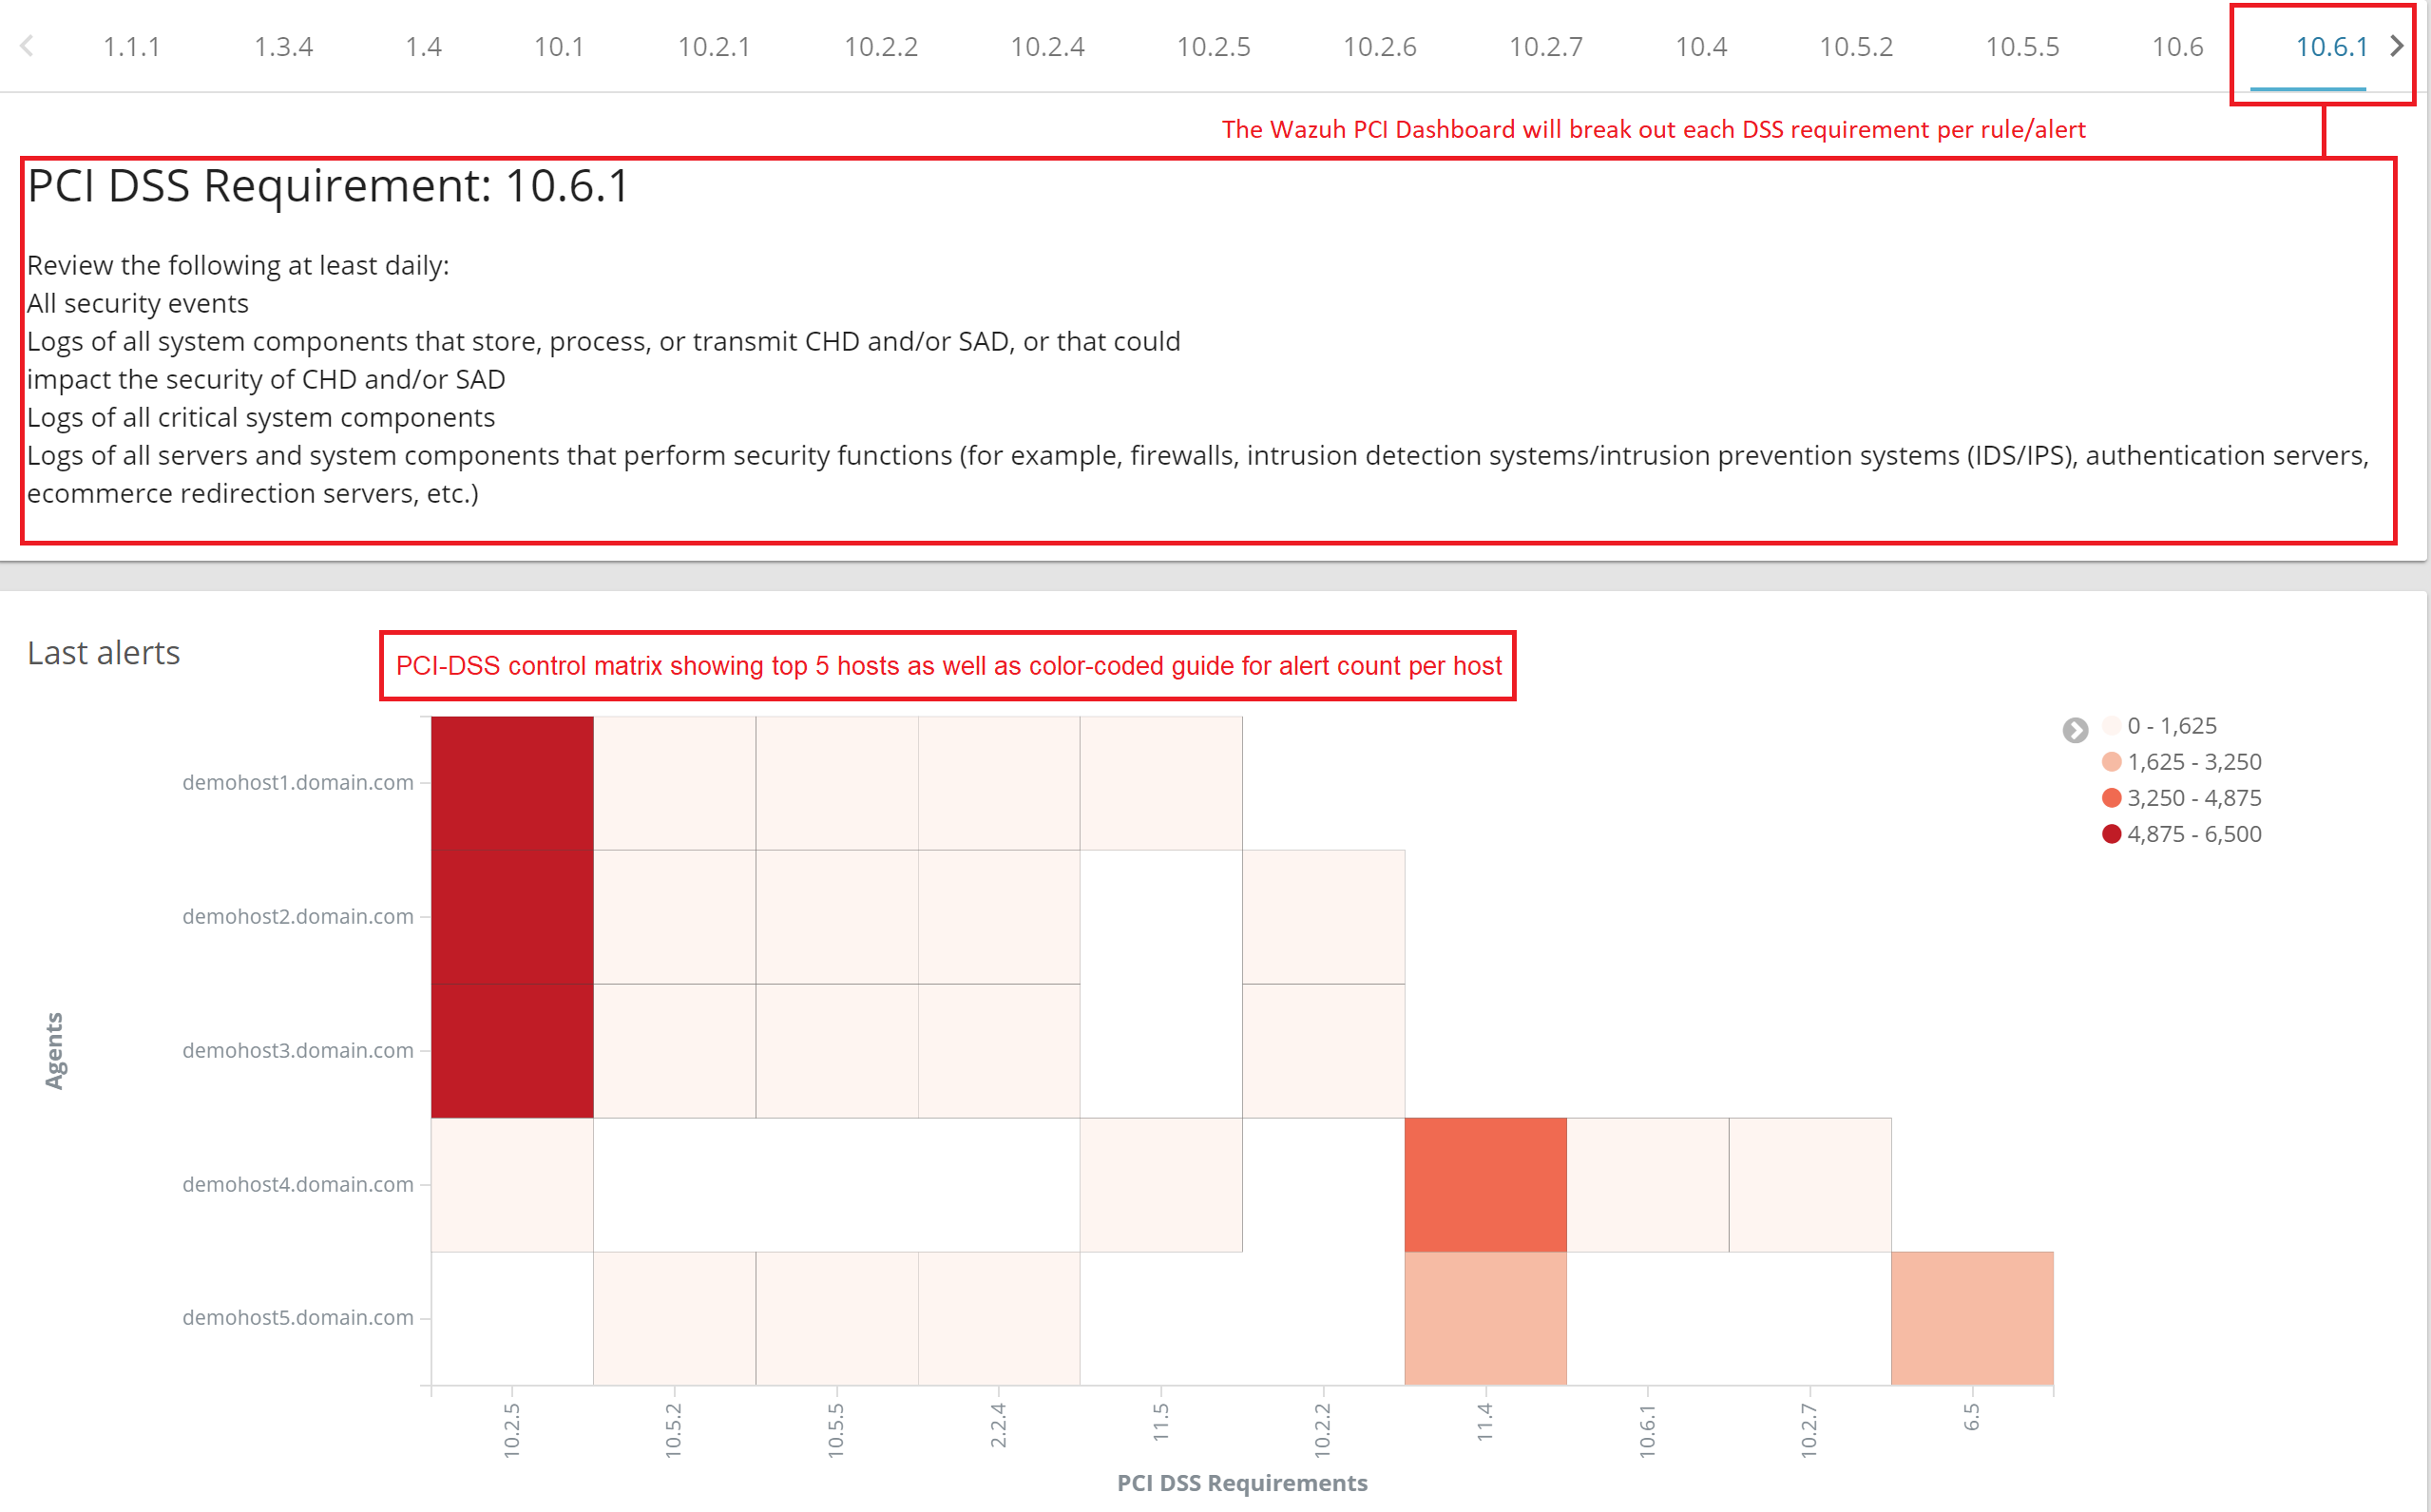
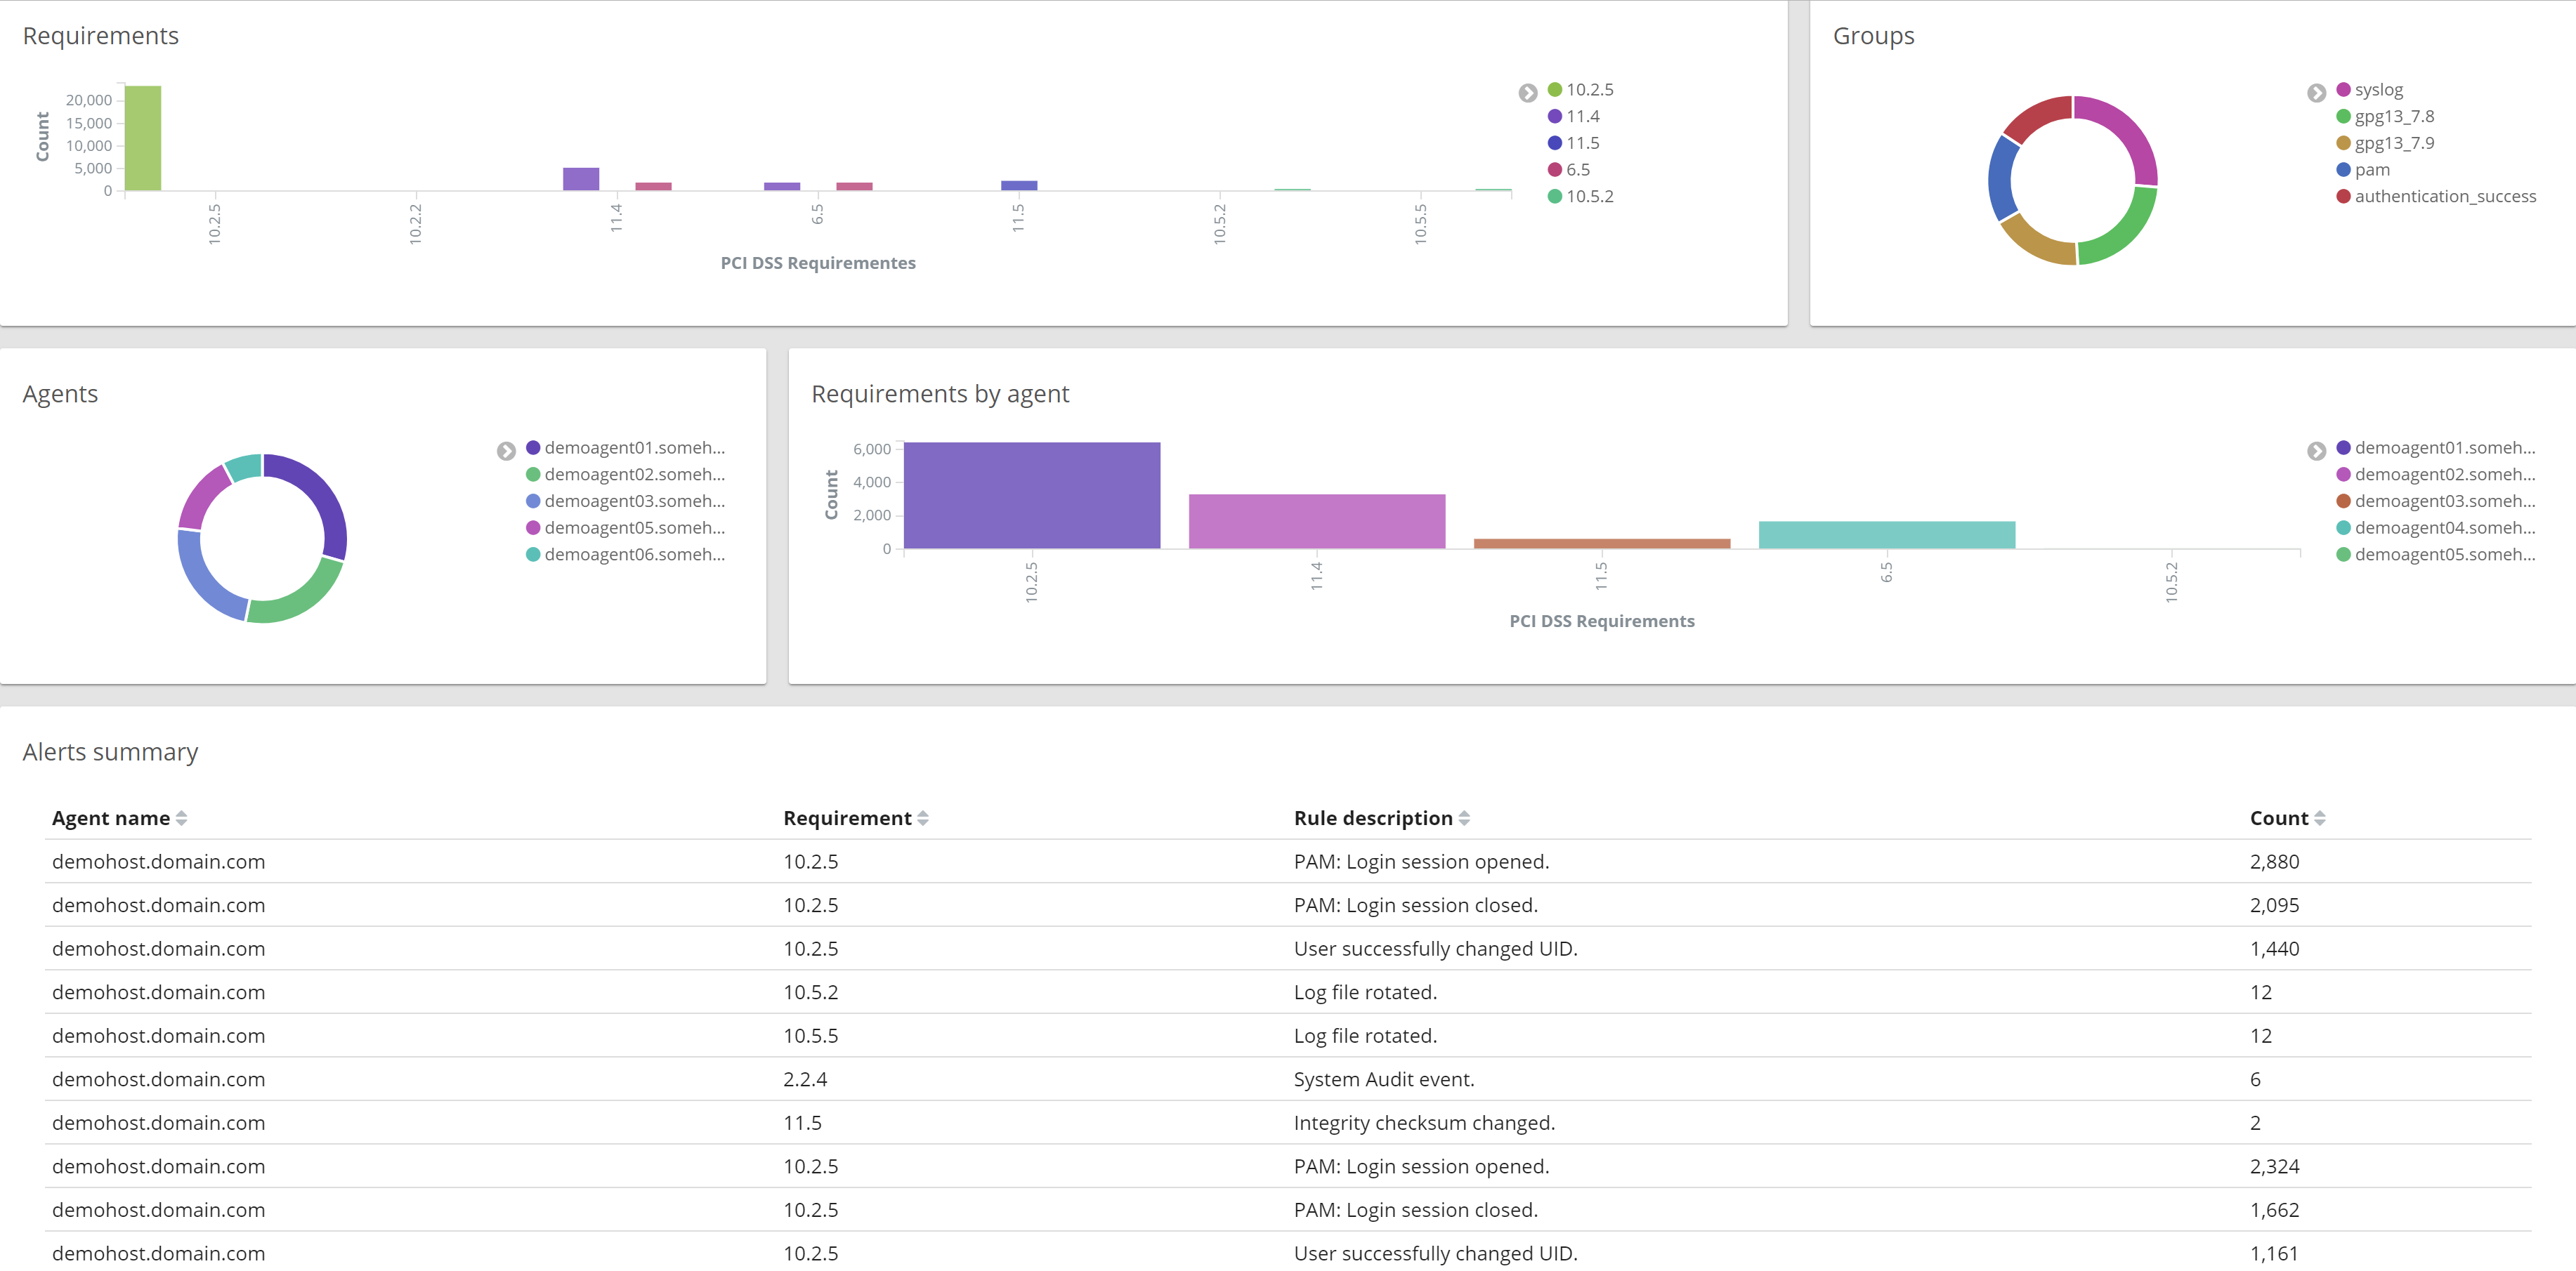
As mentioned earlier, one of the core requirements for our stack was functionality that would support us in maintaining our PCI compliance, and communicating this information to our auditors. The fact that Wazuh maps rules/alerts to specific sections of the PCI-DSS, and provides a PCI-specific dashboard has helped immensely. Please refer to the annotated images for additional context. Please see the Wazuh documentation relating to PCI compliance for additional details.
Wazuh is a fork of the very popular OSSEC software package which provides a lot of additional functionality such as agent management/registration, centralized configuration management, file integrity monitoring, and host-based intrusion detection capabilities. Similar to the PCI dashboards above, the Wazuh Kibana app also provides ready-to-use visualizations for FIM, HIDS, CIS benchmarks, and much more.
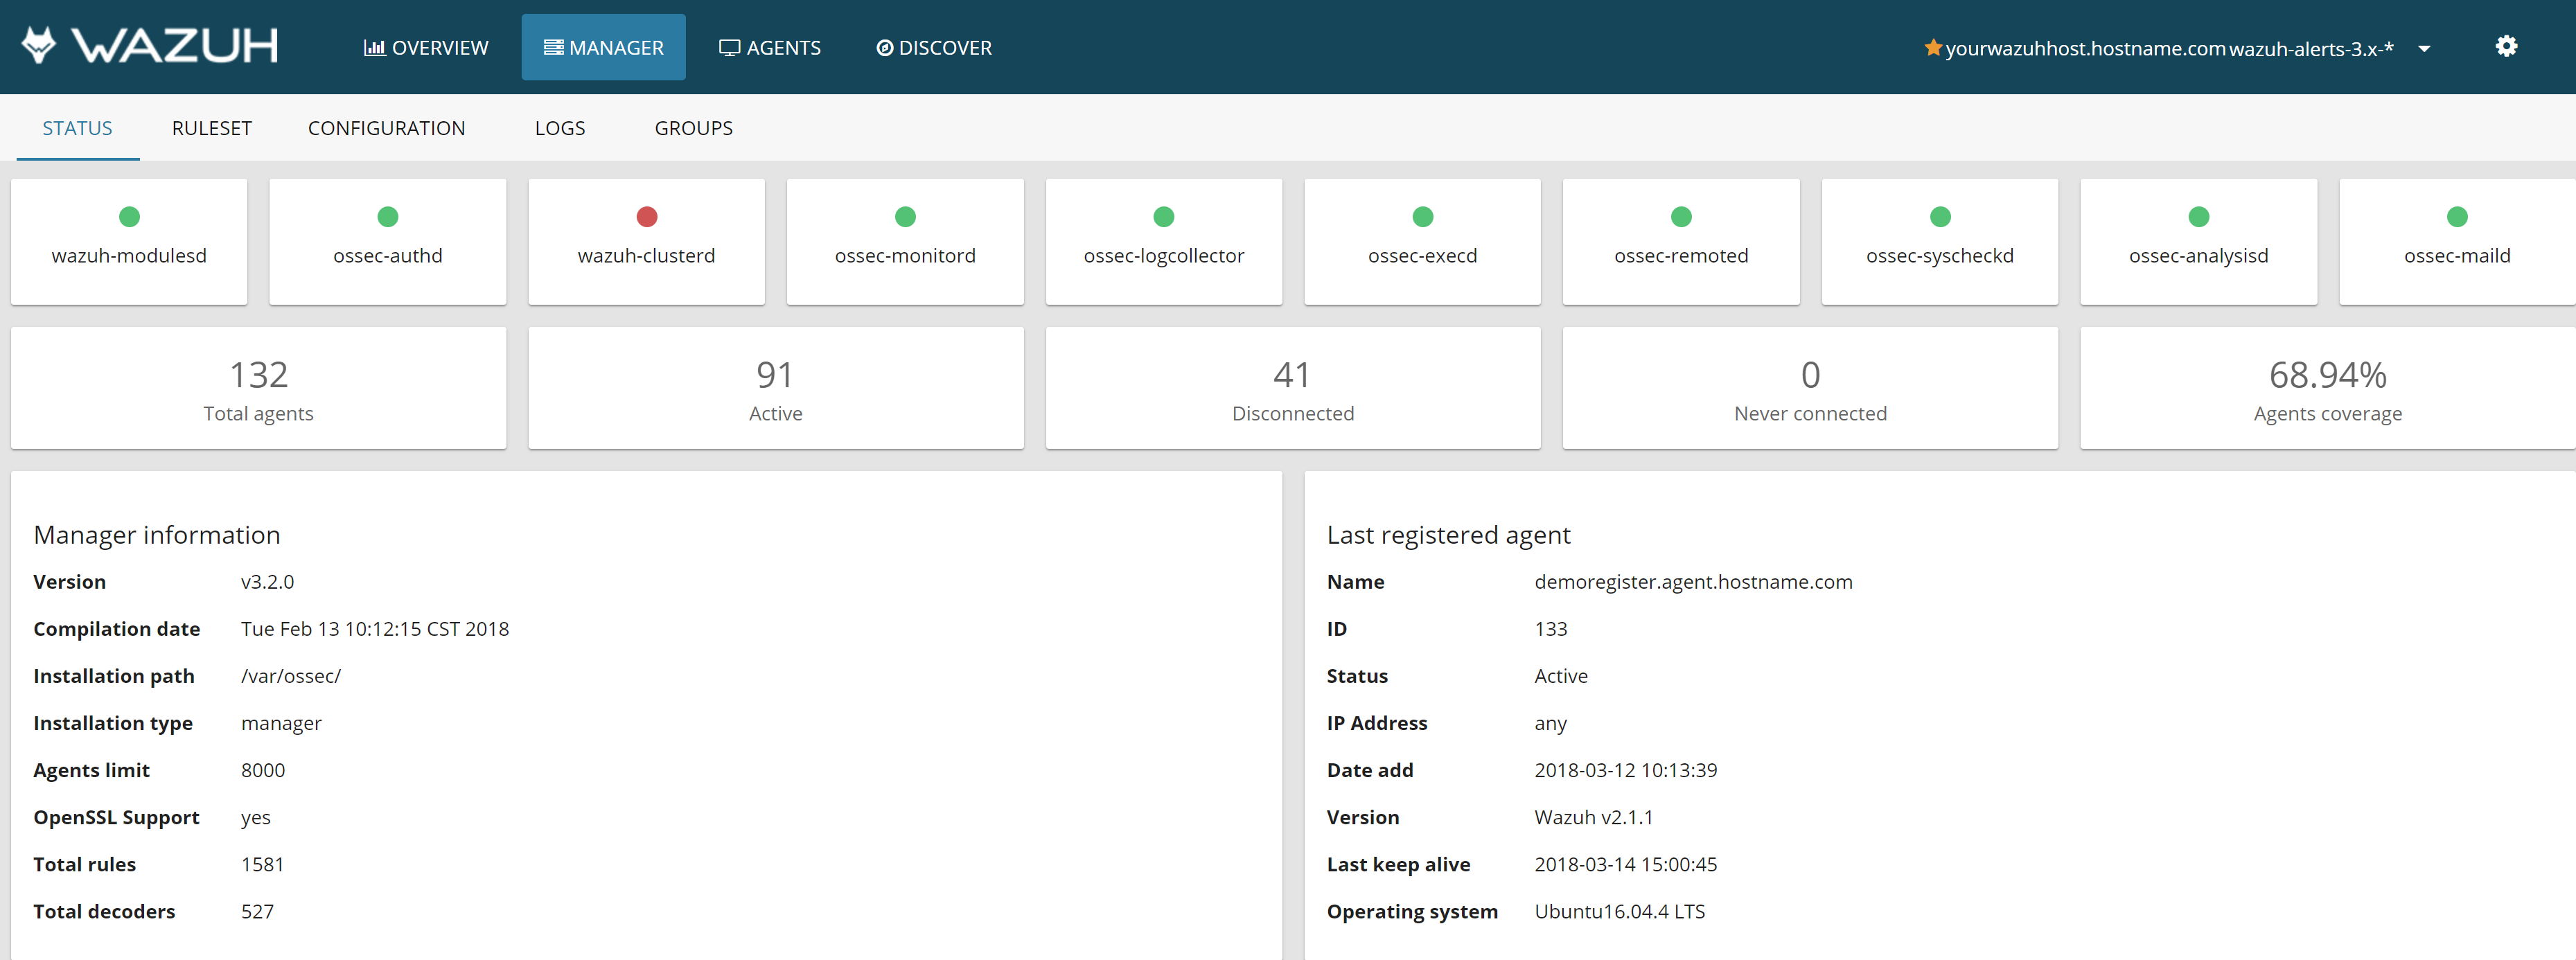
Another helpful application component is the Wazuh management functionality which is part of the Kibana app. This component allows for agent grouping, monitoring, error reporting, configuration review, and more.
Additional screenshots of Wazuh app can be found in the official documentaiton.
Visualizations
One of the most powerful features of building off of ELK is the visualization capabilities. We've included the kbn_network plugin with this stack since we found it so useful for visualizating relationships between indexed field data. In this example, we use data from the packetbeat index to visualize the source/destination relationships of 25 distinct source/destination nodes.
kbn_network Plugin Visualization
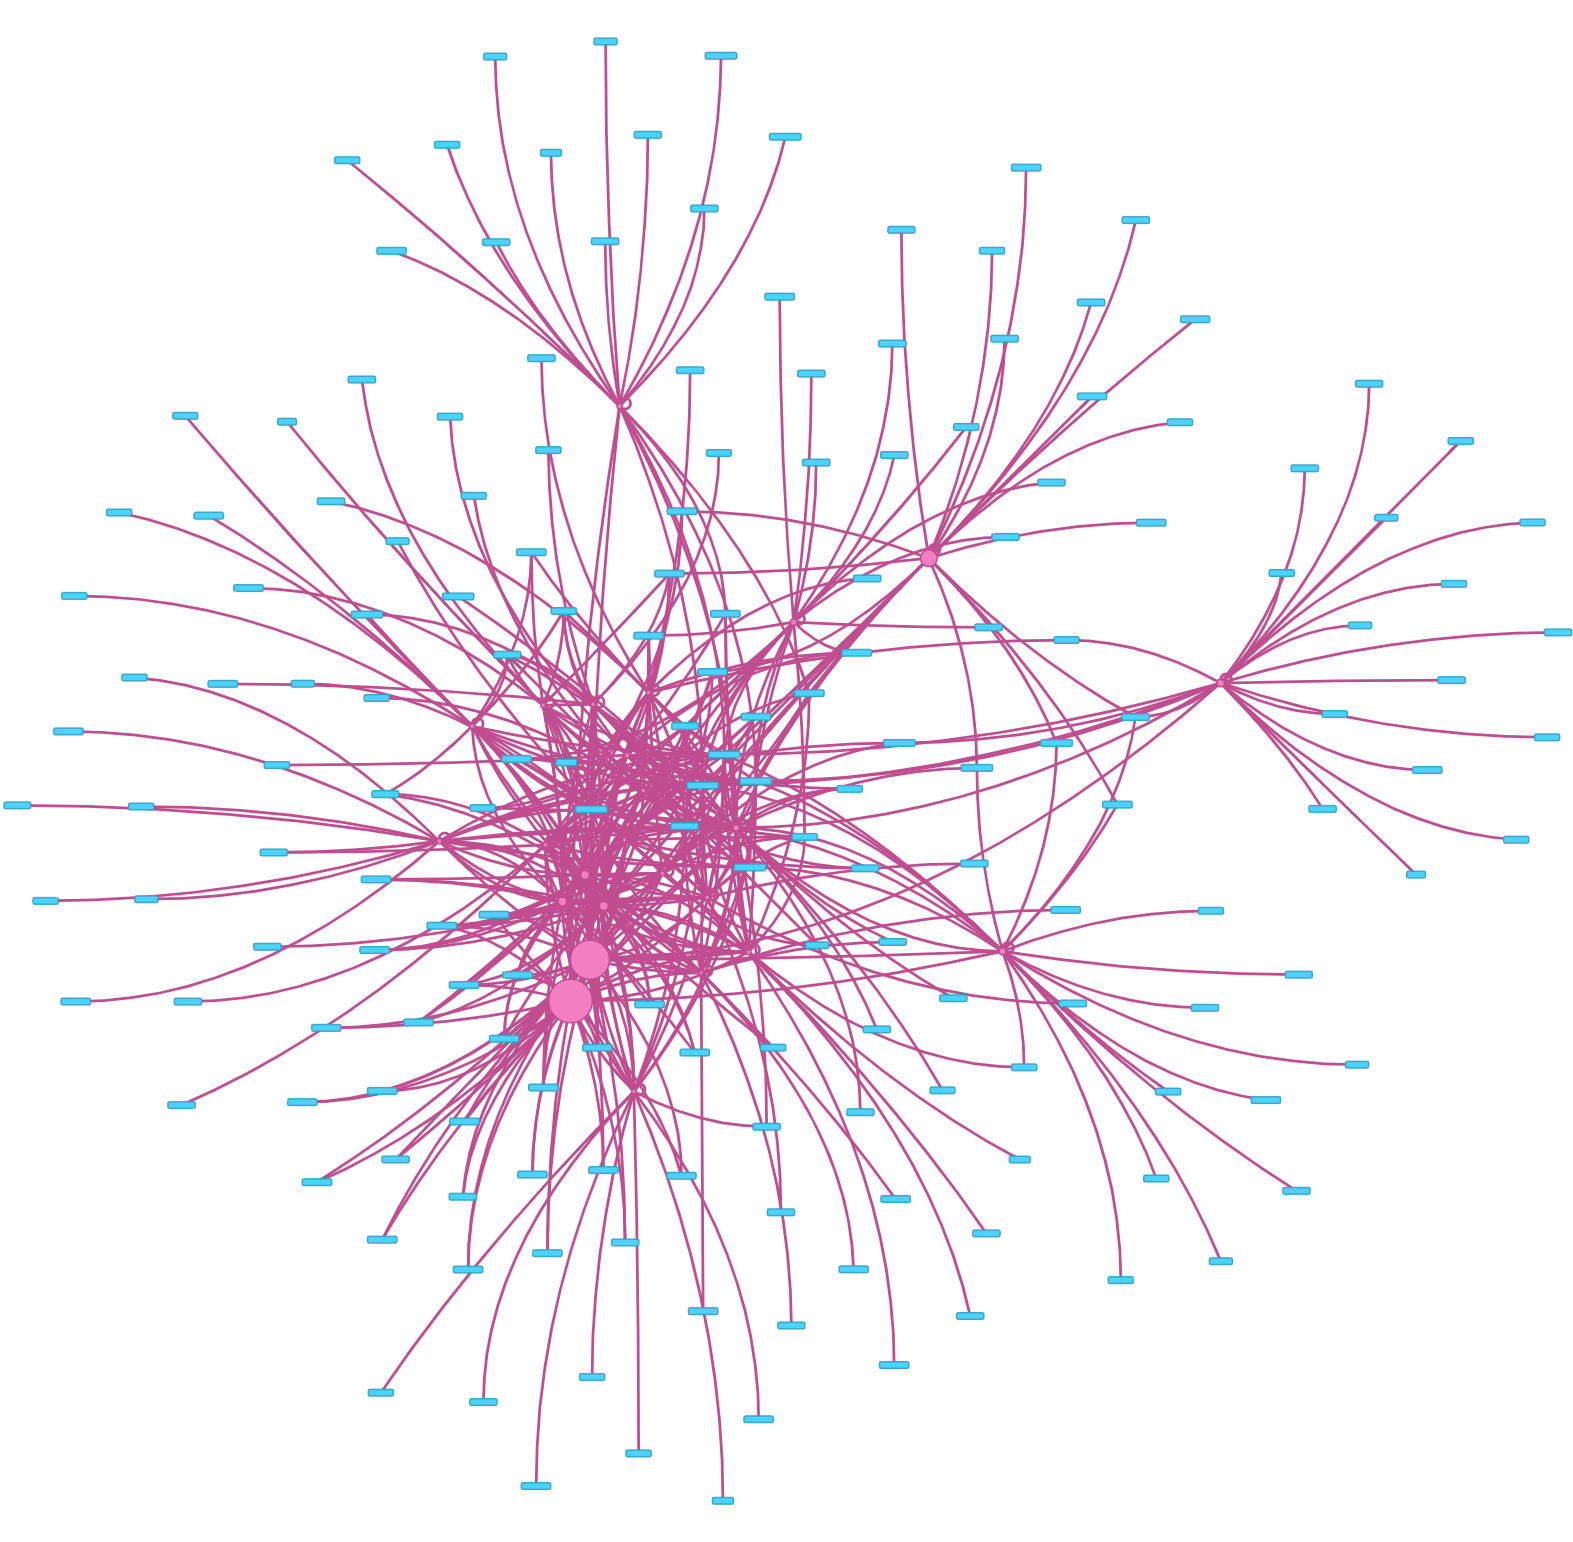
While that's interesting to look at, it's a little too broad to be practical. If we add an additional search constraint based on source IP, we can view the unique hosts that the source IP has talked to over an arbitrary time period.
kbn_network Plugin Visualization
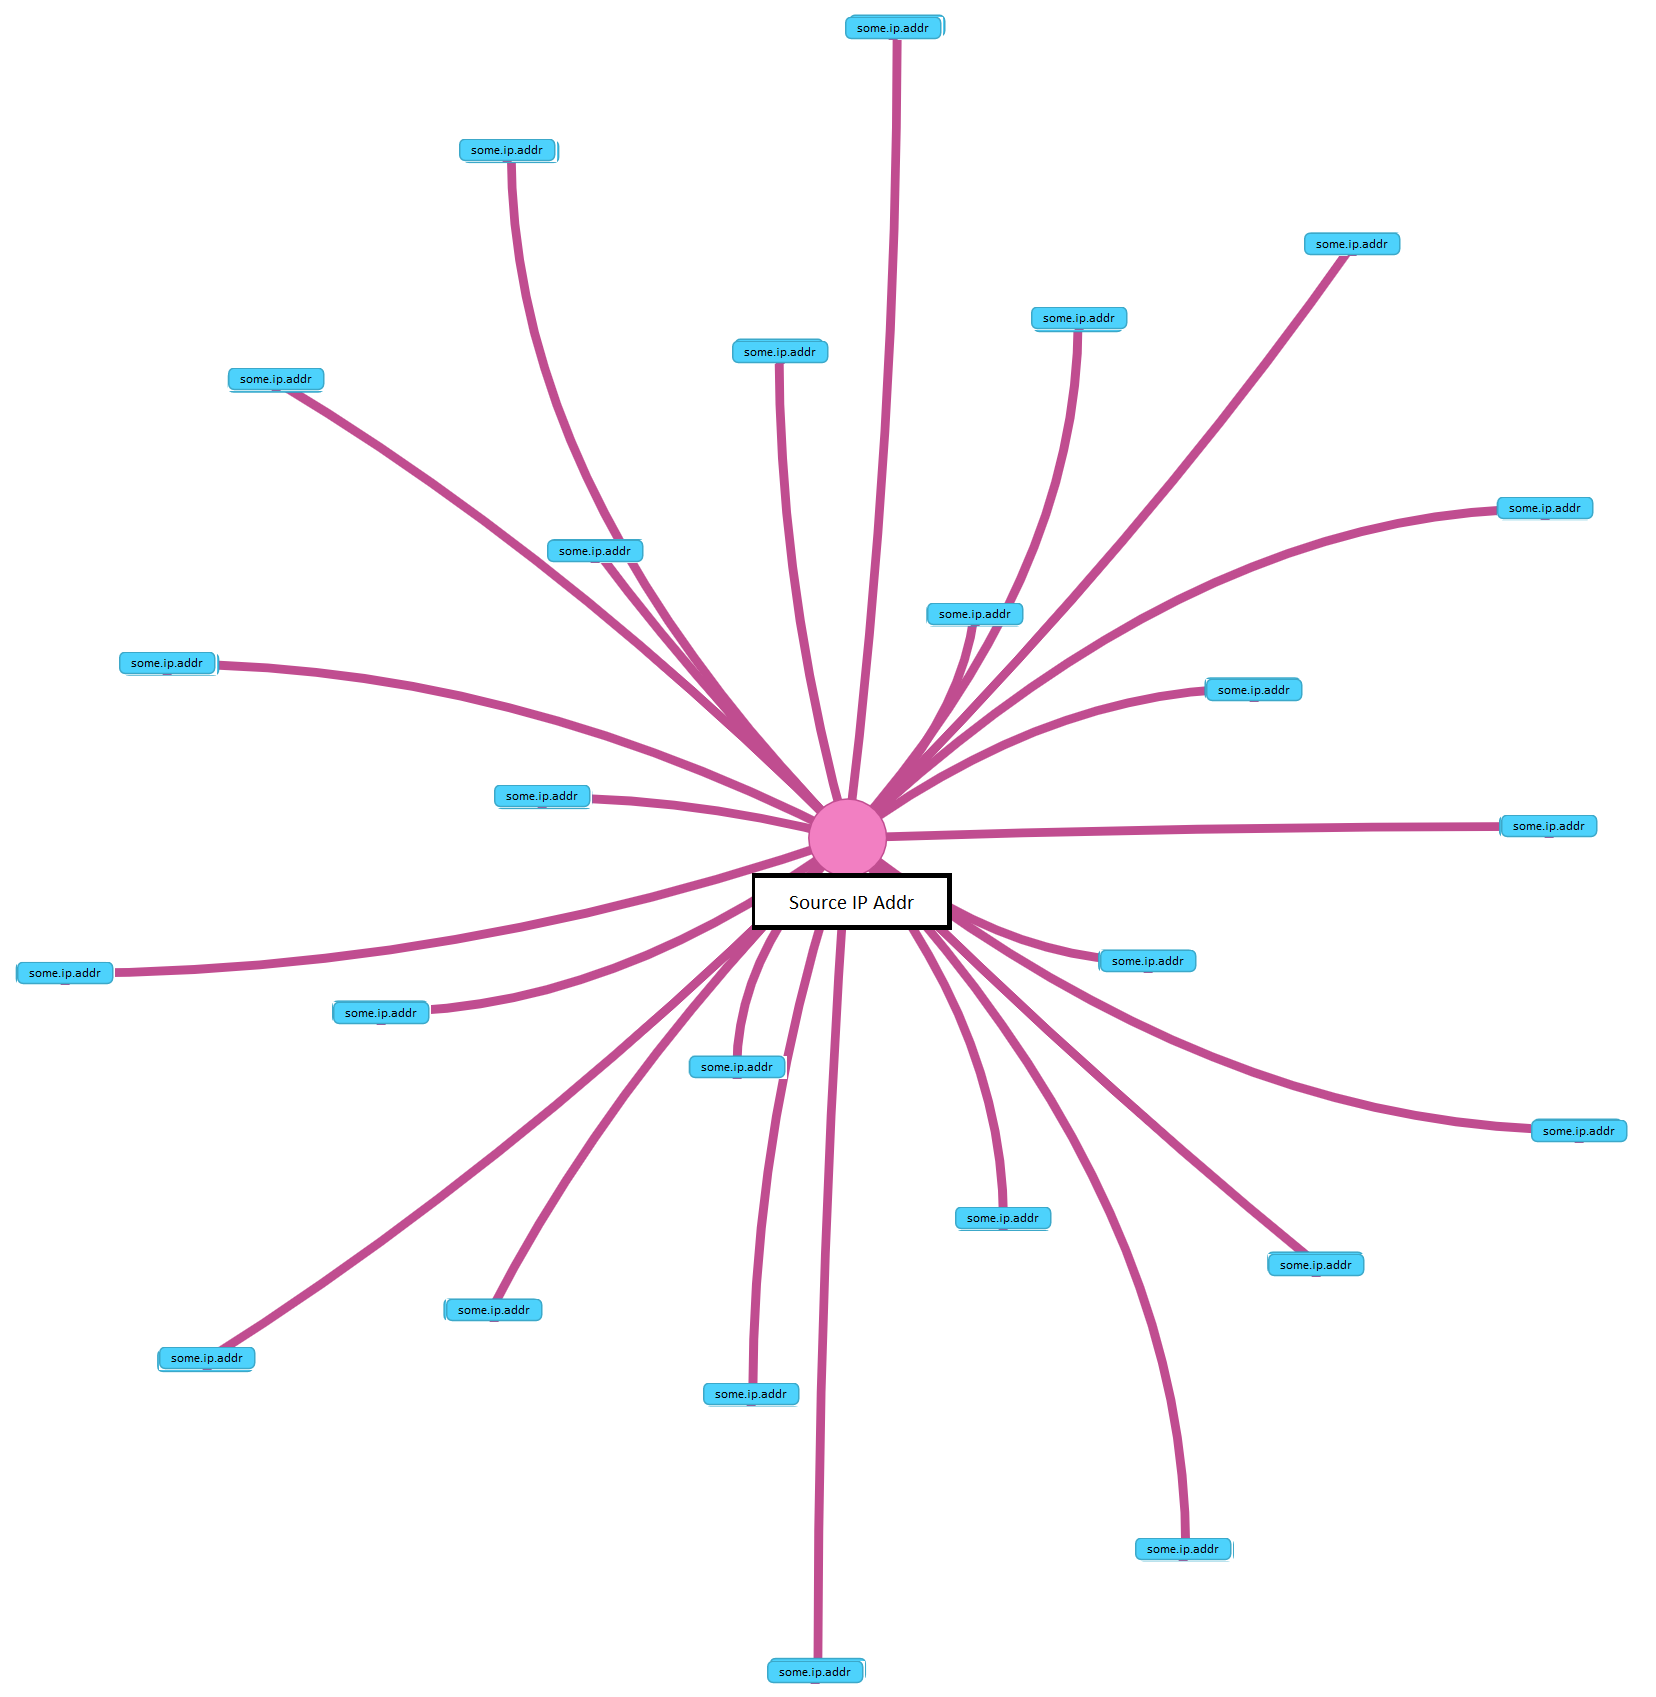
This type of relationship mapping can be applied to any indexed data such as DNS lookups, host executable activity, and probably a lot of other interesting things we haven't gotten around to just yet.
Raw Search
Elasticsearch and the Lucene query syntax are extremely powerful for searching very large volumes of indexed data. A detailed tutorial on using ELK to search data is beyond the scope of this documentation, but once SIAC is up and running, you can experiment with searching data in the filebeat, packetbeat, and wazuh-alerts, indexes.
Flexibility
Beyond the inherent flexibility that exists when working with open-source software, all of the visual components can be customized to your needs. This means that if there's a saved search, visualization, or dashboard that you want to modify and save, it's very easy to do.
Yes, it's a real SIEM
At this point it should be clear that while SIAC may be small in this documented build, the sum of its components are more than capable of supporting an enterprise security program both in terms of scale and functionality. Following the documentation, it should take no more than 30 minutes to have a SIAC instance up and running.
Building it out
Server: Installation and Configuration
The backend stack uses Elasticsearch as the primary data store, which holds event data generated by client systems. This data is fed to the backend from the clients using Beats. We make sense of this data using Kibana, Wazuh, and various custom dashboards.
The following installation and configuration steps should be considered "quick start" in order to get the system operational, have a rough understanding of how the components work together, and start searching some simple dashboards and event data.
Requirements: 64-bit Ubuntu Desktop 16.04 LTS, 4GB RAM, 1 CPU core. Why desktop? It made copying and pasting easier in VMware.
The following commands will set up the repositories for Wazuh, Java, Node, and Elastic, install the appropriate packages, generate a SSL certificate for the Wazuh auth daemon, and start the authorization service.
apt-get update
apt-get install curl apt-transport-https lsb-release
curl -s https://packages.wazuh.com/key/GPG-KEY-WAZUH | apt-key add -
echo "deb https://packages.wazuh.com/3.x/apt/ stable main" | tee -a /etc/apt/sources.list.d/wazuh.list
apt-get update
apt-get install auditd
apt-get install wazuh-manager=3.2.0-1
openssl req -x509 -batch -nodes -days 365 -newkey rsa:2048 -keyout /var/ossec/etc/sslmanager.key -out /var/ossec/etc/sslmanager.cert
/var/ossec/bin/ossec-authd
curl -sL https://deb.nodesource.com/setup_6.x | bash -
apt-get install nodejs
apt-get install wazuh-api=3.2.0-1
add-apt-repository ppa:webupd8team/java
apt-get update
apt-get install oracle-java8-installer
curl -s https://artifacts.elastic.co/GPG-KEY-elasticsearch | apt-key add -
echo "deb https://artifacts.elastic.co/packages/6.x/apt stable main" | tee /etc/apt/sources.list.d/elastic-6.x.list
apt-get update
apt-get install elasticsearch=6.2.0
apt-get install kibana=6.2.0
Open /etc/elasticsearch/elasticsearch.yml, uncomment network.host: and set it to be the IP bound to the primary network interface.
Open /etc/kibana/kibana.yml, uncomment server.port: and leave it set to 5601. Uncomment server.host: and set it to be the IP bound to the primary network interface. Uncomment elasticsearch.url: and change localhost to be the IP bound to the network interface of your elasticsearch service.
systemctl enable elasticsearch.service
systemctl restart elasticsearch.service
systemctl enable kibana.service
systemctl restart kibana.service
Do a quick health check to make sure your elasticsearch service is running, i.e.:
curl http://192.168.214.134:9200
{
  "name" : "QHmFjRw",
  "cluster_name" : "elasticsearch",
  "cluster_uuid" : "pphMqGKKR8eTPunEnYyfXg",
  "version" : {
    "number" : "6.2.0",
    "build_hash" : "37cdac1",
    "build_date" : "2018-02-01T17:31:12.527918Z",
    "build_snapshot" : false,
    "lucene_version" : "7.2.1",
    "minimum_wire_compatibility_version" : "5.6.0",
    "minimum_index_compatibility_version" : "5.0.0"
  },
  "tagline" : "You Know, for Search"
}
Confirm that the Kibana app is online and accessible by pointing your browser at http://YOURKIBANAIP:5601/app/kibana. If all is well and good, proceed with installing the Wazuh Kibana app and other backend components. Be mindful of the following commands and change localhost to be the IP address of your elasticsearch server that is running on port 9200.
curl https://raw.githubusercontent.com/wazuh/wazuh/3.2/extensions/elasticsearch/wazuh-elastic6-template-alerts.json | curl -XPUT 'http://localhost:9200/_template/wazuh' -H 'Content-Type: application/json' -d @-
curl https://raw.githubusercontent.com/wazuh/wazuh/3.2/extensions/elasticsearch/wazuh-elastic6-template-monitoring.json | curl -XPUT 'http://localhost:9200/_template/wazuh-agent' -H 'Content-Type: application/json' -d @-
curl https://raw.githubusercontent.com/wazuh/wazuh/3.2/extensions/elasticsearch/alert_sample.json | curl -XPUT "http://localhost:9200/wazuh-alerts-3.x-"`date +%Y.%m.%d`"/wazuh/sample" -H 'Content-Type: application/json' -d @-
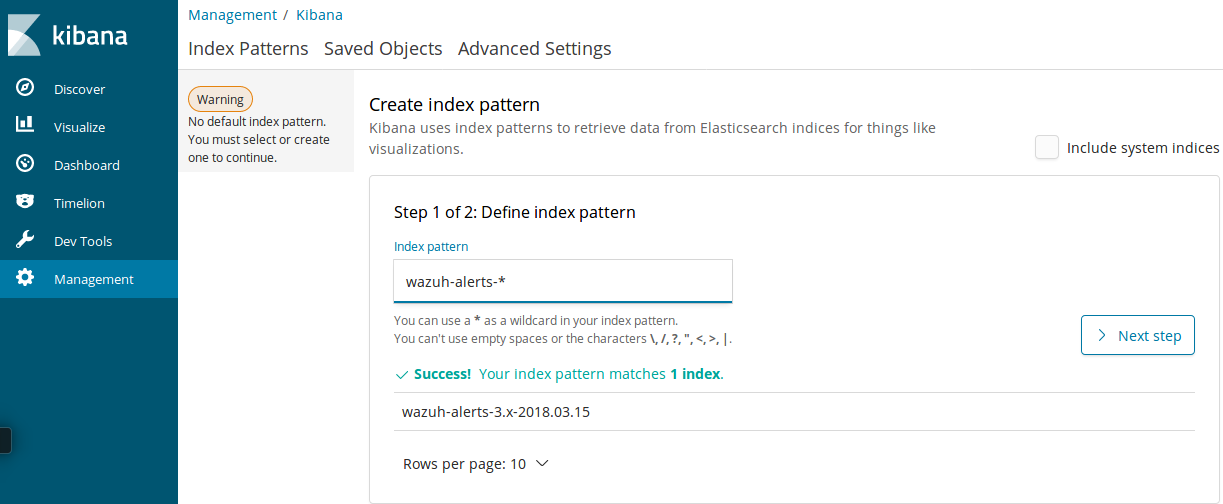
What we've just done is load the wazuh-alerts index template, load the wazuh-monitoring index template, and load one sample alert. Open Kibana, click the Management application, enter the index name with a * as pictured, and click "next step."
On the next screen, select time filter field name "@timestamp." Click create index pattern.
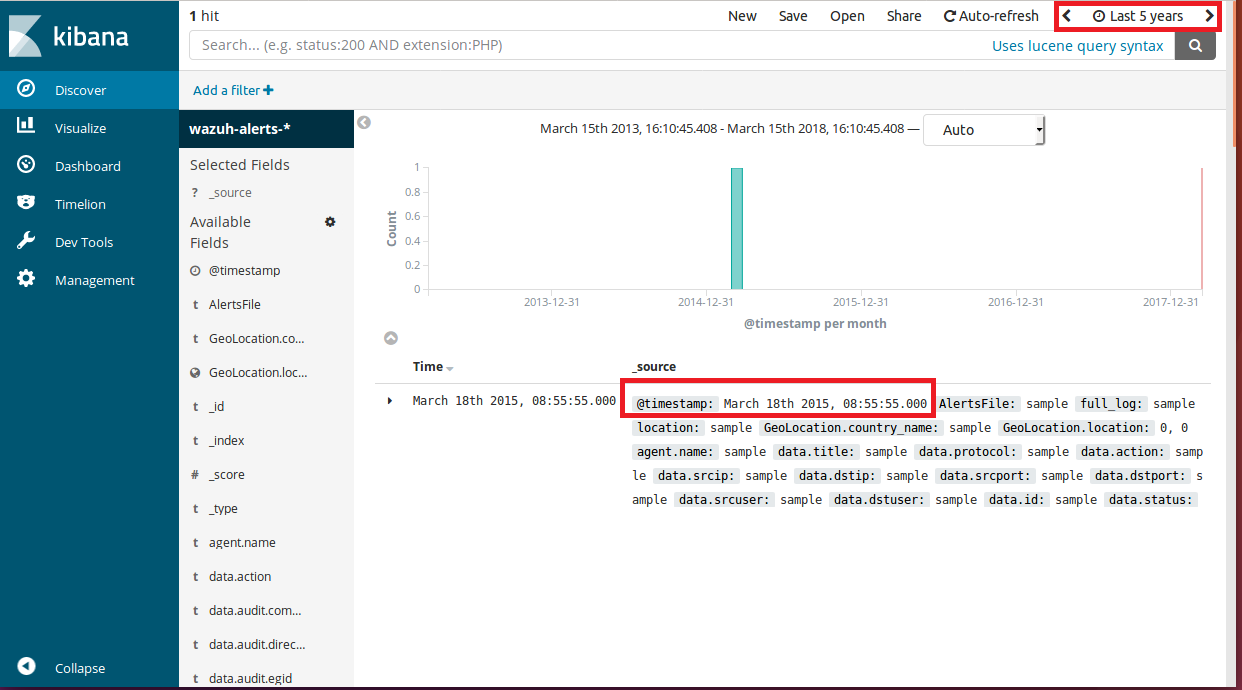
Once that's done, click Discover app in Kibana, and make sure the selected index is wazuh-alerts-. It's important to note that the sample alert inserted into elasticsearch is from 2015, so change your search time frame to be for the last 5 years. If successful, you should see the following.
We are almost done setting up the server.
apt-get install logstash=1:6.2.0-1
curl -so /etc/logstash/conf.d/01-wazuh.conf https://raw.githubusercontent.com/wazuh/wazuh/3.2/extensions/logstash/01-wazuh-local.conf
usermod -a -G ossec logstash
Open up /etc/logstash/conf.d/01-wazuh.conf and change hosts => ["localhost:9200"] to the IP address of your elasticsearch service.
Next, start the logstash service, install the Kibana app, and load the index templates for filebeat and packetbeat.
systemctl enable logstash.service
systemctl start logstash.service
export NODE_OPTIONS="--max-old-space-size=3072"
/usr/share/kibana/bin/kibana-plugin install https://packages.wazuh.com/wazuhapp/wazuhapp-3.2.0_6.2.0.zip
systemctl restart kibana.service
apt-get install packetbeat=6.2.0
apt-get install filebeat=6.2.0
filebeat setup --template -E output.logstash.enabled=false -E 'output.elasticsearch.hosts=["YOURELASTICIP:9200"]'
packetbeat setup --template -E output.logstash.enabled=false -E 'output.elasticsearch.hosts=["YOURELASTICIP:9200"]'
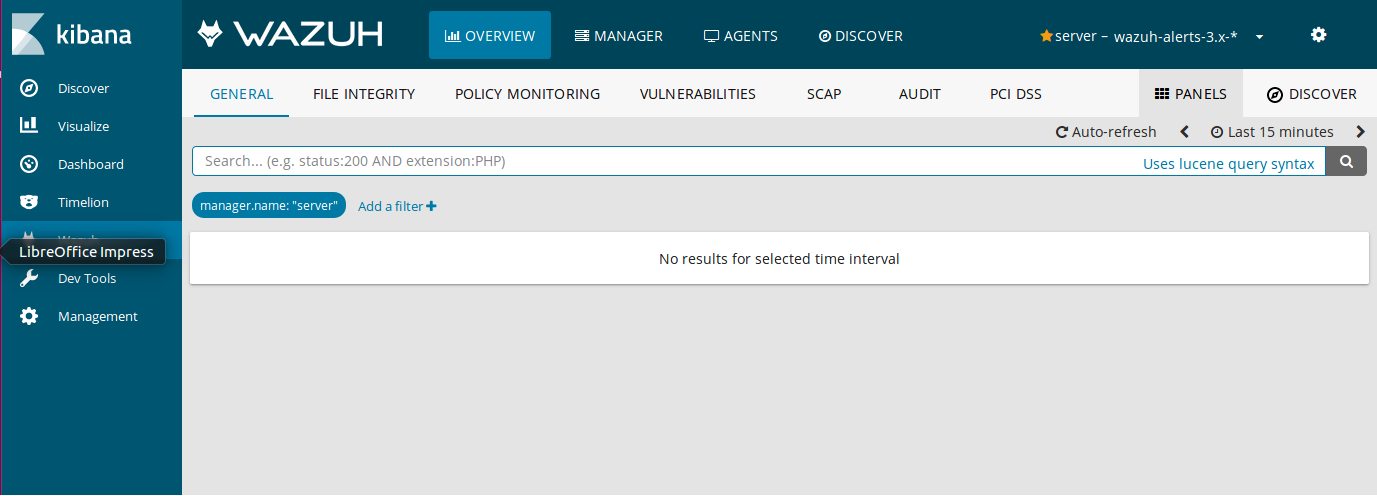
Reload your Kibana browser to access the Wazuh app on the left. When prompted, complete the API setup as documented here. Naturally it doesn't look like much because we haven't connected a client machine to populate it with data. It should be noted that even without an agent connected, the system will collect local event data from the server itself and slowly populate the indexes.
At this point, the server installation is done. The kbn_network Kibana plugin is not required, but it is very cool. To install it, follow the steps on the GitHub repo and restart Kibana once done. Note that you will need to edit package.json and set the Kibana verion to 6.2.0. To install the filebeat and packetbeat dashboards, please consult the documentation here and here respectively.
Note: It is strongly recommended that when building to scale, all package versions are pinned. For example, running different beat versions, may result in naming inconsistencies in your indices. Running an Elastic cluster with mixed service versions, even minor versions such as 6.2.0 vs 6.2.1, will cause issues with cluster recovery, index rebalancing, and who knows what else.
Client: Installation and Configuration
The client-side stack is an amalgamation of lightweight software which generates data. This stack currently consists of:
- Osquery (OS instrumentation and querying)
- Wazuh (File integrity monitoring + host-based intrusion detection + auditd analysis/transport + PCI stuff)
- Filebeat (syslog + osquery + transport)
- Auditd (Linux auditing system)
- Packetbeat (network data + transport)
Installation of the client stack is very straightforward on Linux. Please note that if you're installing the agent on Windows, you will need to generate an agent key. This process is documented here. There is an easy powershell script provided that works very well for registering agents using the RESTful API. Be advised that you need to configure the script to point to your installation directory (on the local windows system) and configure the “Wazuh-Manager-IP” to the IP Address of your server.
Requirements: 64-bit Ubuntu Desktop 16.04 LTS, 2GB RAM, 1 CPU core.
To make life easy, copy the following into a Bash script and execute it. Before running the script, change WAZUHMANAGERIP on line 23 to be the IP of your Wazuh manager server.
#!/bin/bash
#in case curl isn't installed...
yes | apt-get install curl &&

curl -s https://artifacts.elastic.co/GPG-KEY-elasticsearch | apt-key add - &&
echo "deb https://artifacts.elastic.co/packages/6.x/apt stable main" | tee /etc/apt/sources.list.d/elastic-6.x.list &&
apt-get update &&

#install auditd on the client
yes | apt-get install auditd &&
#download auditd config
curl -so /etc/audit/audit.rules https://raw.githubusercontent.com/citybasebrooks/SIAC/master/configs/auditd.rules &&

#install the Wazuh agent
yes | apt-get install lsb-release &&
curl -s https://packages.wazuh.com/key/GPG-KEY-WAZUH | apt-key add - &&
CODENAME=$(lsb_release -cs) &&
echo "deb https://packages.wazuh.com/apt $CODENAME main" \
| tee /etc/apt/sources.list.d/wazuh.list &&
apt-get update &&
yes | apt-get install wazuh-agent &&
#register the agent
/var/ossec/bin/agent-auth -m WAZUHMANAGERIP &&

#install and configure osquery
apt-key adv --keyserver keyserver.ubuntu.com --recv-keys 1484120AC4E9F8A1A577AEEE97A80C63C9D8B80B &&
add-apt-repository "deb [arch=amd64] https://osquery-packages.s3.amazonaws.com/xenial xenial main" &&
apt-get update &&
yes | apt-get install osquery &&
curl -so /etc/osquery/osquery.conf https://raw.githubusercontent.com/citybasebrooks/SIAC/master/configs/osquery.conf &&

#install and configure filebeat
yes | apt-get install filebeat &&
curl -so /etc/filebeat/filebeat.yml https://raw.githubusercontent.com/citybasebrooks/SIAC/master/configs/filebeat.yml &&

#install and configure packetbeat
yes | apt-get install packetbeat &&
curl -so /etc/packetbeat/packetbeat.yml https://raw.githubusercontent.com/citybasebrooks/SIAC/master/configs/packetbeat.yml &&

echo "*****Done.  Script completed successfully*****"
Assuming the script completes without issues, you're almost done.
Edit /var/ossec/etc/ossec.conf and change <server-ip>MANAGER_IP</server-ip> to be the IP of your Wazuh manager server.
Edit /etc/filebeat/filebeat.yml and change hosts: ["YOURELASTICIP:9200"] to be the IP of your elasticsearch server.
Edit /etc/packetbeat/packetbeat.yml and change hosts: ["YOURELASTICIP:9200"] to be the IP of your elasticsearch server.
Enable and restart client stack services.
[email protected]# systemctl enable filebeat && systemctl restart filebeat
[email protected]# systemctl enable packetbeat && systemctl restart packetbeat
[email protected]# systemctl enable wazuh-agent && systemctl restart wazuh-agent
[email protected]# osqueryctl start
Refresh your Kibana browser, and go back to the Management app to create index patterns for packetbeat-* and filebeat-*.
Congratulations. Setup is complete. Check out the cool stuff under Dashboards, Visualizations, and Discover in Kibana!
A few notes about the client services:
-
The current osquery configuration file schedules certain query packs to run, rather than facilitating real-time querying. Osquery supports real-time querying/management, and can be scaled out using options such as Fleet or Doorman.
-
When using Redis output for any of the beats, there will be no compression. The workaround for this is to architect a pipeline such that logstash is used as a sort of "decompression proxy" before the data goes into Redis.
Portability
For ease of documentation, both the client and server systems are running 64-bit Ubuntu 16.04 LTS. All of the client and server components can run on DEB, RPM, and Windows-based operating systems. Porting the software and config files to a different OS should be very straightforward.
Questions
How is the performance?
Great! For some simple testing and capacity planning, we used a 3 node cluster with 2 data nodes, and 1 master/search node. The data nodes ran with 4 cores and 16GB or RAM. There were no special storage requirements. Our testing demonstrated that we were able to index over 100 million events in a 24 hour period (more than 1,000 EPS) without running into any memory, CPU, or disk issues. The data nodes were able to keep up with massive EPS spikes without needing a queuing mechanism, such as Redis. We probably could have more than quadrupled our EPS ingest without having to grow the cluster, aside from storage. In production it is recommended to have something in the pipeline for queuing.
How is this different from Security Onion?
Architecturally, I'd say significantly different but it's also not designed to be as off-the-shelf as Security Onion. One of the big benefits of SIAC is that at its core, it's nothing more than FOSS packages and configuration files. This means that you can import this data into config management or automation software, such as Salt and Terraform, and stand up your own SIAC in a matter of minutes.
Does it handle CloudTrail logs?
Yes. See here.
How come you didn't use a certain component?
There's a lot of things that could be added to the stack, or swapped out for something else but again, the project exists to demonstrate a particular concept. The client and server stacks are very modular, so adding or substituting components shouldn't be too difficult.
Why Packetbeat as opposed to Bro?
Bro is a perfectly acceptable component for this stack. For our R&D purposes, we were dealing with a pure AWS workload, so the concept of a network TAP doesn't exist. We could have worked around that with a Bro cluster, but that would have been a bit more difficult to administer for a PoC. The reason for this is the Bro cluster architecture. In a cloud-based environment, Bro's clustered architecture requires the implementation of worker, proxy, and manager nodes. The manager node serves a very important role:
It receives log messages and notices from the rest of the nodes in the cluster using the Bro communications protocol (note that if you are using a logger, then the logger receives all logs instead of the manager). The result is a single log instead of many discrete logs that you have to combine in some manner with post-processing. The manager also takes the opportunity to de-duplicate notices, and it has the ability to do so since it’s acting as the choke point for notices and how notices might be processed into actions (e.g., emailing, paging, or blocking).
Packetbeat has a built-in facility for avoiding duplicate records with less architectural complexity.
What about Windows support?
This is all cross-platform. The big thing you'd be missing on your client stack is the Windows equivelant of auditd. To ameloriate this, I would recommend looking at Winlogbeat and sysmon used in conjunction with SwiftOnSecurity's sysmon config. Also of interest might be the sysmon configs by Olaf Hartong and ion-storm.
What kind of alerting is available?
This stack has none, but that's an easy problem to solve. The Wazuh manager can be configured to alert through PagerDuty, Slack, and email. For an Elasticsearch or Kibana plugin, please explore options like Sentinl, ElastAlert, or 411. The latter options allow for more complex alerting.
How customizable is it?
Extremely. All dashboards, vizualizations, index patterns, saved searches, etc. are customizable and can be saved. Since Wazuh is a fork of OSSEC, there is of course support for creating your own custom rules and decoders.
How does data retention work?
Time/volume for data storage is up to the user. By default, the indexes will roll over every 24 hours and start new indexes in the format of indexname-YYYY.MM.dd. Closing, deleting, and managing indexes can be accomplished with curator.
What about updating?
The components outlined here will all work in harmony so long as you keep your Elasticsearch, Kibana, Wazuh, and Beats versions pinned to 6.2.0(Elastic) and 3.2.0 (Wazuh). If you want to update any of these packages, your biggest dependency will be to make sure that the Wazuh Kibana app has been updated to support your target elasticsearch/Kibana version. And of course, test everything prior to upgrading in production.
What might a distributed architecture look like?
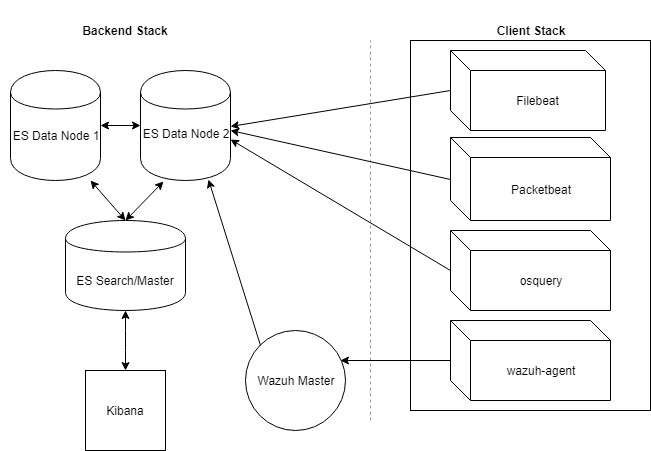
There's lots of different ways to build an ELK stack, and your data pipeline may look different depending on what works best in your environment. Based on the components in this project, you may wish to use the below as a starting point. This gives you a 3 node ES cluster with two data nodes, and one dedicated search/master node. Kibana is broken out as a separate component and pointed at the ES master node for search. The Wazuh manager node is split off to its own system. Data from the Wazuh master is pushed to one of your ingest nodes. With regard to the client stack, filebeat, packetbeat, and osquery data would be shipped directly to one of your ingest nodes as well. The Wazuh agent would talk directly to the manager node.
Notices
Distributed under the Apache License 2.0
Developed by Andrew Brooks of CityBase
Special thanks to CityBase, my peers for helping with documentation review, and the many people and projects that inspired this.
THIS SOFTWARE IS PROVIDED "AS IS" AND ANY EXPRESSED OR IMPLIED WARRANTIES, INCLUDING, BUT NOT LIMITED TO, THE IMPLIED WARRANTIES OF MERCHANTABILITY AND FITNESS FOR A PARTICULAR PURPOSE ARE DISCLAIMED. IN NO EVENT SHALL THE REGENTS OR CONTRIBUTORS BE LIABLE FOR ANY DIRECT, INDIRECT, INCIDENTAL, SPECIAL, EXEMPLARY, OR CONSEQUENTIAL DAMAGES (INCLUDING, BUT NOT LIMITED TO, PROCUREMENT OF SUBSTITUTE GOODS OR SERVICES; LOSS OF USE, DATA, OR PROFITS; OR BUSINESS INTERRUPTION) HOWEVER CAUSED AND ON ANY THEORY OF LIABILITY, WHETHER IN CONTRACT, STRICT LIABILITY, OR TORT (INCLUDING NEGLIGENCE OR OTHERWISE) ARISING IN ANY WAY OUT OF THE USE OF THIS SOFTWARE, EVEN IF ADVISED OF THE POSSIBILITY OF SUCH DAMAGE.

