slic-watch


![]()
SLIC Watch provides a CloudWatch Dashboard and Alarms for:
- AWS Lambda
- API Gateway
- DynamoDB
- Kinesis Data Streams
- SQS Queues
- Step Functions
- ECS (Fargate or EC2)
- SNS
- EventBridge
Currently, SLIC Watch is available as a Serverless Framework plugin. Serverless Framework v2 and v3 are supported.
Getting Started
📦 Install the plugin:
npm install serverless-slic-watch-plugin --save-dev
🖋️ Add the plugin to thepluginssection ofserverless.yml:
plugins:
  - serverless-slic-watch-plugin
🪛 Optionally, add some configuration for the plugin to thecustom -> slicWatchsection ofserverless.yml. Here, you can specify a reference to the SNS topic for alarms. This is optional, but it's usually something you want so you can receive alarm notifications via email, Slack, etc.
custom:
  slicWatch:
    topicArn: {'Fn::Ref': myTopic}
See the Configuration section below for more detailed instructions on fine tuning SLIC Watch to your needs.
🚢 Deploy your application in the usual way, for example:
sls deploy
👀 Head to the CloudWatch section of the AWS Console to check out your new dashboards📊 and alarms⏰ !
Features
CloudWatch Alarms and Dashboard widgets are created for all supported resources in the CloudFormation stack generated by The Serverless Framework. This includes generated resources as well as resources specifed explicitly in the resources section.
Any feature can be configured or disabled completely - see the section on configuration to see how.
Lambda Functions
Lambda Function alarms are created for:
- Errors
- Throttles, as a percentage of the number of invocations
- Duration, as a percentage of the function's configured timeout
- Invocations, disabled by default
- IteratorAge, for function's triggered by an Event Source Mapping
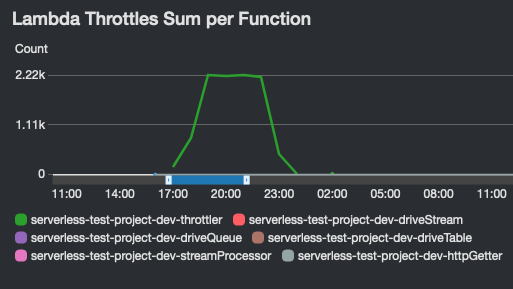
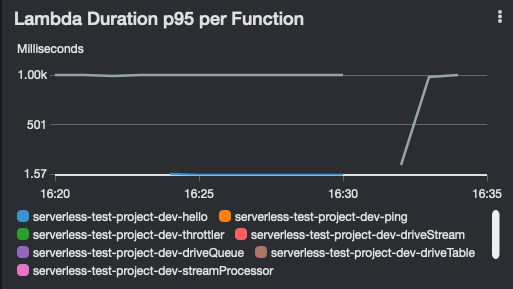
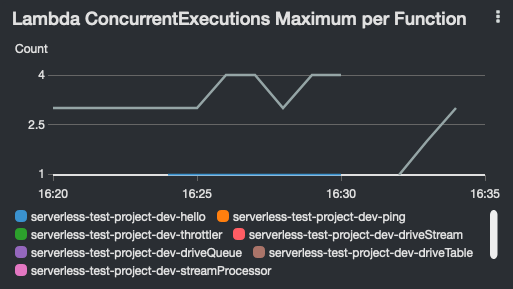
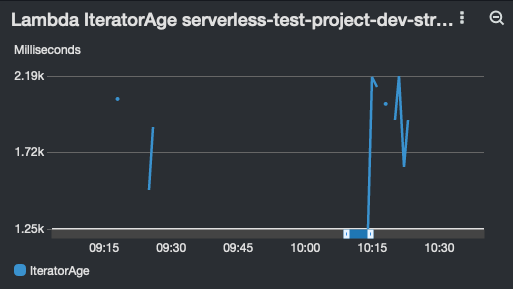
Lambda dashboard widgets show:
| Errors | Throttles | Duration Average, P95 and Maximum |
|---|---|---|
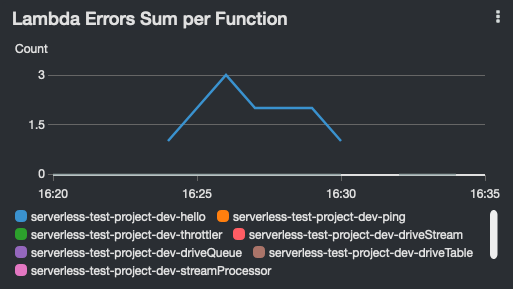 |
 |
 |
| Invocations | Concurrent Executions | Iterator Age |
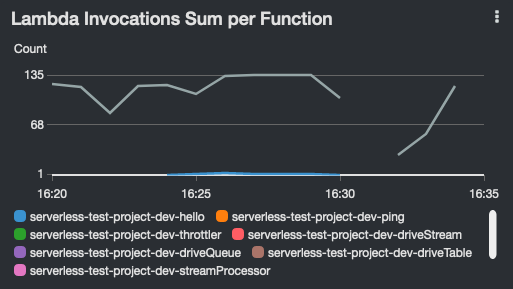 |
 |
 |
API Gateway
API Gateway alarms are created for:
- 5XX Errors
- 4XX Errors
- Latency
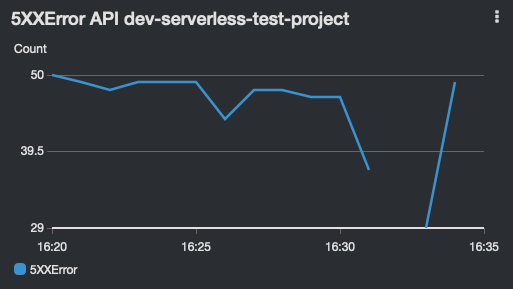
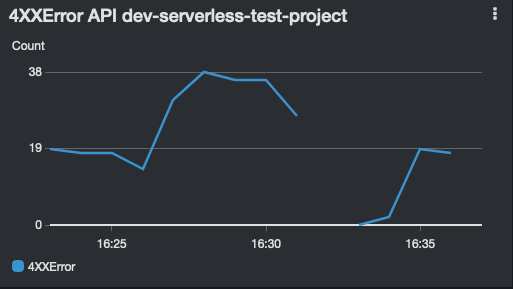
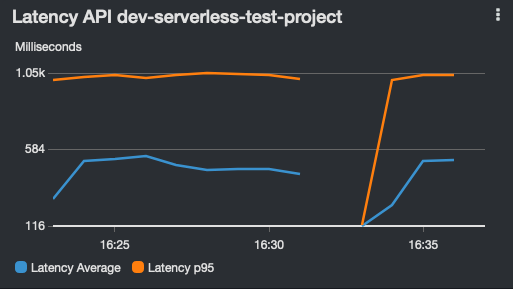
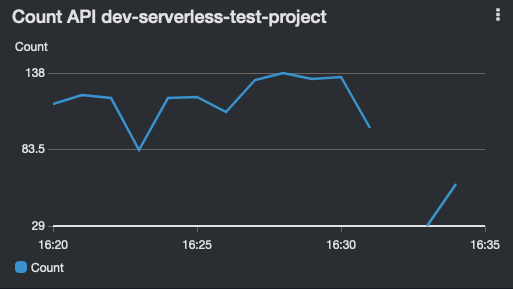
API Gateway dashboard widgets show:
| 5XX Errors | 4XX Errors | Latency | Count |
|---|---|---|---|
 |
 |
 |
 |
DynamoDB
DynamoDB alarms are created for:
- Read Throttle Events (Table and GSI)
- Write Throttle Events (Table and GSI)
- UserErrors
- SystemErrors
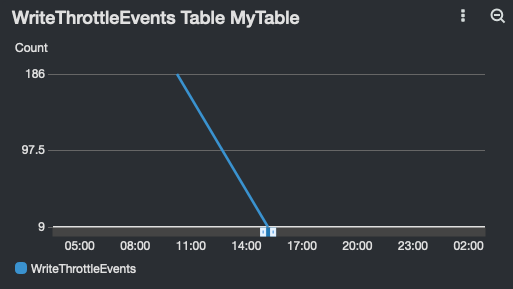
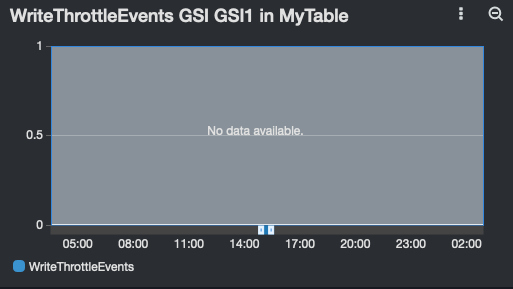
Dashboard widgets are created for tables and GSIs: dynamodbGSIReadThrottle.png dynamodbGSIWriteThrottle.png dynamodbTableWriteThrottle.png
| ReadThrottleEvents (Table) | WriteThrottleEvent (Table) |
|---|---|
 |
|
| ReadThrottleEvents (GSI) | WriteThrottleEvent (GSI) |
 |
|
Kinesis Data Streams
Kinesis data stream alarms are created for:
- Iterator Age
- Read Provisioned Throughput Exceeded
- Write Provisioned Throughput Exceeded
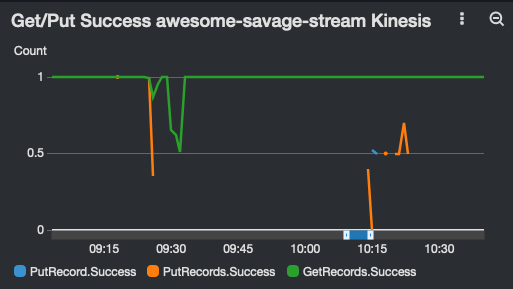
- PutRecord.Success
- PutRecords.Success
- GetRecords.Success
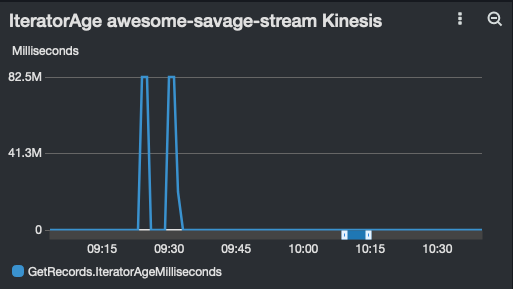
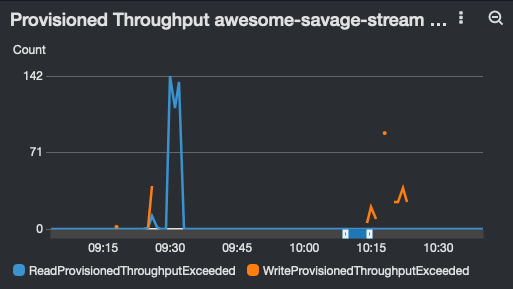
Kinesis data stream dashboard widgets show:
| Iterator Age | Read Provisioned Throughput Exceeded | Write Provisioned Throughput Exceeded |
|---|---|---|
 |
 |
 |
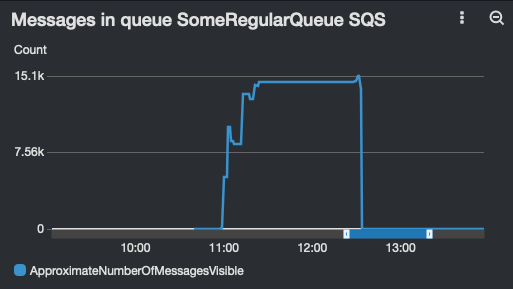
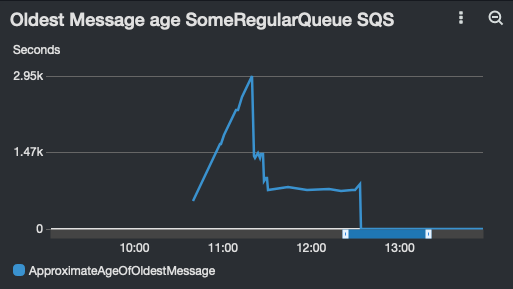
SQS Queues
SQS Queue alarms are create for:
- Age Of Oldest Message (disabled by default). If enabled, a threshold in seconds should be specified.
- In Flight Messages Percentage. This is a percentage of the AWS hard limits (20,000 messages for FIFO queues and 120,000 for standard queues).
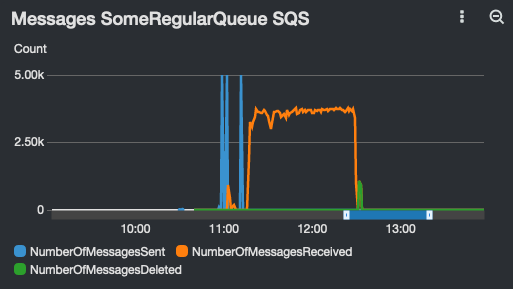
SQS queue dashboard widgets show:
| Messages Sent, Received and Deleted | Messages Visible | Age of Oldest Message |
|---|---|---|
 |
 |
 |
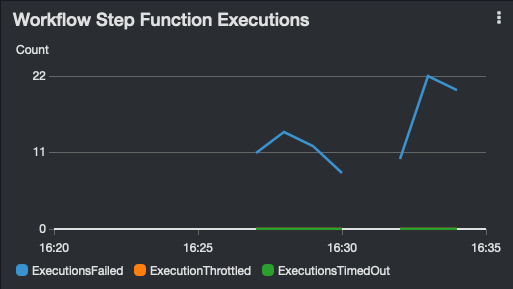
Step Functions
Step Function alarms are created for:
- Execution Throttled
- Executions Failed
- Executions Timed Out
The dashboard contains one widget per Step Function:
| ExecutionsFailed ExecutionThrottled, ExecutionsTimedOut |
|---|
 |
ECS / Fargate
ECS alarms are created for Fargate or EC2 clusters:
- Memory Utilization
- CPU Utilization
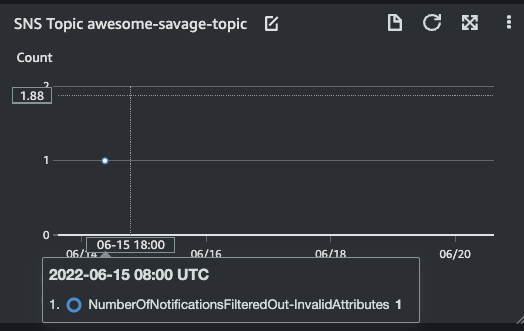
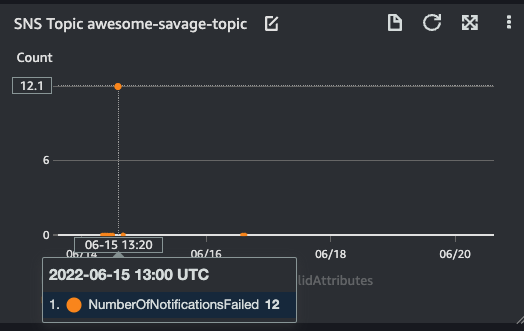
SNS
SNS alarms are created for:
- Number of Notifications Filtered Out due to Invalid Attributes
- Number of Notifications Failed
SNS Topic dashboard widgets show:
| Messages Filtered Out - Invalid Attributes | Notifications Failed |
|---|---|
 |
 |
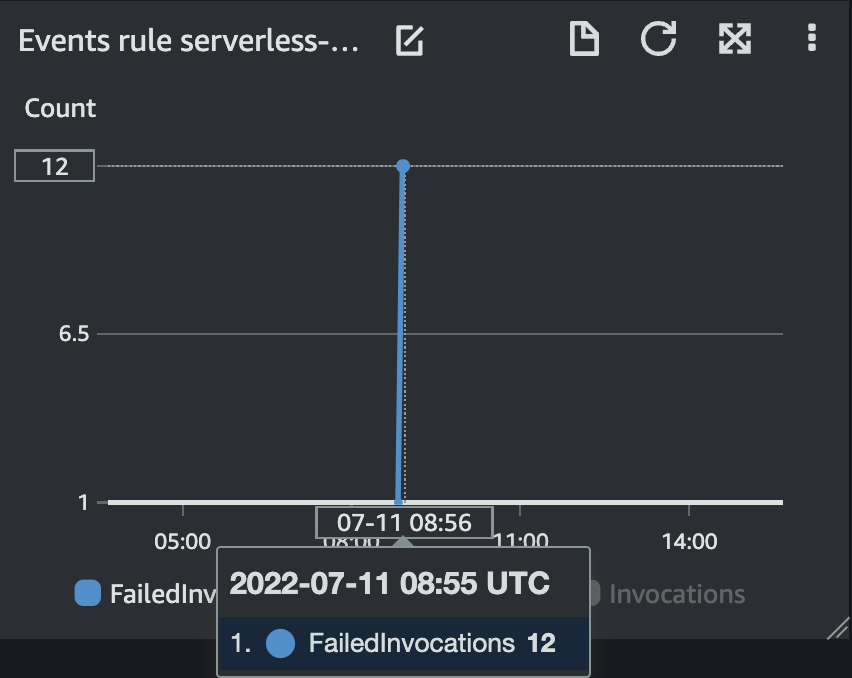
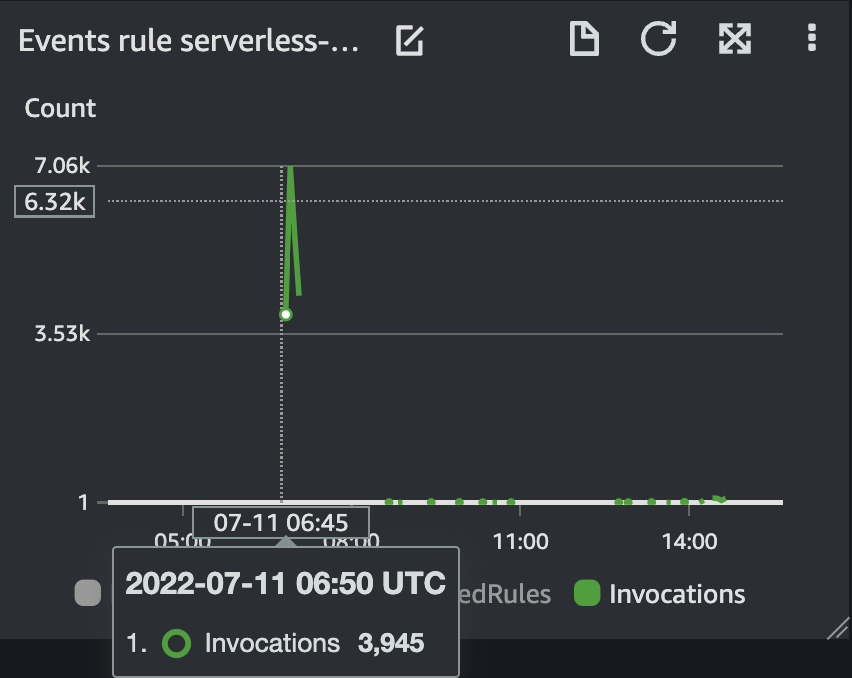
EventBridge
EventBridge alarms are created for:
- Failed Invocations
- Throttled Rules
EventBridge Rule dashboard widgets show:
| Failed Invocations | Invocations |
|---|---|
 |
 |
Configuration
Configuration is entirely optional - SLIC Watch provides defaults that work out of the box.
Note: Alarm configuration is cascading. This means that configuration properties are automatically propagated from parent to children nodes (unless an override is present at the given node).
You can customize the configuration:
- at the top level, for all resources in each service, and/or
- at the level of individual functions.
Plugin configuration
Top-level plugin configuration can be specified in the custom → slicWatch section of serverless.yml
- The
topicArnmay be optionally provided as an SNS Topic destination for all alarms. If you omit the topic, alarms are still created but are not sent to any destination. - Alarms or dashboards can be disabled at any level in the configuration by adding
enabled: false. You can even disable all plugin functionality by specifyingenabled: falseat the top-level plugin configuration.
Supported options along with their defaults are shown below.
# ...

custom:
  slicWatch:
    topicArn: SNS_TOPIC_ARN  # This is optional but recommended so you can receive alarms via email, Slack, etc.
    enabled: true

    alarms:
      enabled: true
      Period: 60
      EvaluationPeriods: 1
      TreatMissingData: notBreaching
      ComparisonOperator: GreaterThanThreshold
      Lambda: # Lambda Functions
        Errors:
          Threshold: 0
          Statistic: Sum
        ThrottlesPc: # Throttles are evaluated as a percentage of invocations
          Threshold: 0
        DurationPc: # Duration is evaluated as a percentage of the function timeout
          Threshold: 95
          Statistic: Maximum
        Invocations: # No invocation alarms are created by default. Override threshold to create alarms
          enabled: false # Note: this one requires both `enabled: true` and `Threshold: someValue` to be effectively enabled
          Threshold: null
          Statistic: Sum
        IteratorAge:
          Threshold: 10000
          Statistic: Maximum
      ApiGateway: # API Gateway REST APIs
        5XXError:
          Statistic: Average
          Threshold: 0
        4XXError:
          Statistic: Average
          Threshold: 0.05
        Latency:
          ExtendedStatistic: p99
          Threshold: 5000
      States: # Step Functions
        Statistic: Sum
        ExecutionsThrottled:
          Threshold: 0
        ExecutionsFailed:
          Threshold: 0
        ExecutionsTimedOut:
          Threshold: 0
      DynamoDB:
        # Consumed read/write capacity units are not alarmed. These should either
        # be part of an auto-scaling configuration for provisioned mode or should be automatically
        # avoided for on-demand mode. Instead, we rely on persistent throttling
        # to alert failures in these scenarios.
        # Throttles can occur in normal operation and are handled with retries. Threshold should
        # therefore be configured to provide meaningful alarms based on higher than average throttling.
        Statistic: Sum
        ReadThrottleEvents:
          Threshold: 10
        WriteThrottleEvents:
          Threshold: 10
        UserErrors:
          Threshold: 0
        SystemErrors:
          Threshold: 0
      Kinesis:
        GetRecords.IteratorAgeMilliseconds:
          Statistic: Maximum
          Threshold: 10000
        ReadProvisionedThroughputExceeded:
          Statistic: Maximum
          Threshold: 0
        WriteProvisionedThroughputExceeded:
          Statistic: Maximum
          Threshold: 0
        PutRecord.Success:
          ComparisonOperator: LessThanThreshold
          Statistic: Average
          Threshold: 1
        PutRecords.Success:
          ComparisonOperator: LessThanThreshold
          Statistic: Average
          Threshold: 1
        GetRecords.Success:
          ComparisonOperator: LessThanThreshold
          Statistic: Average
          Threshold: 1
        SQS:
          # approximate age of the oldest message in the queue above threshold: messages aren't processed fast enough
          AgeOfOldestMessage:
            Statistic: Maximum
            enabled: false # Note: this one requires both `enabled: true` and `Threshold: someValue` to be effectively enabled
            Threshold: null
          # approximate number of messages in flight above threshold (in percentage of hard limit: 120000 for regular queues and 20000 for FIFO queues)
          InFlightMessagesPc:
            Statistic: Maximum
            Threshold: 80 # 80% of 120.000 for regular queues or 80% of 20000 for FIFO queues
        ECS:
          MemoryUtilization:
            Statistic: Average
            Threshold: 90
          CPUUtilization:
            Statistic: Average
            Threshold: 90
        SNS:
          NumberOfNotificationsFilteredOut-InvalidAttributes:
            Statistic: Sum
            Threshold: 1
          NumberOfNotificationsFailed:
            Statistic: Sum
            Threshold: 1
        Events:
          #EventBridge
          FailedInvocations:
            Statistic: Sum
            Threshold: 1
          ThrottledRules:
            Statistic: Sum
            Threshold: 1

    dashboard:
      enabled: true
      timeRange:
        # For possible 'start' and 'end' values, see
        # https:# docs.aws.amazon.com/AmazonCloudWatch/latest/APIReference/CloudWatch-Dashboard-Body-Structure.html
        start: -PT3H
      metricPeriod: 300
      widgets:
        metricPeriod: 300
        width: 8
        height: 6
        Lambda:
          # Metrics per Lambda Function
          Errors:
            Statistic: ['Sum']
          Throttles:
            Statistic: ['Sum']
          Duration:
            Statistic: ['Average', 'p95', 'Maximum']
          Invocations:
            Statistic: ['Sum']
          ConcurrentExecutions:
            Statistic: ['Maximum']
          IteratorAge:
            Statistic: ['Maximum']
        ApiGateway:
          5XXError:
            Statistic: ['Sum']
          4XXError:
            Statistic: ['Sum']
          Latency:
            Statistic: ['Average', 'p95']
          Count:
            Statistic: ['Sum']
        States:
          # Step Functions
          ExecutionsFailed:
            Statistic: ['Sum']
          ExecutionsThrottled:
            Statistic: ['Sum']
          ExecutionsTimedOut:
            Statistic: ['Sum']
        DynamoDB:
          # Tables and GSIs
          ReadThrottleEvents:
            Statistic: ['Sum']
          WriteThrottleEvents:
            Statistic: ['Sum']
        Kinesis:
          # Kinesis Data Streams
          GetRecords.IteratorAgeMilliseconds:
            Statistic: ['Maximum']
          ReadProvisionedThroughputExceeded:
            Statistic: ['Sum']
          WriteProvisionedThroughputExceeded:
            Statistic: ['Sum']
          PutRecord.Success:
            Statistic: ['Average']
          PutRecords.Success:
            Statistic: ['Average']
          GetRecords.Success:
            Statistic: ['Average']
        SQS:
          # SQS Queues
          NumberOfMessagesSent:
            Statistic: ["Sum"]
          NumberOfMessagesReceived:
            Statistic: ["Sum"]
          NumberOfMessagesDeleted:
            Statistic: ["Sum"]
          ApproximateAgeOfOldestMessage:
            Statistic: ["Maximum"]
          ApproximateNumberOfMessagesVisible:
            Statistic: ["Maximum"]
        ECS:
          MemoryUtilization:
            Statistic: ["Average"]
          CPUUtilization:
            Statistic: ["Average"]
        SNS:
          NumberOfNotificationsFilteredOut-InvalidAttributes:
            Statistic: ["Sum"]
          NumberOfNotificationsFailed:
            Statistic: ["Sum"]
        Events:
          #EventBridge
          FailedInvocations:
            Statistic: ["Sum"]
          ThrottledRules:
            Statistic: ["Sum"]
          Invocations:
            Statistic: ["Sum"]
An example project is provided for reference: serverless-test-project
Function-level configuration
For each function, add the slicWatch property to configure specific overrides for alarms and dashboards relating to the AWS Lambda Function resource.
functions:
  hello:
    handler: basic-handler.hello
    slicWatch:
      dashboard:
        enabled: false    # No Lambda widgets will be created for this function
      alarms:
        Lambda:
          Invocations:
            Threshold: 2  # The invocation threshold is specific to
                          # this function's expected invocation count
To disable all alarms for any given function, use:
functions:
  hello:
    handler: basic-handler.hello
    slicWatch:
      alarms:
        Lambda:
          enabled: false
A note on CloudWatch cost
This plugin creates additional CloudWatch resources that, apart from a limited free tier, have an associated cost. Depending on what you enable, SLIC Watch creates one dashboard and multiple alarms. The number of each depend on the number of resources in your stack and the number of stacks you have.
Check out the AWS CloudWatch Pricing page to understand the cost impact of creating CloudWatch resources.
References
Other Projects
- serverless-plugin-aws-alerts
- Real World Serverless Application - Serverless Operations
- CDK Watchful
- CDK Patterns - The CloudWatch Dashboard
Reading
- AWS Well Architected Serverless Applications Lens
- How to Monitor Lambda with CloudWatch Metrics - Yan Cui
LICENSE
Apache - LICENSE