All Projects → Volorf → Sparkliner

Volorf / Sparkliner

Sparkliner — easy way to make sparkline graph [Sketch plugin]

Programming Languages

javascript
184084 projects - #8 most used programming language

Projects that are alternatives of or similar to Sparkliner

Keys For Sketch
Advanced shortcut manager for Sketch app.
Stars: ✭ 281 (+52.72%)
Mutual labels:  sketch-app, plugin, sketch
Interactive machine learning
IPython widgets, interactive plots, interactive machine learning
Stars: ✭ 140 (-23.91%)
Mutual labels:  statistics, analytics
Sketch Batch Create Symbols
A plugin for Sketch to convert selected layers to individual symbols.
Stars: ✭ 134 (-27.17%)
Mutual labels:  sketch-app, sketch
Design Of Experiment Python
Design-of-experiment (DOE) generator for science, engineering, and statistics
Stars: ✭ 143 (-22.28%)
Mutual labels:  statistics, analytics
Protostuff
Java serialization library, proto compiler, code generator
Stars: ✭ 1,730 (+840.22%)
Mutual labels:  graph, json
Reddit Detective
Play detective on Reddit: Discover political disinformation campaigns, secret influencers and more
Stars: ✭ 129 (-29.89%)
Mutual labels:  graph, analytics
Fake Chinese Name For Sketch
生成随机中文人名的 Sketch 插件
Stars: ✭ 141 (-23.37%)
Mutual labels:  plugin, sketch
Awesome Sketch Based Applications
📚 A collection of sketch based application papers.
Stars: ✭ 117 (-36.41%)
Mutual labels:  sketch-app, sketch
Lagmonitor
Monitor performance of your Minecraft server. Similar to VisualVM and Java Mission Control.
Stars: ✭ 147 (-20.11%)
Mutual labels:  graph, plugin
Open Sketch
[deprecated] Change the design work. Version control for design file.
Stars: ✭ 162 (-11.96%)
Mutual labels:  json, sketch
Stats
A well tested and comprehensive Golang statistics library package with no dependencies.
Stars: ✭ 2,196 (+1093.48%)
Mutual labels:  statistics, analytics
G2
📊 A highly interactive data-driven visualization grammar for statistical charts.
Stars: ✭ 11,020 (+5889.13%)
Mutual labels:  graph, statistics
Sketch Potrace
Potrace for Sketch is a bitmap tracing plugin. It converts bitmap images into monochrome vector graphics.
Stars: ✭ 122 (-33.7%)
Mutual labels:  sketch-app, sketch
Exporter
A Sketch plugin that exports Sketch artboards into clickable HTML file.
Stars: ✭ 131 (-28.8%)
Mutual labels:  sketch-app, sketch
Qqlight Websocket
QQLight机器人WebSocket-RPC插件,让你能够使用任何语言编写QQ机器人程序
Stars: ✭ 118 (-35.87%)
Mutual labels:  json, plugin
Logodrop
A Sketch Plugin to get brand logos right into Sketch App.
Stars: ✭ 140 (-23.91%)
Mutual labels:  plugin, sketch
Icondrop
Get access to 2 million+ design resources right inside Adobe Xd, Figma, Sketch, Microsoft Office, G Suite and many more.
Stars: ✭ 174 (-5.43%)
Mutual labels:  plugin, sketch
Sketch Json
Transform sketch files to json and json to sketch files
Stars: ✭ 113 (-38.59%)
Mutual labels:  json, sketch
Sketch Select
🖱 Make it much more convenient to select layers with similar attributes.
Stars: ✭ 114 (-38.04%)
Mutual labels:  sketch-app, sketch
Sketch Divine Proportions
Divine proportions toolkit for Sketch
Stars: ✭ 143 (-22.28%)
Mutual labels:  plugin, sketch

Sparkliner — easy way to make sparkline graph

A sparkline is a very small line chart, typically drawn without axes or coordinates. It presents the general shape of the variation (typically over time) in some measurement, such as temperature or stock market price, in a simple and highly condensed way.

How it works

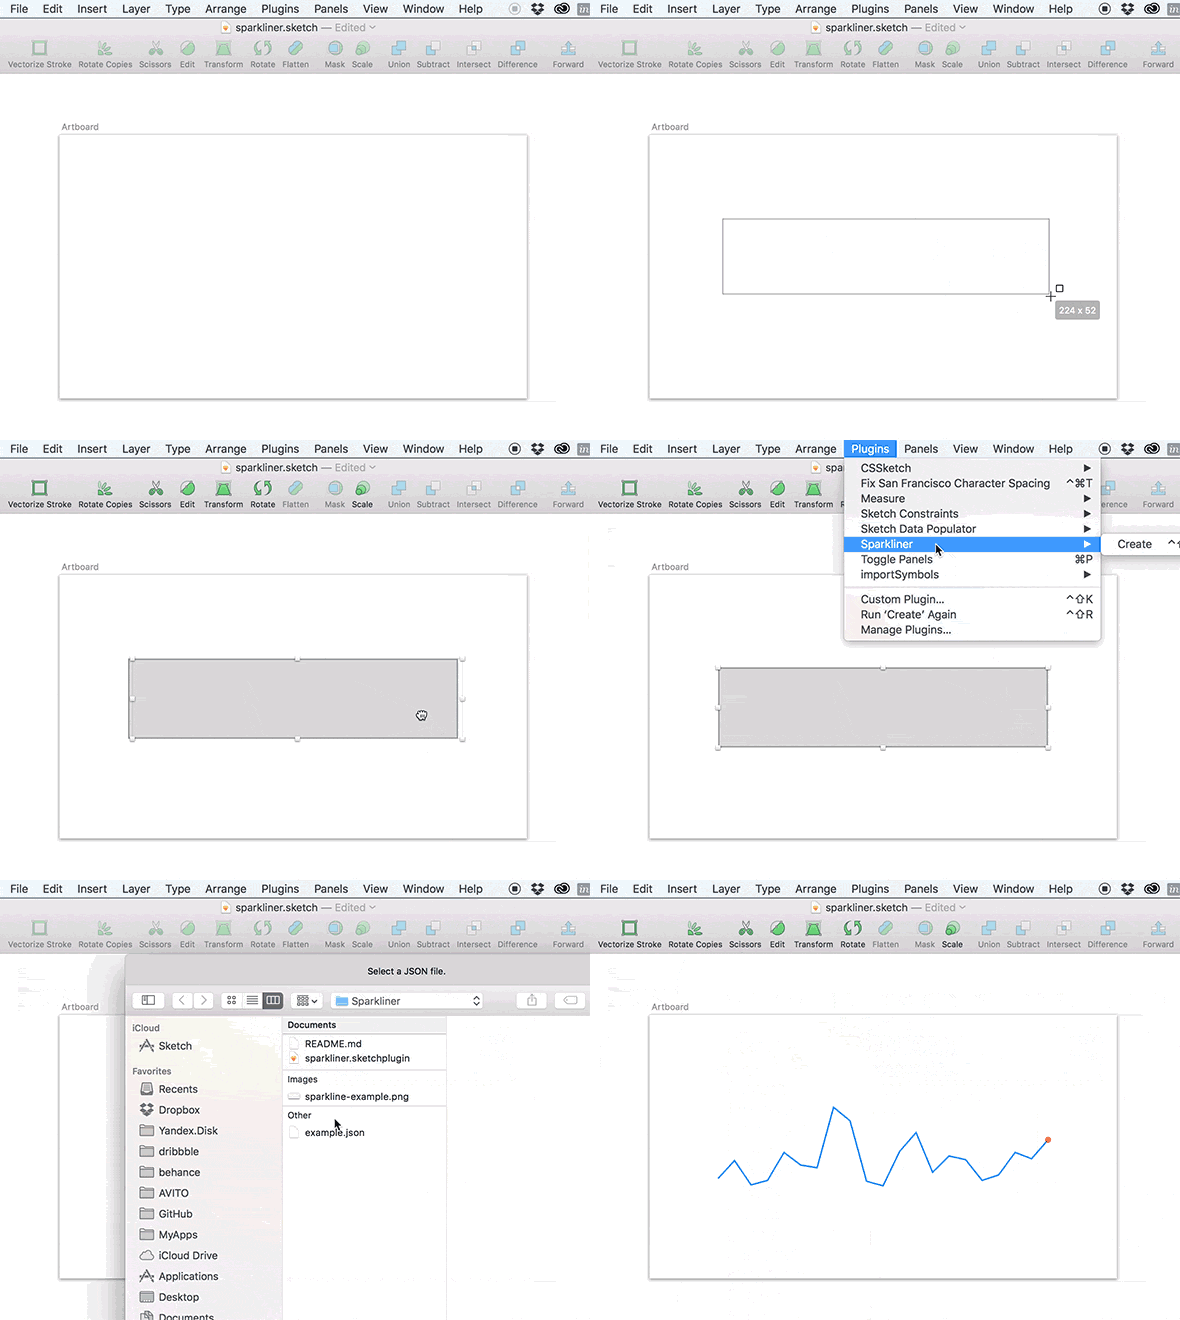
Gif more than thousand words

##Order

  1. Create an artboard;
  2. Create a start rectangle. It sets sizes of a future sparkline graph;
  3. Start command from menu or press shortcuts ctrl + shift + g;
  4. Find and import your JSON file;
  5. Get sparkline.

How install the plugin

  1. Download the zip file with the Sparkliner.
  2. Copy the contents to the Plugin Folder (Plugin > Manage Plugins... > Show Plugins Folder).

What do you need first

Sparkliner creates graph with JSON data. First your need have it. It looks like that (example.json):

{
  "dataArray": [10, 30, 3, 8, 39, 25, 22, 89, 74, 7, 2, 40, 61, 17, 35, 31, 8, 14, 39, 32, 53],
  "strokeColor": "#00AAFF",
  "thickness": 1,
  "displayEndPoint": true,
  "endPointColor": "#DD2020",
  "endPointRadius": 2,
  "removeInitialBox": true
}

Open the file in your favorite editor and change the values of the names how you need (e.g. "strokeColor" is a name. "#00AAFF" is its a value. Together they are a pair). Or create new one.

What are they

"dataArray" Data is an array. It defines a graph curve. Only numbers.

"strokeColor" Color of sparkline. You need to write HEX color here. Don't forget about "quotes".

"thickness" Thickness of line. Only one number.

"displayEndPoint" If it equals true sparkline is made with an end marker. If it equals false - it is not.

"endPointColor" Color of end marker. It needs a HEX.

"endPointRadius" Radius of end marker. Only one number.

"removeInitialBox" It is start rectangle that set sizes of sparkline graph. By default plugin removes it. If you need it you can set false.

Links

Linkedin | Dribbble | Facebook

Note that the project description data, including the texts, logos, images, and/or trademarks, for each open source project belongs to its rightful owner. If you wish to add or remove any projects, please contact us at [email protected].