Prometheus Metrics for Splunk
Prometheus prometheus.io, a Cloud Native Computing Foundation project, is a systems and service monitoring system. It collects metrics from configured targets at given intervals, evaluates rule expressions, displays the results, and can trigger alerts if some condition is observed to be true.
Splunk splunk.com is a platform for machine data analysis, providing real-time visibility, actionable insights and intelligence across all forms of machine data. Splunk Enterprise since version 7.0 includes the Metrics store for large-scale capture and analysis of time-series metrics alongside log data.
This Splunk add-on provides two modular inputs to ingest Splunk metrics from Prometheus:
[prometheus://]
A scraping input which polls a Prometheus exporter and indexes all exposed metrics in Splunk.
It is also designed to be able to poll a Prometheus servers "/federate" endpoint, so that Prometheus can be responsible for all the metrics gathering details (e.g. service discovery and label rewriting) and Splunk can easily ingest a desired subset of metrics from Prometheus at the desired resolution. In this way it acts much like Prometheus hierarchical federation.
It will also successfully scrape a statically configured Prometheus exporter, and for this use case does not require a Prometheus server at all.
[prometheusrw://]
A bridge so that the Prometheus remote-write feature can continuously push metrics to a Splunk Enterprise system. When installed and enabled, this input will add a new listening port to your Splunk server which can be the remote write target for multiple Prometheus servers.
It has been designed to mimic the Splunk HTTP Event Collector for it's configuration, however the endpoint is much simpler as it only supports Prometheus remote-write. The HEC is not used for this as Prometheus remote-write requires Speedy compression and Protocol Buffer encoding, both of which do not work with the HEC.
Requirements
- Splunk 8.x and above
- Prometheus 2.x
- Recent Linux x64
The most testing has been performed on Splunk 8.2 and Prometheus 2.36 on Ubuntu 20.04
Architecture overview
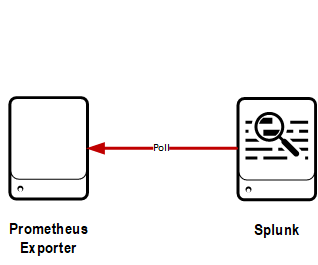
Static exporter
In this configuration, the modular input can poll any statically configured Prometheus exporter at a defined interval.
Pros:
- Simple
- Requires no Prometheus server
Cons:
- Static configuration only -- very manual to add lots of systems
- HA of Splunk polling is difficult
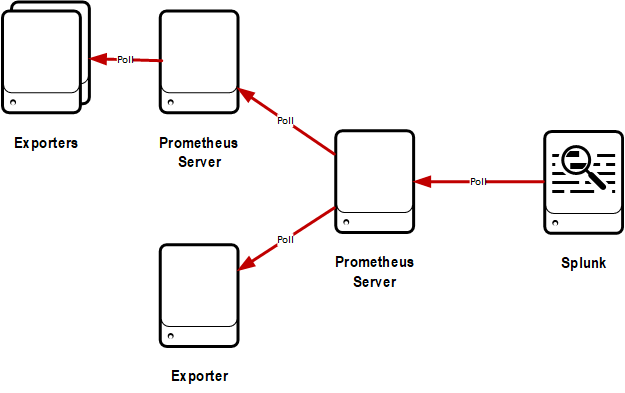
Federate server
With this configuration, the modular input is setup to poll a Prometheus server that is exposing the metrics from exporters and other Prometheus servers on it's federate endpoint.
Pros:
- Allows Prometheus to handle service discovery and other low-level functions
- High level of control of what Splunk gathers and when using polling interval and match vectors
- Allows scenarios such as using Prometheus to gather high-resolution metrics, and ingesting into Splunk at reduced frequency
Cons:
- HA of Splunk polling is difficult
- Could run into scalability issues if you want to gather large numbers of metrics from a single Prometheus server at a high rate
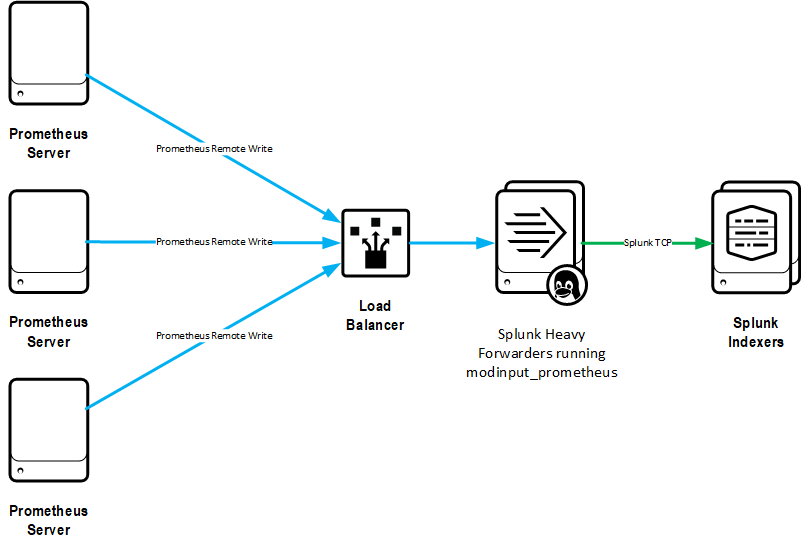
Prometheus remote-write
With this configuration, Prometheus pushes metrics to Splunk with it's remote_write functionality.
Pros:
- Most efficient way to ingest all, or nearly all, metrics from a Prometheus server into Splunk
- HA and scaling of Splunk ingestion is achievable with HTTP load balancers
Cons:
- Must send metrics to Splunk with same frequency as they are gathered into Prometheus
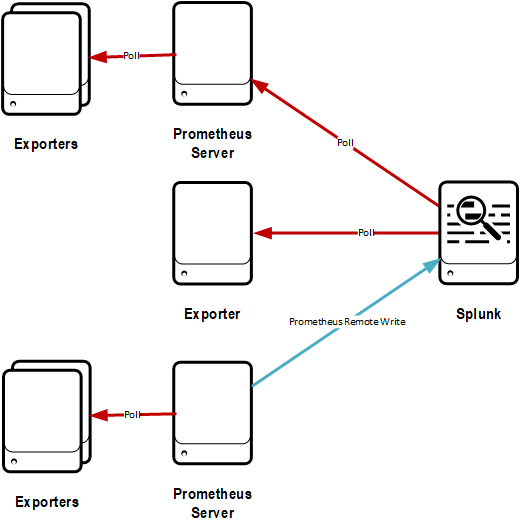
Hybrid
All metrics gathered by the above methods are in a consistent format in Splunk, and reporting over them will be no different no matter how they are gathered. Because of this, different ways of delivering metrics for different use cases could be implemented.
Download
This add-on will be hosted at apps.splunk.com in the near future. It will be uploaded there when some further testing has been completed.
In the meantime, the latest build is available in the Github releases tab.
Build
This assumes you have a relatively up-to-date Go build environment set up.
You will need some dependencies installed:
$ go get github.com/gogo/protobuf/proto
$ go get github.com/golang/snappy
$ go get github.com/prometheus/common/model
$ go get github.com/prometheus/prometheus/prompb
$ go get github.com/gobwas/glob
$ go get github.com/prometheus/prometheus/model/textparse
The "build" make target will build the modular input binaries, and copy them into the correct place in modinput_prometheus, which forms the root of the Splunk app.
$ make build
Install and configure
This add-on is installed just like any Splunk app: either through the web UI, deployment server or copying directly to $SPLUNK_HOME/etc/apps.
We recommend installing on a heavy forwarder, so the processing of events into metrics occurs at the collection point and not on indexers. The app is only tested on a heavy instance so far, but if you use a Universal Forwarder be sure to also install on your HFs/Indexers as there are index-time transforms to process the received metrics.
All available parameters for the modular inputs are described in inputs.conf.spec.
Static exporter
The most basic configuration to poll a Prometheus exporter.
e.g.
[prometheus://java-client-1]
URI = http://myhost:1234/metrics
index = prometheus
sourcetype = prometheus:metric
host = myhost
interval = 60
disabled = 0
The index should be a "metrics" type index. The sourcetype should be prometheus:metric, which is configured in the app to recognize the data format and convert it to Splunk metrics.
Federate server
This configuration is to gather all metrics from a Prometheus server. At least one valid "match" must be supplied in order to get any data from a Prometheus federation endpoint. Eatch "match" is entered with semicolon separation in the Splunk configuration. The example "match" string given here matches all metrics. You can learn more about how to configure metrics matching at: https://prometheus.io/docs/prometheus/latest/querying/basics/#instant-vector-selectors
[prometheus://prom-server-1]
URI = http://myhost:9090/federate
match = {__name__=~"..*"}
index = prometheus
sourcetype = prometheus:metric
host = myhost
interval = 60
disabled = 0
Prometheus remote-write
Only one HTTP server is ever run, which is configured by the [prometheusrw] input stanza. The individual inputs are then distinguished by bearer tokens. At least one of the individual inputs must be configured, and a matching bearer token must be supplied from Prometheus in order to direct the received metrics to that input.
e.g.
[prometheusrw]
port = 8098
maxClients = 10
disabled = 0

[prometheusrw://testing]
bearerToken = ABC123
index = prometheus
whitelist = *
sourcetype = prometheus:metric
disabled = 0

[prometheusrw://another]
bearerToken = DEF456
index = another_metrics_index
whitelist = net*
sourcetype = prometheus:metric
disabled = 0

[prometheusrw://parsed]
bearerToken = PAR042
index = another_metrics_index
whitelist = *
sourcetype = prometheus:metric
metricNamePrefix = DEV.
metricNameParse = true
disabled = 0
This starts the HTTP listener on port 8098, and any metrics coming in with a bearer token of "ABC123" will be directed to the "testing" input, wheras any received with a bearer token of "DEF456" will be directed to the "another" input. Not including a bearer token, or a non-matching token, will result in a HTTP 401 (Unauthorized).
At least one whitelist should be supplied, and a blacklist is also available. Whitelist and blacklist are comma-separated globs that match against an incoming metric name.
Although the input does allow some basic whitelist and blacklist behaviour against the metric name before ingesting in Splunk, it will be more efficient and flexible to do this on the Prometheus server using write_relabel_configs if that is possible. An example of dropping metrics withis way is shown in the configuration below.
In your Prometheus runtime YML file, ensure the following is set to start sending metrics to the prometheusrw Splunk input:
  remote_write:
    - url: "http://<hostname>:8098"
      bearer_token: "ABC123"
      write_relabel_configs:
        - source_labels: [__name__]
          regex:         expensive.*
          action:        drop
Full details of available Prometheus options are at: https://prometheus.io/docs/prometheus/latest/configuration/configuration/#%3Cremote_write%3E
Known Limitations
- Only Linux on x86_64 is tested for now.
- Validation of configuration is not very advanced -- incorrect configuration will not work with little indication as to why.
- Only some basic HTTP options are supported, which should be fine for basic Prometheus endpoints but may not work with various proxying methods etc.
- No user interface for configuring inputs at this stage, you'll have to do it all via inputs.conf.
- This add-on does not make much sense to run in Splunk Cloud, so no compatibility there. You should run this on a local Heavy Forwarder and forward the generated metrics to Splunk Cloud.
Binary File Declaration
All binaries built from source code at: https://github.com/lukemonahan/splunk_modinput_prometheus