All Projects → aboullaite → spring-boot-prometheus

aboullaite / spring-boot-prometheus

Licence: other
No description or website provided.

Programming Languages

java
68154 projects - #9 most used programming language

Projects that are alternatives of or similar to spring-boot-prometheus

ct-woodpecker
A tool to monitor a certificate transparency log for operational problems
Stars: ✭ 136 (+580%)
Mutual labels:  grafana
macropower-analytics-panel
It's like Google Analytics, but for Grafana dashboards!
Stars: ✭ 16 (-20%)
Mutual labels:  grafana
docker-telegraf-influxdb-grafana
Docker Image with Telegraf, InfluxDB and Grafana
Stars: ✭ 17 (-15%)
Mutual labels:  grafana
nifi-prometheus-reporter
A reporting task in Nifi which is capable of sending monitoring statistics as prometheus metrics to a prometheus pushgateway.
Stars: ✭ 48 (+140%)
Mutual labels:  grafana
boozer
Kegerator Monitoring Platform. RPi + Docker + Beer + Metrics + Slack. k3s kubernetes friendly.
Stars: ✭ 93 (+365%)
Mutual labels:  grafana
air-quality
Live dashboard for air quality in my home.
Stars: ✭ 70 (+250%)
Mutual labels:  grafana
grafana-csv-plugin
CSV datasource for Grafana 6.x.x / 7.x.x
Stars: ✭ 33 (+65%)
Mutual labels:  grafana
grafana-dashboards
List of Grafana Dashboards 📺
Stars: ✭ 120 (+500%)
Mutual labels:  grafana
kube-latency
Benchmark kubernetes' Pod network
Stars: ✭ 33 (+65%)
Mutual labels:  grafana
envsensor-observer-py
Python Bluetooth low energy observer example for OMRON Environment Sensor (2JCIE-BL01)
Stars: ✭ 31 (+55%)
Mutual labels:  grafana
docker-iot-stack
💻 My personal Docker IoT Stack
Stars: ✭ 24 (+20%)
Mutual labels:  grafana
metalnetes
Create and manage multiple Kubernetes clusters using KVM on a bare metal Fedora 29 server. Includes helm + rook-ceph + nginx ingress + the stock analysis engine (jupyter + redis cluster + minio + automated cron jobs for data collection) - works on Kubernetes version v1.16.0 - 1.16.3 was not working
Stars: ✭ 37 (+85%)
Mutual labels:  grafana
geostat
GeoStat, Python script for parsing Nginx and Apache logs files and getting GEO data from incoming IP's.
Stars: ✭ 50 (+150%)
Mutual labels:  grafana
rpi-monitoring-node
Automated installation of Grafana, Telegraf and influxdb for your Raspberry Pi
Stars: ✭ 18 (-10%)
Mutual labels:  grafana
grafonnet-playground
Playground for grafanna with jsonnet
Stars: ✭ 25 (+25%)
Mutual labels:  grafana
grafana-echarts-panel
Grafana集成Echarts
Stars: ✭ 49 (+145%)
Mutual labels:  grafana
ml-ops
Get your MLOps (Level 1) platform started and going fast.
Stars: ✭ 81 (+305%)
Mutual labels:  grafana
Go-gRPC-RabbitMQ-microservice
Go gRPC RabbitMQ email microservice
Stars: ✭ 107 (+435%)
Mutual labels:  grafana
monitoring-rancher
🤠How to Set up Rancher Server Monitoring with TIG Stack?
Stars: ✭ 22 (+10%)
Mutual labels:  grafana
grafana-operator
An operator for Grafana that installs and manages Grafana instances, Dashboards and Datasources through Kubernetes/OpenShift CRs
Stars: ✭ 449 (+2145%)
Mutual labels:  grafana

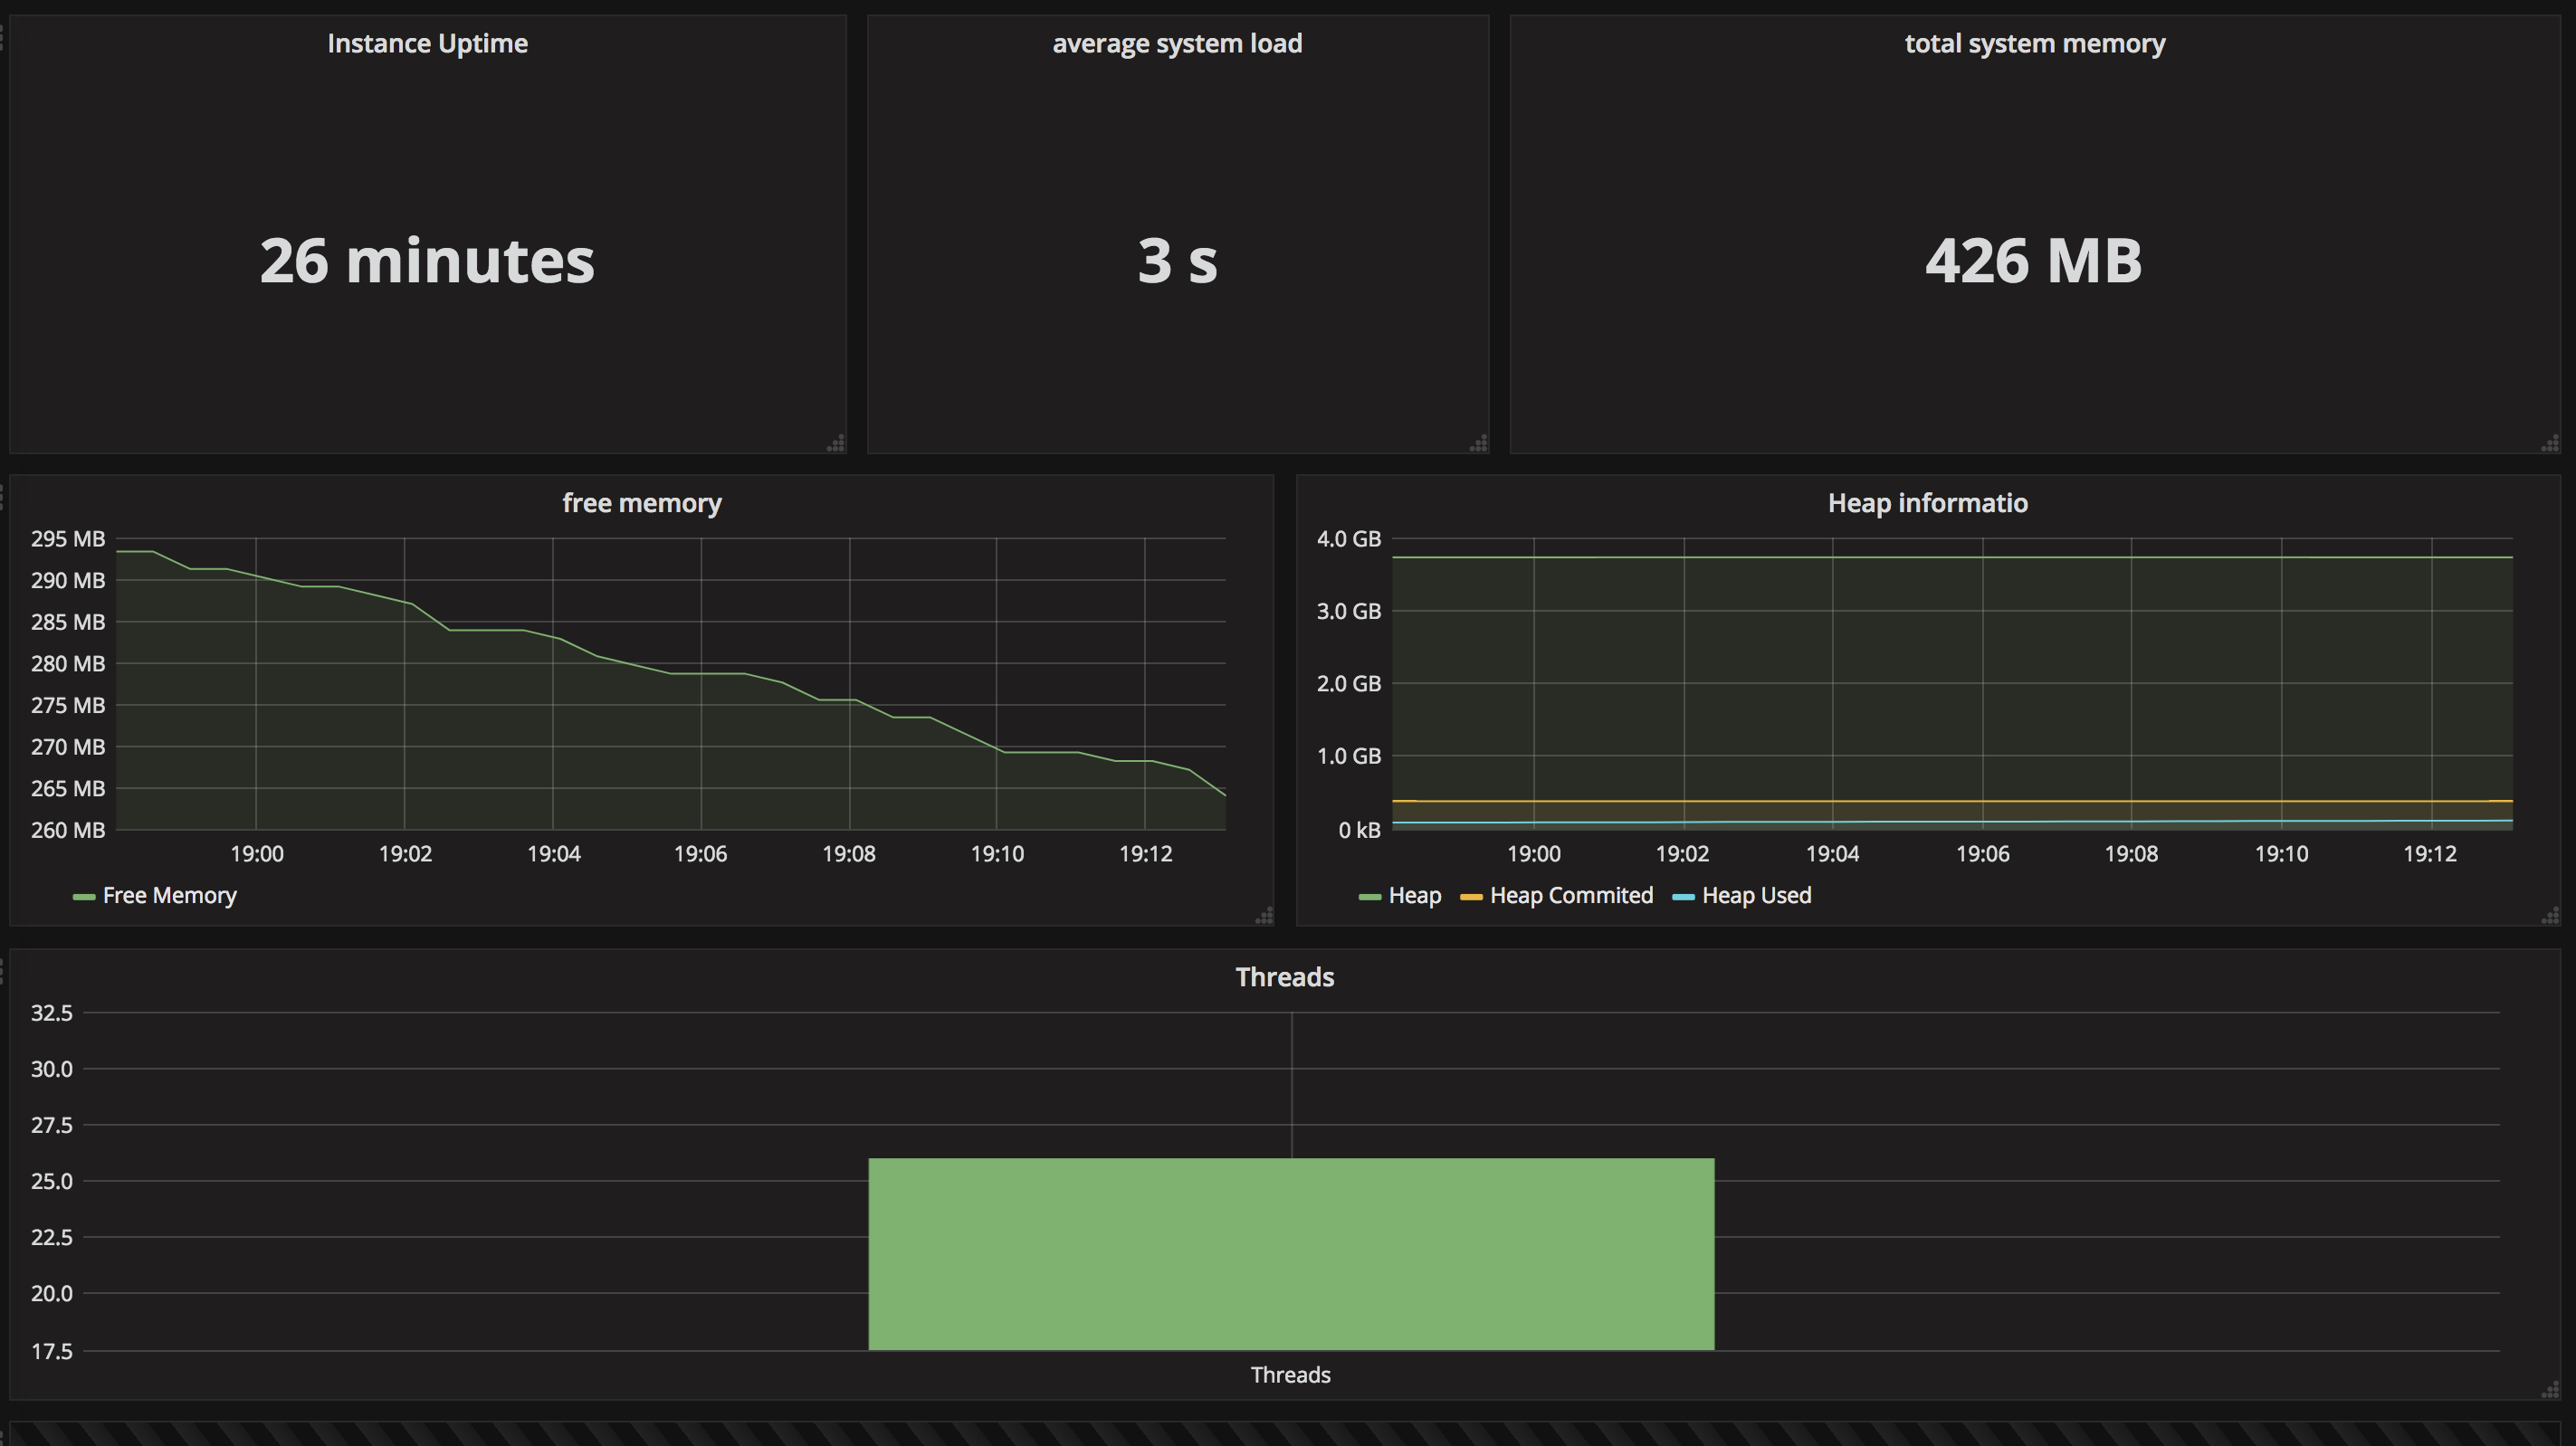
spring-boot-prometheus

a very minimalist example, that show how to configure Grapahana to scrap Spring Boot app metrics and shows them in grafana dashboards. for more details, check out: https://aboullaite.me/spring-boot-monitoring-prometheus-grafana/

How to run

to run the examole use docker compose up -d --build, this will start 2 containers: Prometheus and Grafana. Next on, run Spring boot app!

Note that the project description data, including the texts, logos, images, and/or trademarks, for each open source project belongs to its rightful owner. If you wish to add or remove any projects, please contact us at [email protected].