Overdrivr / Telemetry
Projects that are alternatives of or similar to Telemetry

![]()
Current status Paused development for now, will restart once I find better ways of managing and distributing general-purpose embedded libraries. However, library is functional good stability & test coverage.
Overview
Telemetry enables easy communication and data visualization between a computer and any embedded platform, like ARM Mbed or Arduino.
Specifically, Telemetry is a communication protocol, implemented in C language.
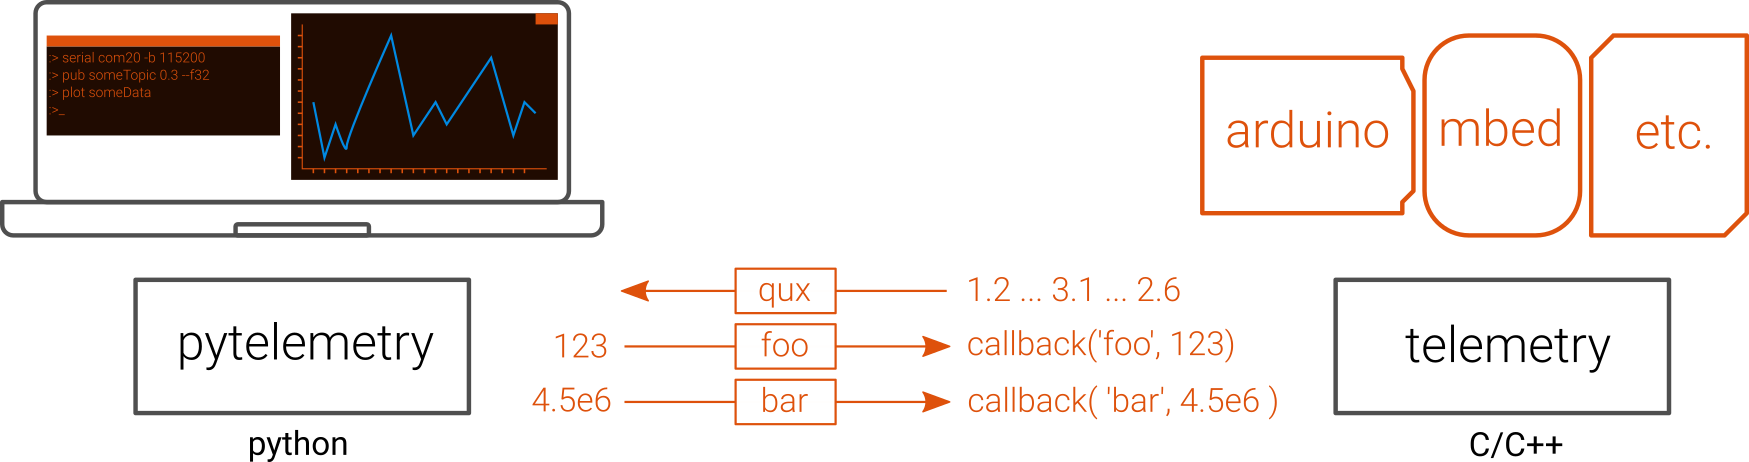
Data is exchanged on named channels, called topics (ex : foo, bar and qux on the figure above).
Sending data is called publishing.
Telemetry TM;
int32_t i = 123;

TM.pub_i32("foo", i);
For receiving data, Telemetry lets you attach variables and functions to topics.
When fresh data is received under a topic, attached variables will be updated and attached functions will be called.
Telemetry TM;
float thr;

TM.attach_f32_to("throttle", &thr);

for(;;) {
  TM.update();
}
Wrappers
Telemetry is written to be portable and general-purpose, and the core code is not tied to any hardware.
Wrappers for specific platforms are written to provide a plug-and-play manner to use Telemetry:
- Arduino wrapper
- Mbed wrapper (Available also on Mbed repository )
- Yotta (package manager) - in process
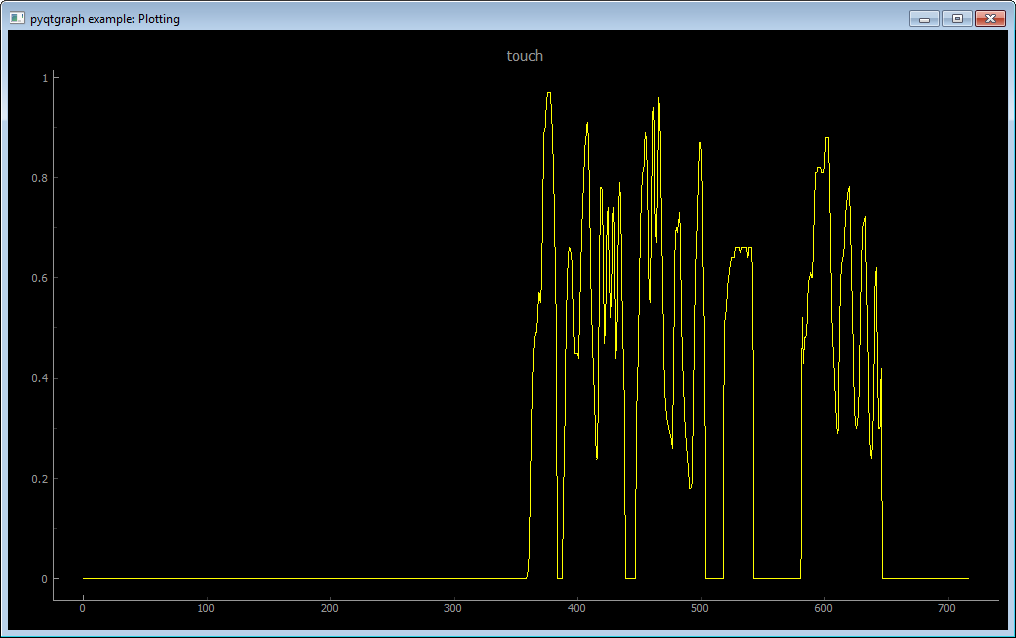
Data visualization
As soon as a device publishes data, it is possible to leverage the power of
the Pytelemetry Command Line Interface
![]() .
.
This terminal application lets you interact with the device, using simple commands.
Opening a live plot is as simple as
:> plot someTopic
Central documentation
All the information can be found from the Wiki Home.