nschloe / Termplotlib
Licence: gpl-3.0
Plotting on the command line
Stars: ✭ 294
Programming Languages
python
139335 projects - #7 most used programming language
Projects that are alternatives of or similar to Termplotlib
Mitype
Typing speed test in terminal
Stars: ✭ 241 (-18.03%)
Mutual labels: terminal, command-line, pypi
Imagescraper
✂️ High performance, multi-threaded image scraper
Stars: ✭ 630 (+114.29%)
Mutual labels: terminal, command-line, pypi
Asciigraph
Go package to make lightweight ASCII line graph ╭┈╯ in command line apps with no other dependencies.
Stars: ✭ 1,805 (+513.95%)
Mutual labels: terminal, command-line, plot
Laravel Zero
A PHP framework for console artisans
Stars: ✭ 2,821 (+859.52%)
Mutual labels: terminal, command-line
Go Termd
Package termd provides terminal markdown rendering, with code block syntax highlighting support.
Stars: ✭ 223 (-24.15%)
Mutual labels: terminal, command-line
Jquery.terminal
jQuery Terminal Emulator - JavaScript library for creating web-based terminals with custom commands
Stars: ✭ 2,623 (+792.18%)
Mutual labels: terminal, command-line
Csview
📠 A high performance csv viewer with cjk/emoji support.
Stars: ✭ 208 (-29.25%)
Mutual labels: terminal, command-line
Terminal
The new Windows Terminal and the original Windows console host, all in the same place!
Stars: ✭ 79,371 (+26896.94%)
Mutual labels: terminal, command-line
svg plot
Plot data in SVG format using C++ (header only) library .
Stars: ✭ 20 (-93.2%)
Mutual labels: plot, plotting
Theme.sh
A script which lets you set your $terminal theme.
Stars: ✭ 290 (-1.36%)
Mutual labels: terminal, command-line
Pdd
📅 Tiny date, time diff calculator with piggybacked timers
Stars: ✭ 218 (-25.85%)
Mutual labels: terminal, command-line
Kmdr Cli
🧠 The CLI tool for learning commands from your terminal
Stars: ✭ 218 (-25.85%)
Mutual labels: terminal, command-line
sr graph
A simple, one-file, header-only, C++ utility for graphs, curves and histograms.
Stars: ✭ 67 (-77.21%)
Mutual labels: plot, plotting
Hyper Site
The official website for the Hyper terminal
Stars: ✭ 289 (-1.7%)
Mutual labels: terminal, command-line
Notica
Send browser notifications from your terminal. No installation. No registration.
Stars: ✭ 215 (-26.87%)
Mutual labels: terminal, command-line
distfit
distfit is a python library for probability density fitting.
Stars: ✭ 250 (-14.97%)
Mutual labels: pypi, plot
Teip
Select partial standard input and replace with the result of another command efficiently
Stars: ✭ 280 (-4.76%)
Mutual labels: terminal, command-line
Saldl
A lightweight well-featured CLI downloader optimized for speed and early preview.
Stars: ✭ 203 (-30.95%)
Mutual labels: terminal, command-line
Stonky
A command line dashboard for monitoring stocks
Stars: ✭ 208 (-29.25%)
Mutual labels: terminal, command-line
termplotlib


![]()
termplotlib is a Python library for all your terminal plotting needs. It aims to work like matplotlib.
Line plots
For line plots, termplotlib relies on gnuplot. With that installed, the code
import termplotlib as tpl
import numpy

x = numpy.linspace(0, 2 * numpy.pi, 10)
y = numpy.sin(x)

fig = tpl.figure()
fig.plot(x, y, label="data", width=50, height=15)
fig.show()
produces
    1 +---------------------------------------+
  0.8 |    **     **                          |
  0.6 |   *         **           data ******* |
  0.4 | **                                    |
  0.2 |*              **                      |
    0 |                 **                    |
      |                                   *   |
 -0.2 |                   **            **    |
 -0.4 |                     **         *      |
 -0.6 |                              **       |
 -0.8 |                       **** **         |
   -1 +---------------------------------------+
      0     1    2     3     4     5    6     7
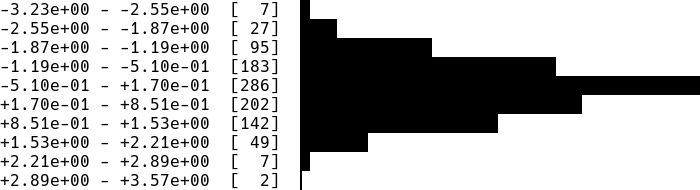
Horizontal histograms
import termplotlib as tpl
import numpy

numpy.random.seed(123)
sample = numpy.random.normal(size=1000)
counts, bin_edges = numpy.histogram(sample)

fig = tpl.figure()
fig.hist(counts, bin_edges, orientation="horizontal", force_ascii=False)
fig.show()
produces
Horizontal bar charts are covered as well. This
fig = tpl.figure()
fig.barh([3, 10, 5, 2], ["Cats", "Dogs", "Cows", "Geese"], force_ascii=True)
fig.show()
produces
Cats   [ 3]  ************
Dogs   [10]  ****************************************
Cows   [ 5]  ********************
Geese  [ 2]  ********
Vertical histograms
import termplotlib as tpl
import numpy

numpy.random.seed(123)
sample = numpy.random.normal(size=1000)
counts, bin_edges = numpy.histogram(sample, bins=40)
fig = tpl.figure()
fig.hist(counts, bin_edges, grid=[15, 25], force_ascii=False)
fig.show()
produces

Tables
Support for tables has moved over to termtables.
Installation
termplotlib is available from the Python Package Index, so simply do
pip install termplotlib
to install.
Testing
To run the termplotlib unit tests, check out this repository and type
pytest
License
This software is published under the GPLv3 license.
Note that the project description data, including the texts, logos, images, and/or trademarks,
for each open source project belongs to its rightful owner.
If you wish to add or remove any projects, please contact us at [email protected].