RamiKrispin / Tsstudio
Licence: other
Tools for time series analysis and forecasting
Stars: ✭ 283
Programming Languages
r
7636 projects
Projects that are alternatives of or similar to Tsstudio
Java Timeseries
Time series analysis in Java
Stars: ✭ 155 (-45.23%)
Mutual labels: timeseries, forecasting
Timetk
A toolkit for working with time series in R
Stars: ✭ 371 (+31.1%)
Mutual labels: timeseries, forecasting
modeltime.ensemble
Time Series Ensemble Forecasting
Stars: ✭ 65 (-77.03%)
Mutual labels: timeseries, forecasting
Neural prophet
NeuralProphet - A simple forecasting model based on Neural Networks in PyTorch
Stars: ✭ 1,125 (+297.53%)
Mutual labels: timeseries, forecasting
Tcdf
Temporal Causal Discovery Framework (PyTorch): discovering causal relationships between time series
Stars: ✭ 217 (-23.32%)
Mutual labels: timeseries, forecasting
Deep XF
Package towards building Explainable Forecasting and Nowcasting Models with State-of-the-art Deep Neural Networks and Dynamic Factor Model on Time Series data sets with single line of code. Also, provides utilify facility for time-series signal similarities matching, and removing noise from timeseries signals.
Stars: ✭ 83 (-70.67%)
Mutual labels: timeseries, forecasting
arima
ARIMA, SARIMA, SARIMAX and AutoARIMA models for time series analysis and forecasting in the browser and Node.js
Stars: ✭ 31 (-89.05%)
Mutual labels: timeseries, forecasting
tsfeatures
Calculates various features from time series data. Python implementation of the R package tsfeatures.
Stars: ✭ 87 (-69.26%)
Mutual labels: forecasting
ts-forecasting-ensemble
CentOS based Docker container for Time Series Analysis and Modeling.
Stars: ✭ 19 (-93.29%)
Mutual labels: forecasting
GAN-RNN Timeseries-imputation
Recurrent GAN for imputation of time series data. Implemented in TensorFlow 2 on Wikipedia Web Traffic Forecast dataset from Kaggle.
Stars: ✭ 107 (-62.19%)
Mutual labels: forecasting
foot
foot是一个集足球数据采集器,简单分析的项目.AI足球球探为程序全自动处理,全程无人为参与干预足球分析足球预测程序.程序根据各大指数多维度数据,结合作者多年足球分析经验,精雕细琢,集天地之灵气,汲日月之精华,历时七七四十九天,经Bug九九八十一个,编码而成.有兴趣的朋友,可以关注一下公众号AI球探(微信号ai00268).
Stars: ✭ 96 (-66.08%)
Mutual labels: forecasting
ReCOVER-COVID-19
Data-driven COVID-19 forecasts and detection of unreported cases
Stars: ✭ 18 (-93.64%)
Mutual labels: forecasting
gpu accelerated forecasting modeltime gluonts
GPU-Accelerated Deep Learning for Time Series using Modeltime GluonTS (Learning Lab 53). Event sponsors: Saturn Cloud, NVIDIA, & Business Science.
Stars: ✭ 20 (-92.93%)
Mutual labels: forecasting
Esrnn Gpu
PyTorch GPU implementation of the ES-RNN model for time series forecasting
Stars: ✭ 262 (-7.42%)
Mutual labels: forecasting
redis-modules-java
Java client libraries for redis-modules https://redis.io/modules, based on Redisson. https://github.com/redisson/redisson
Stars: ✭ 57 (-79.86%)
Mutual labels: timeseries
Transformer
Implementation of Transformer model (originally from Attention is All You Need) applied to Time Series.
Stars: ✭ 273 (-3.53%)
Mutual labels: timeseries
Django Ledger
A bookkeeping & financial analysis engine for the Django Framework. UNDER ACTIVE DEVELOPMENT & NOT STABLE YET.
Stars: ✭ 253 (-10.6%)
Mutual labels: forecasting
TSForecasting
This repository contains the implementations related to the experiments of a set of publicly available datasets that are used in the time series forecasting research space.
Stars: ✭ 53 (-81.27%)
Mutual labels: forecasting
magi
📈 high level wrapper for parallel univariate time series forecasting 📉
Stars: ✭ 17 (-93.99%)
Mutual labels: forecasting
TSstudio 
The TSstudio package provides a set of tools descriptive and predictive analysis of time series data. That includes utility functions for preprocessing time series data, interactive visualization functions based on the plotly package engine, and set of tools for training and evaluating time series forecasting models from the forecast, forecastHybrid, and bsts packages.
More information available on the package vignettes.
Installation
Install the stable version from CRAN:
install.packages("TSstudio")
or install the development version from Github:
# install.packages("devtools")
devtools::install_github("RamiKrispin/TSstudio")
Usage
Plotting time series data
library(TSstudio)
data(USgas)

# Ploting time series object
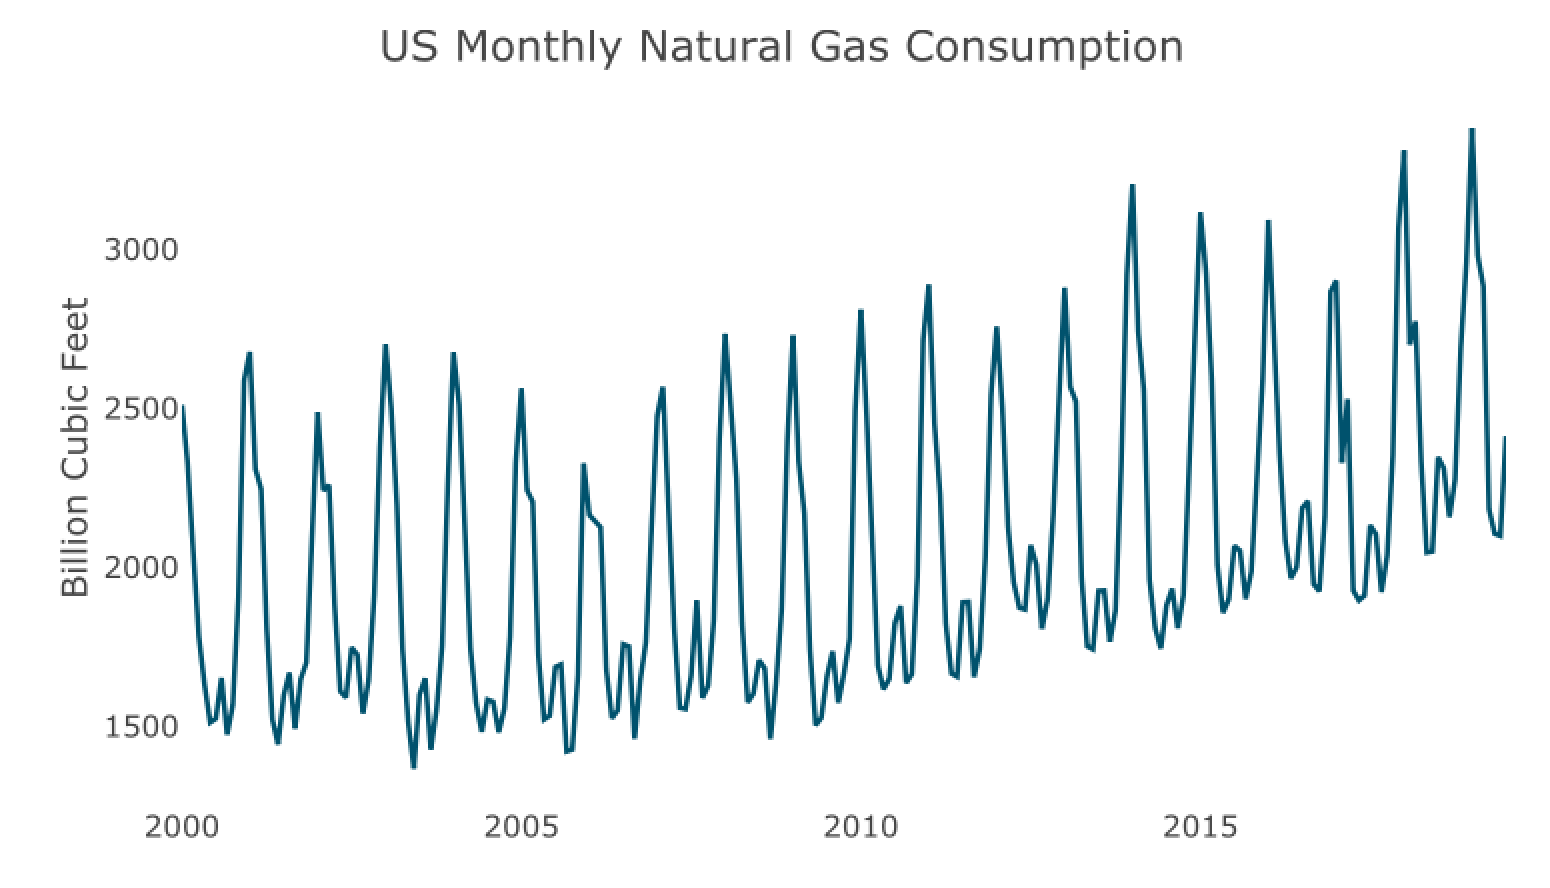
ts_plot(USgas,
        title = "US Monthly Natural Gas Consumption",
        Ytitle = "Billion Cubic Feet")
Seasonality analysis
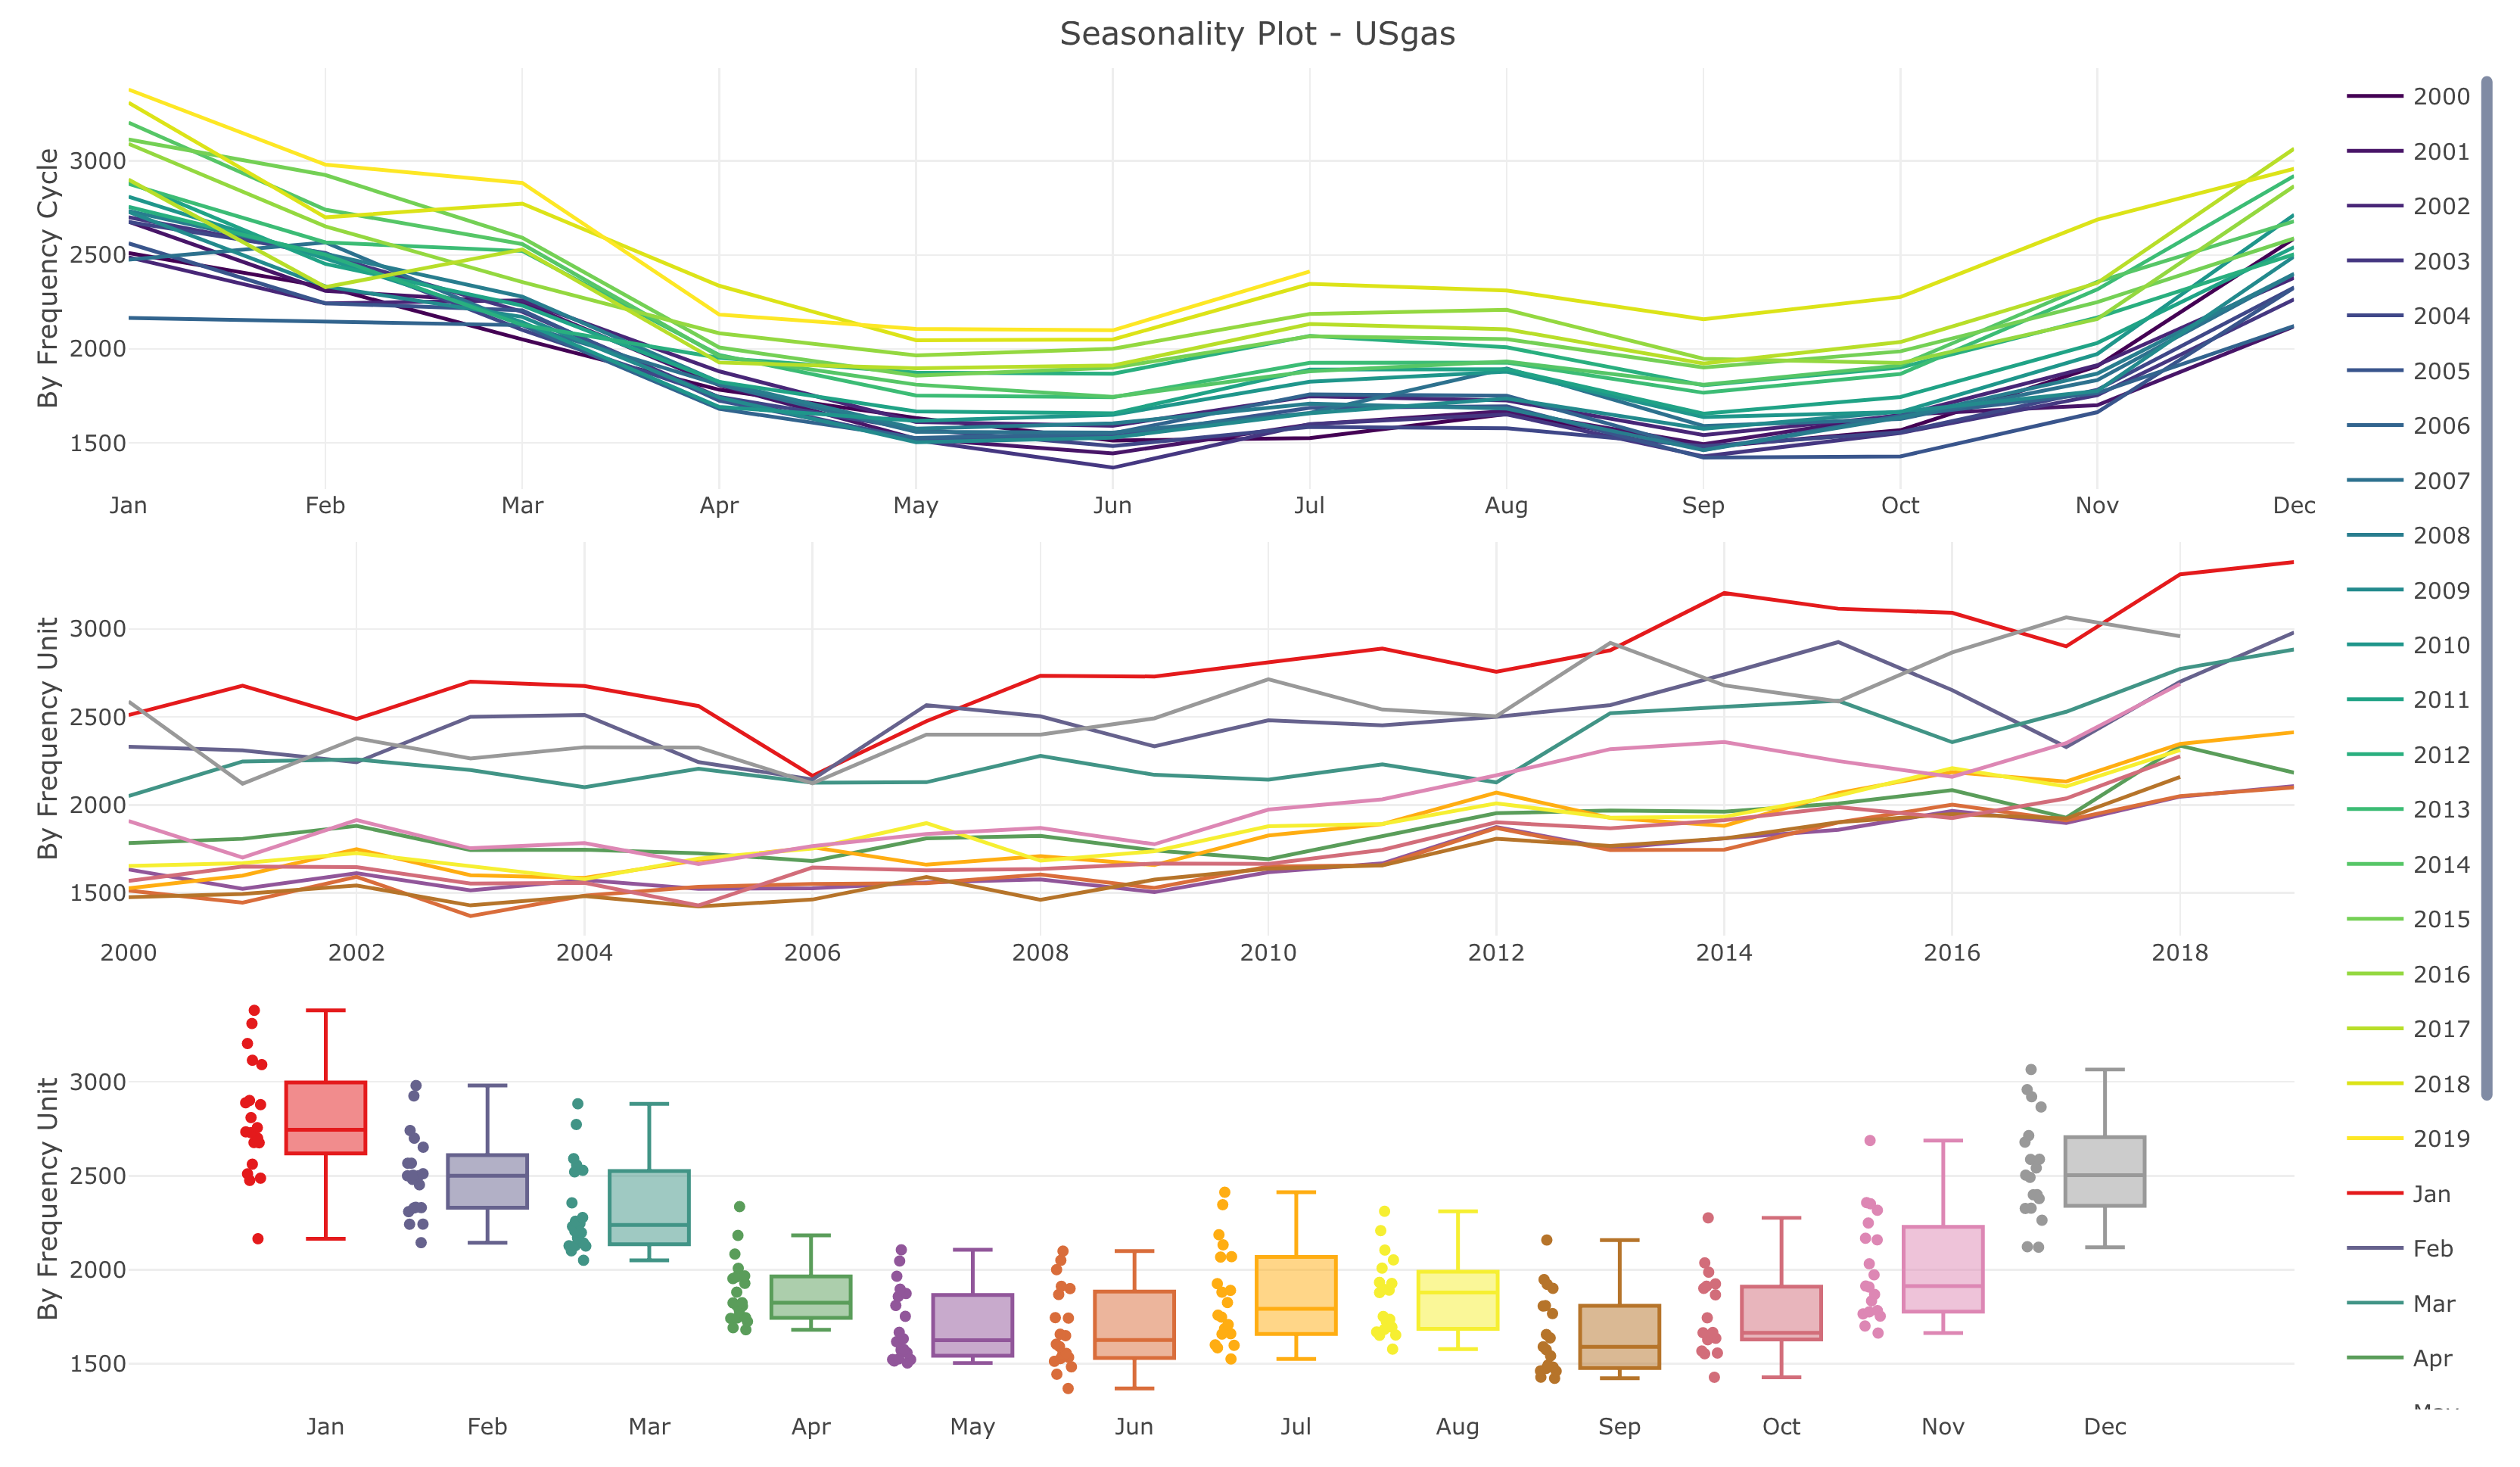
# Seasonal plot
ts_seasonal(USgas, type = "all")
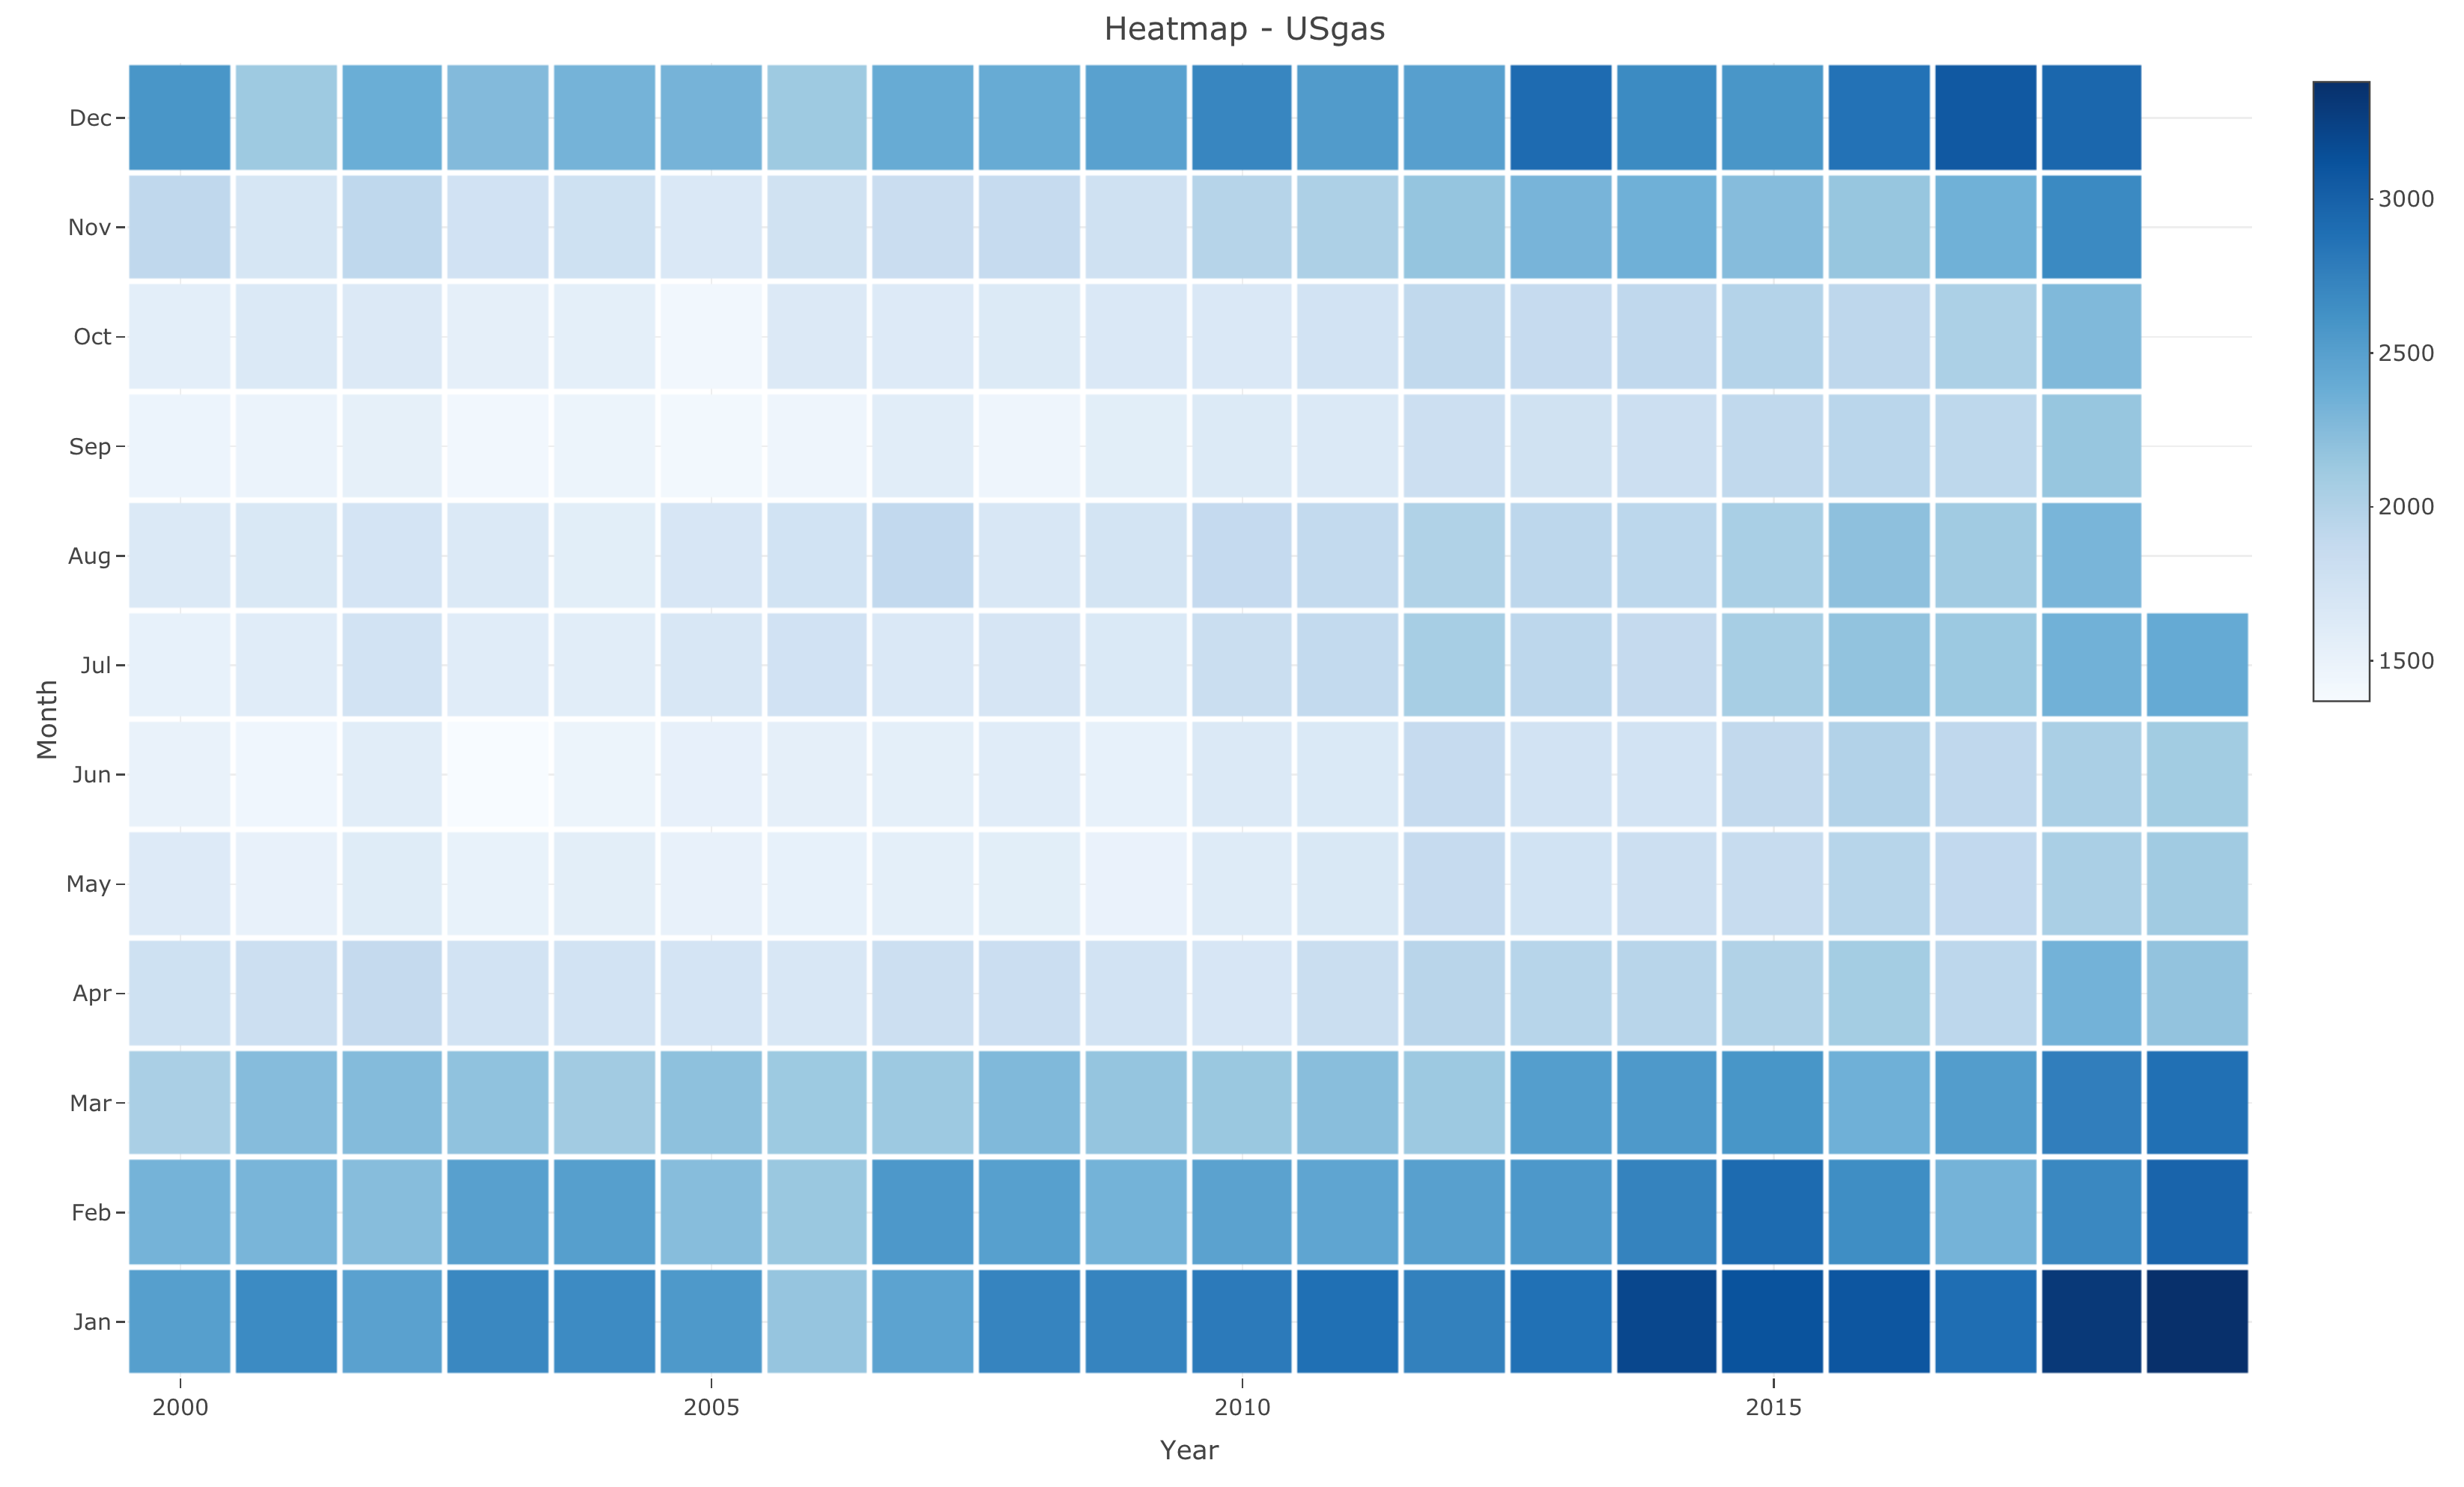
# Heatmap plot

ts_heatmap(USgas)
Correlation analysis
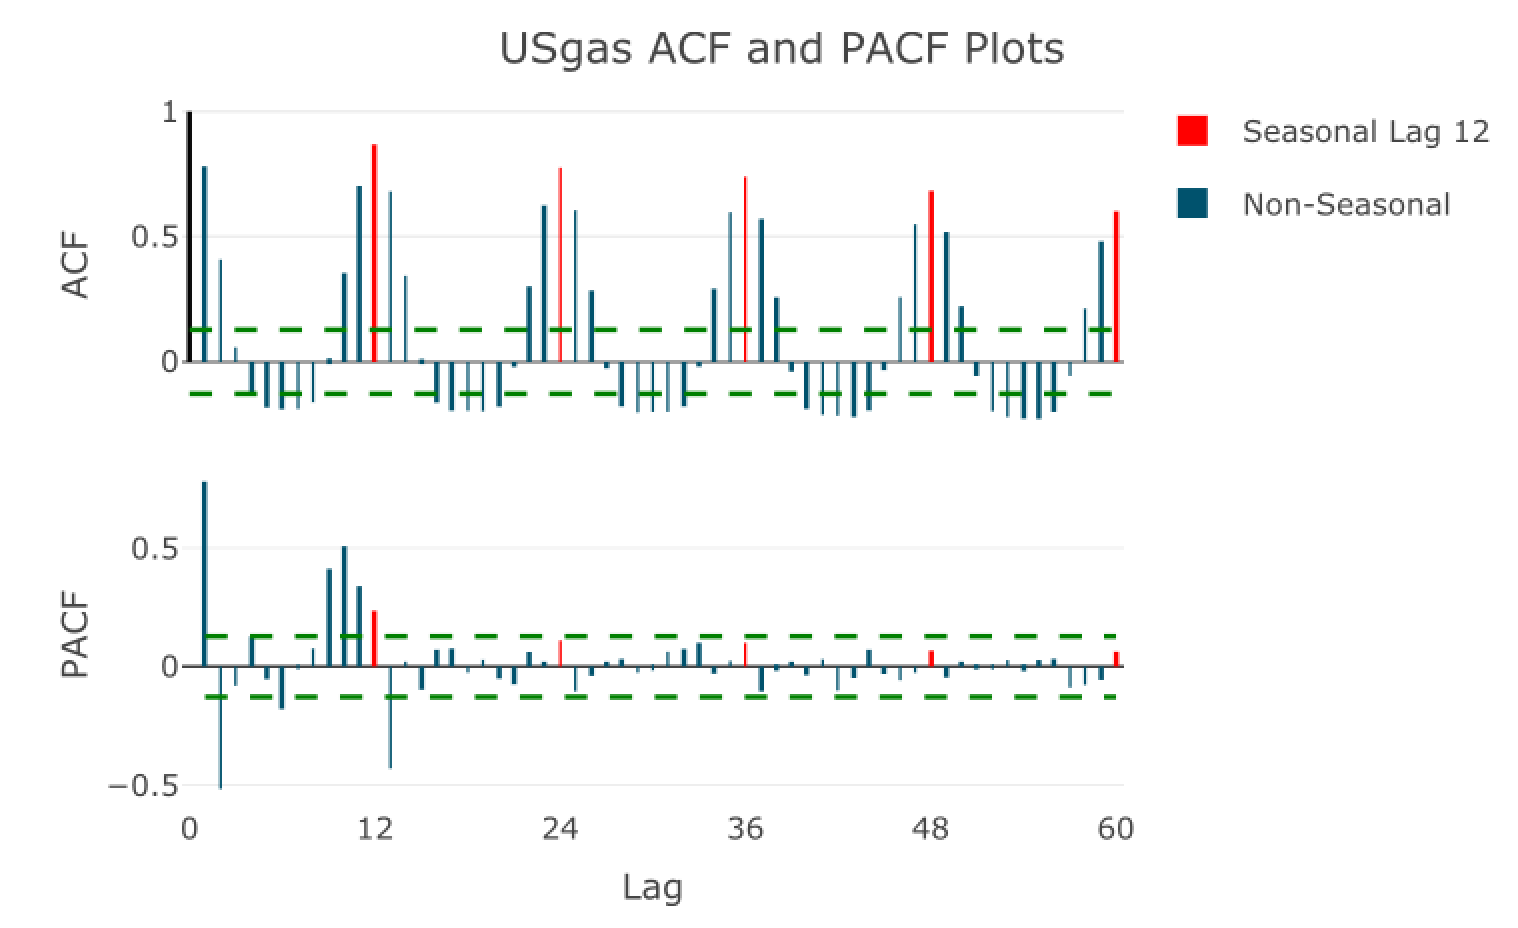
# ACF and PACF plots
ts_cor(USgas, lag.max = 60)
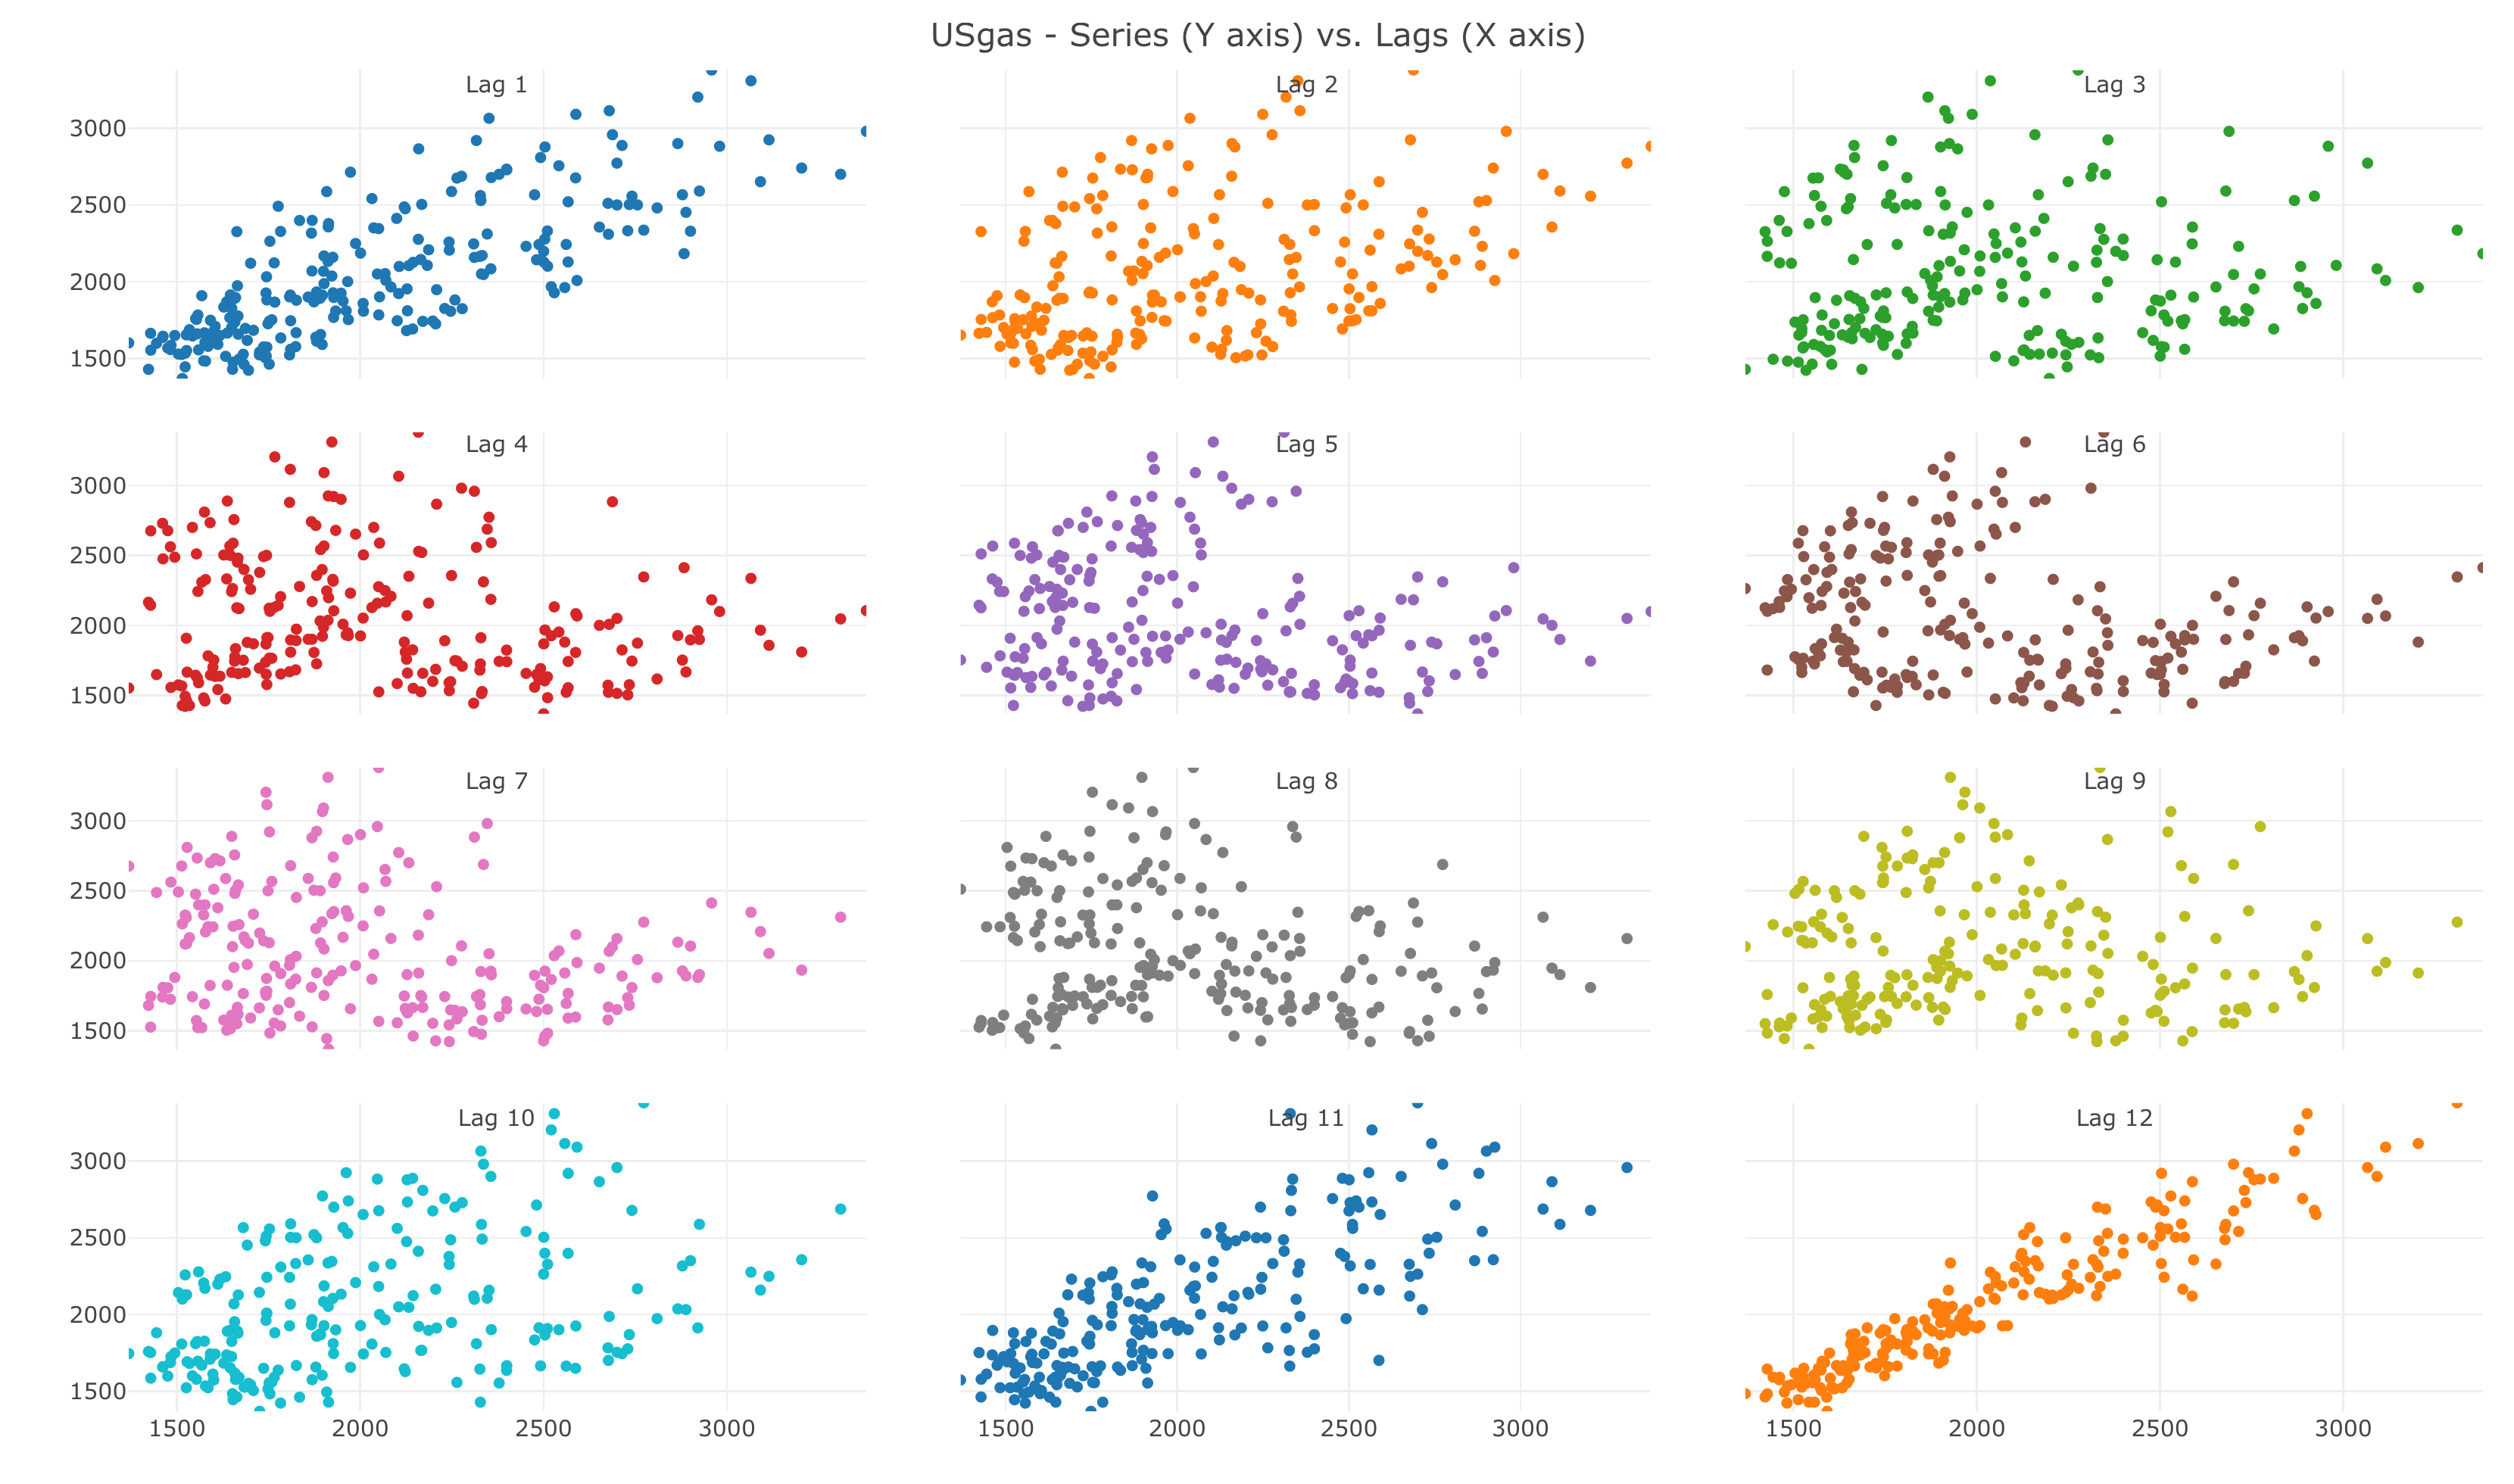
# Lags plot
ts_lags(USgas, lags = 1:12)
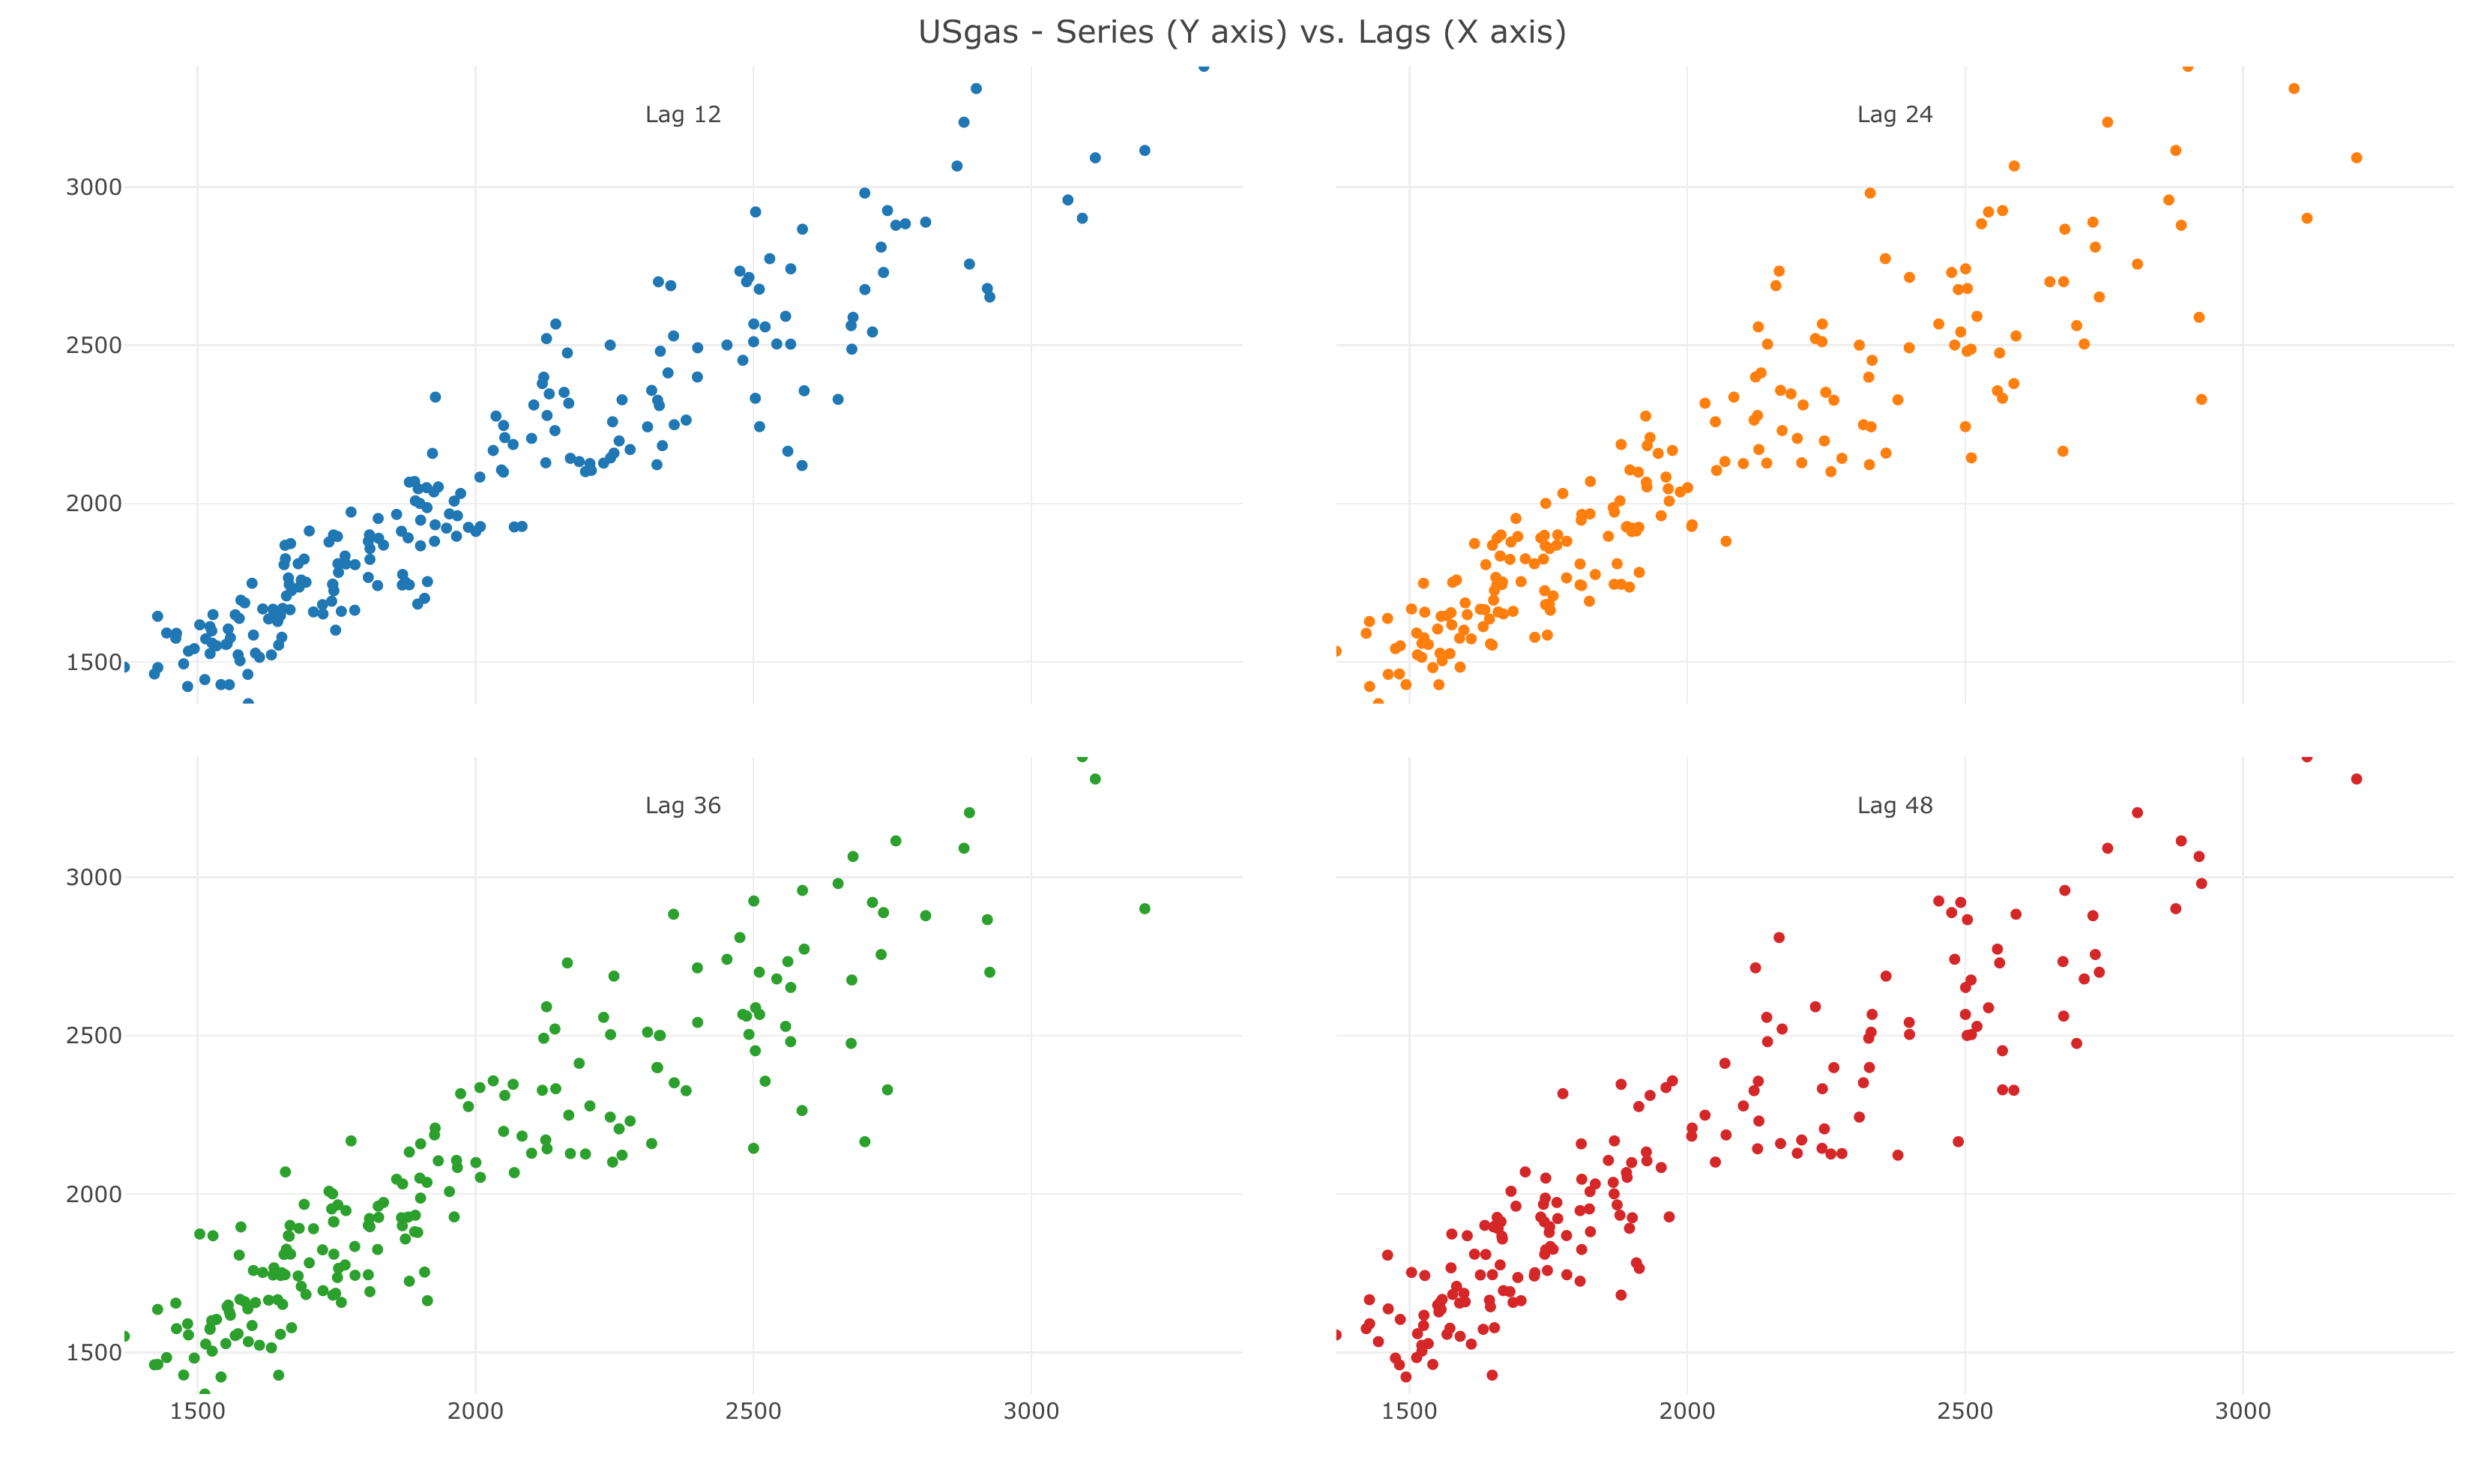
# Seasonal lags plot
ts_lags(USgas, lags = c(12, 24, 36, 48))
Training forecasting models
# Forecasting applications
# Setting training and testing partitions
USgas_s <- ts_split(ts.obj = USgas, sample.out = 12)
train <- USgas_s$train
test <- USgas_s$test

# Forecasting with auto.arima
library(forecast)
md <- auto.arima(train)
fc <- forecast(md, h = 12)

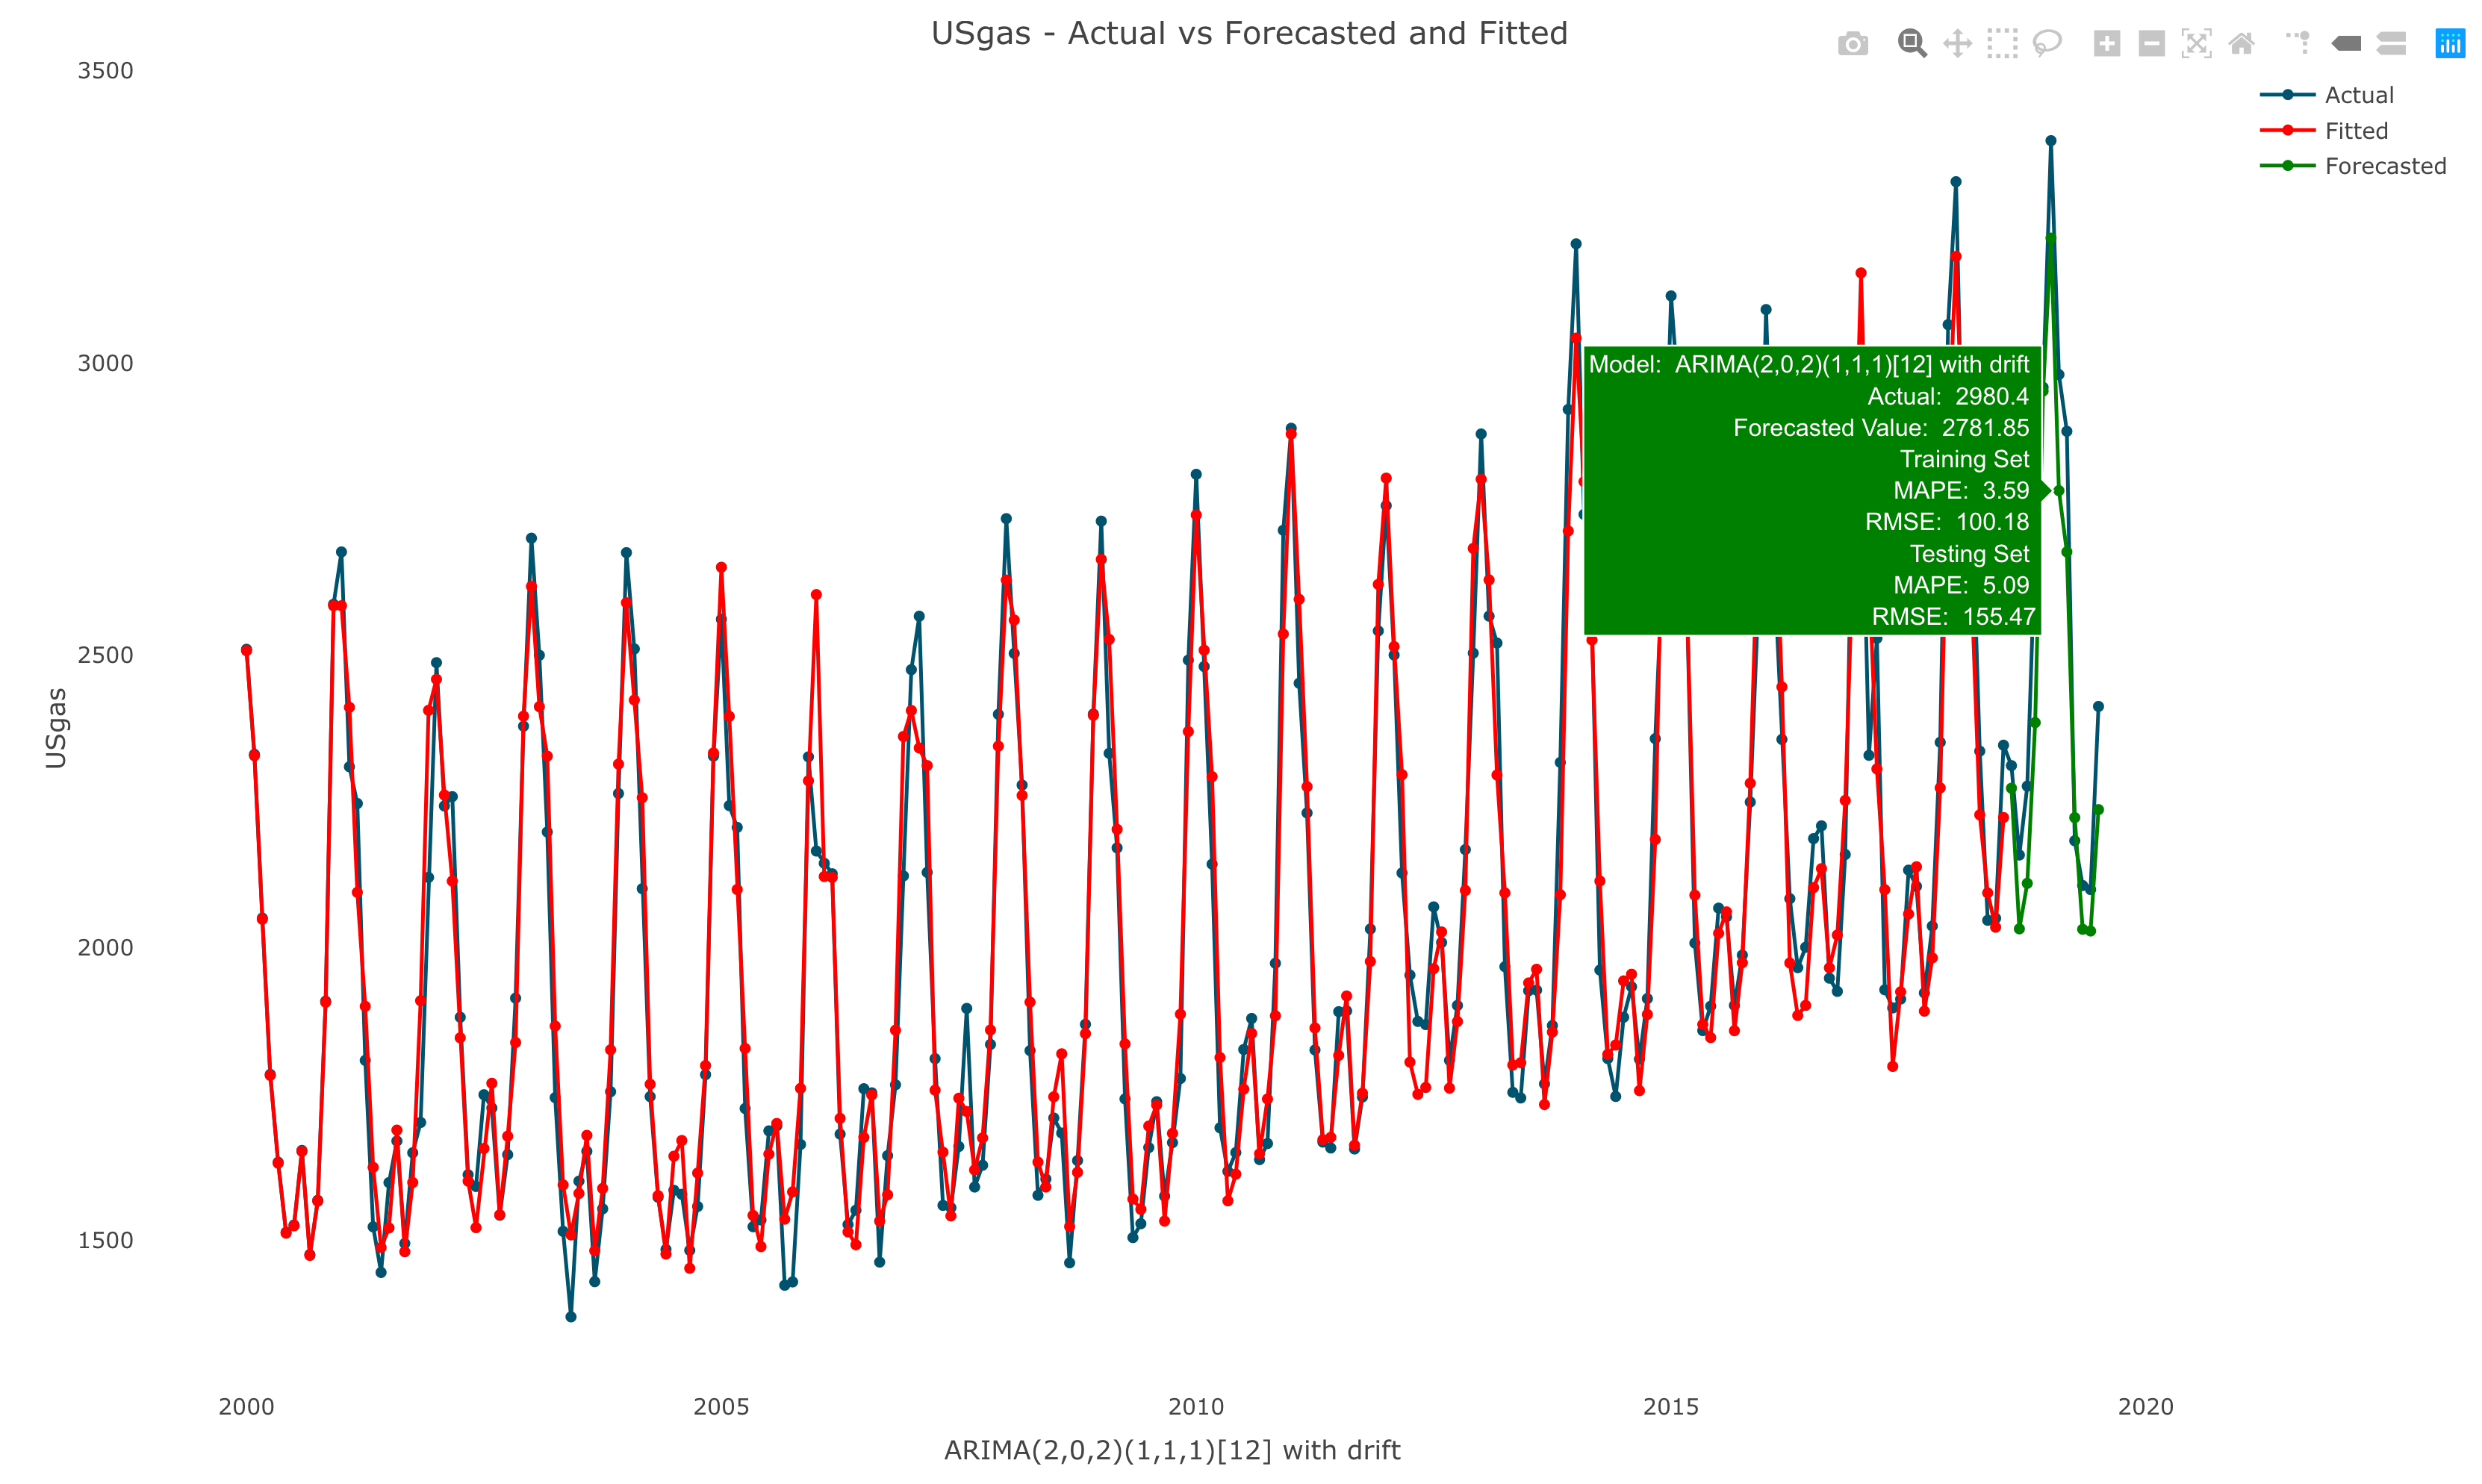
# Plotting actual vs. fitted and forecasted
test_forecast(actual = USgas, forecast.obj = fc, test = test)
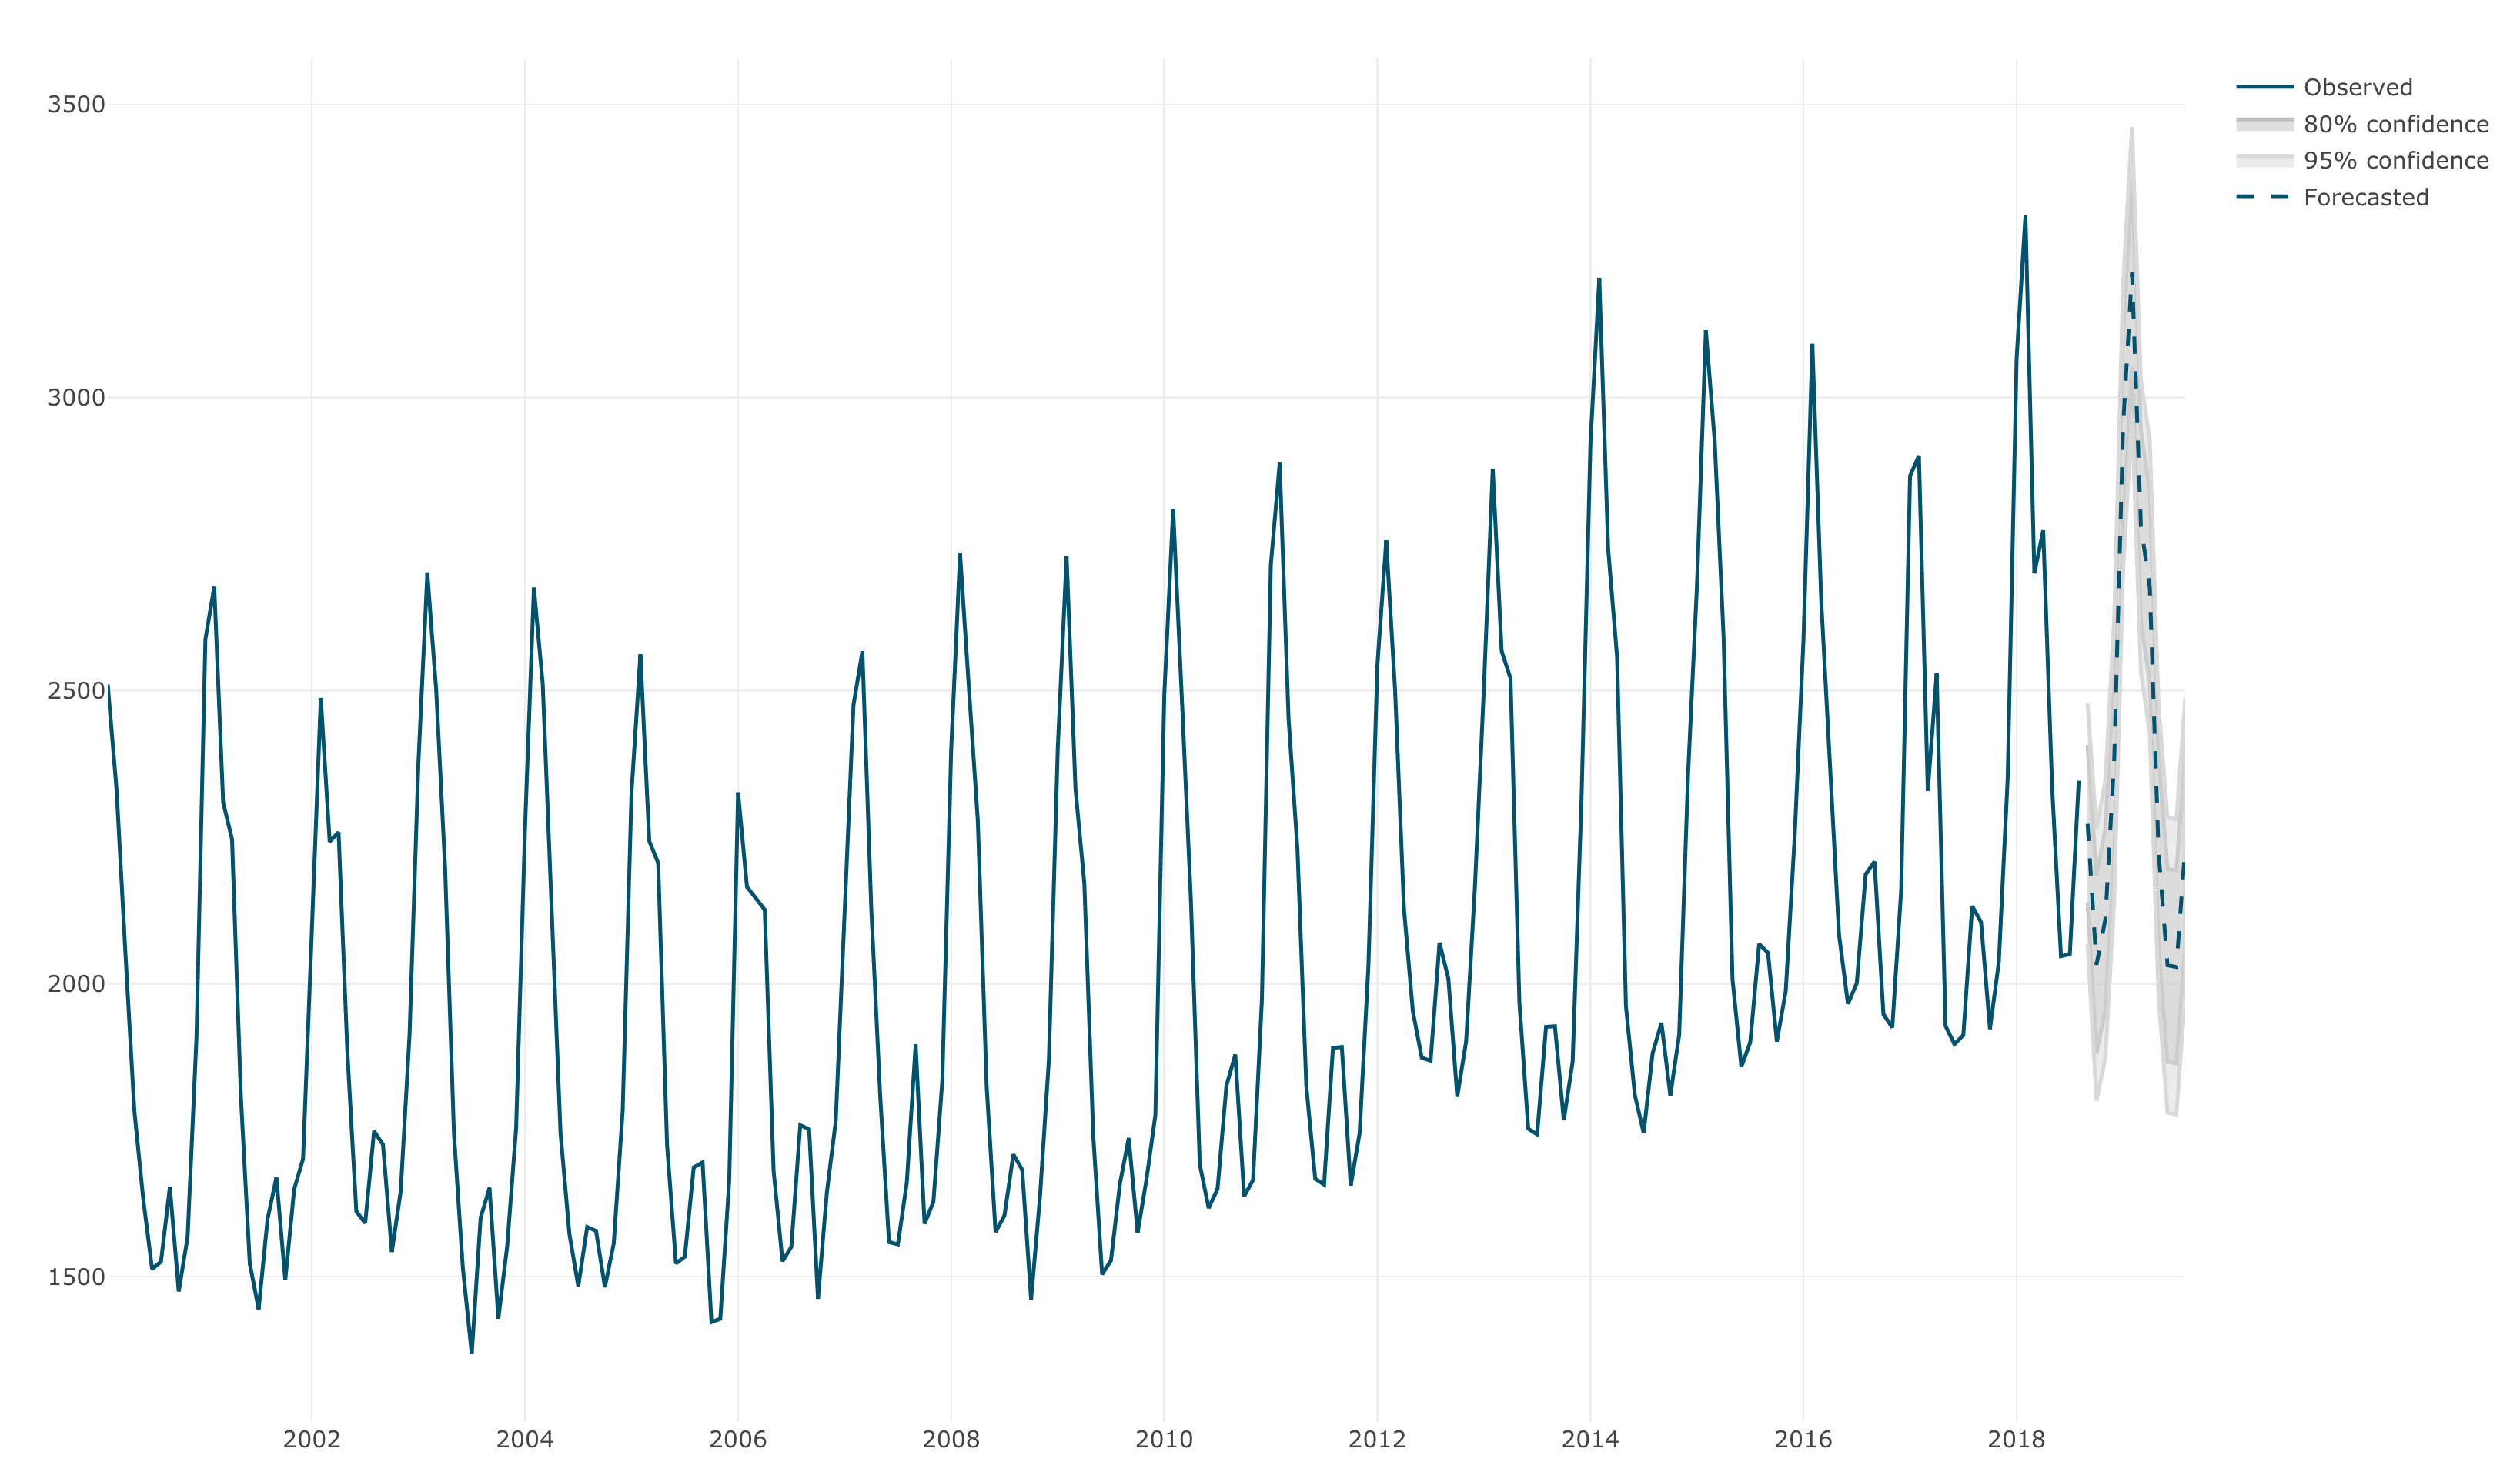
# Plotting the forecast
plot_forecast(fc)
# Run horse race between multiple models
methods <- list(ets1 = list(method = "ets",
                            method_arg = list(opt.crit = "lik"),
                            notes = "ETS model with opt.crit = lik"),
                ets2 = list(method = "ets",
                            method_arg = list(opt.crit = "amse"),
                            notes = "ETS model with opt.crit = amse"),
                arima1 = list(method = "arima",
                              method_arg = list(order = c(2,1,0)),
                              notes = "ARIMA(2,1,0)"),
                arima2 = list(method = "arima",
                              method_arg = list(order = c(2,1,2),
                                                seasonal = list(order = c(1,1,1))),
                              notes = "SARIMA(2,1,2)(1,1,1)"),
                hw = list(method = "HoltWinters",
                          method_arg = NULL,
                          notes = "HoltWinters Model"),
                tslm = list(method = "tslm",
                            method_arg = list(formula = input ~ trend + season),
                            notes = "tslm model with trend and seasonal components"))
# Training the models with backtesting
md <- train_model(input = USgas,
                  methods = methods,
                  train_method = list(partitions = 6,
                                      sample.out = 12,
                                      space = 3),
                  horizon = 12,
                  error = "MAPE")
# A tibble: 6 x 7
  model_id model       notes                                         avg_mape avg_rmse `avg_coverage_80%` `avg_coverage_95%`
  <chr>    <chr>       <chr>                                            <dbl>    <dbl>              <dbl>              <dbl>
1 arima2   arima       SARIMA(2,1,2)(1,1,1)                            0.0557     167.              0.583              0.806
2 hw       HoltWinters HoltWinters Model                               0.0563     163.              0.736              0.889
3 ets1     ets         ETS model with opt.crit = lik                   0.0611     172.              0.681              0.903
4 ets2     ets         ETS model with opt.crit = amse                  0.0666     186.              0.458              0.833
5 tslm     tslm        tslm model with trend and seasonal components   0.0767     220.              0.417              0.667
6 arima1   arima       ARIMA(2,1,0)                                    0.188      598.              0.875              0.958
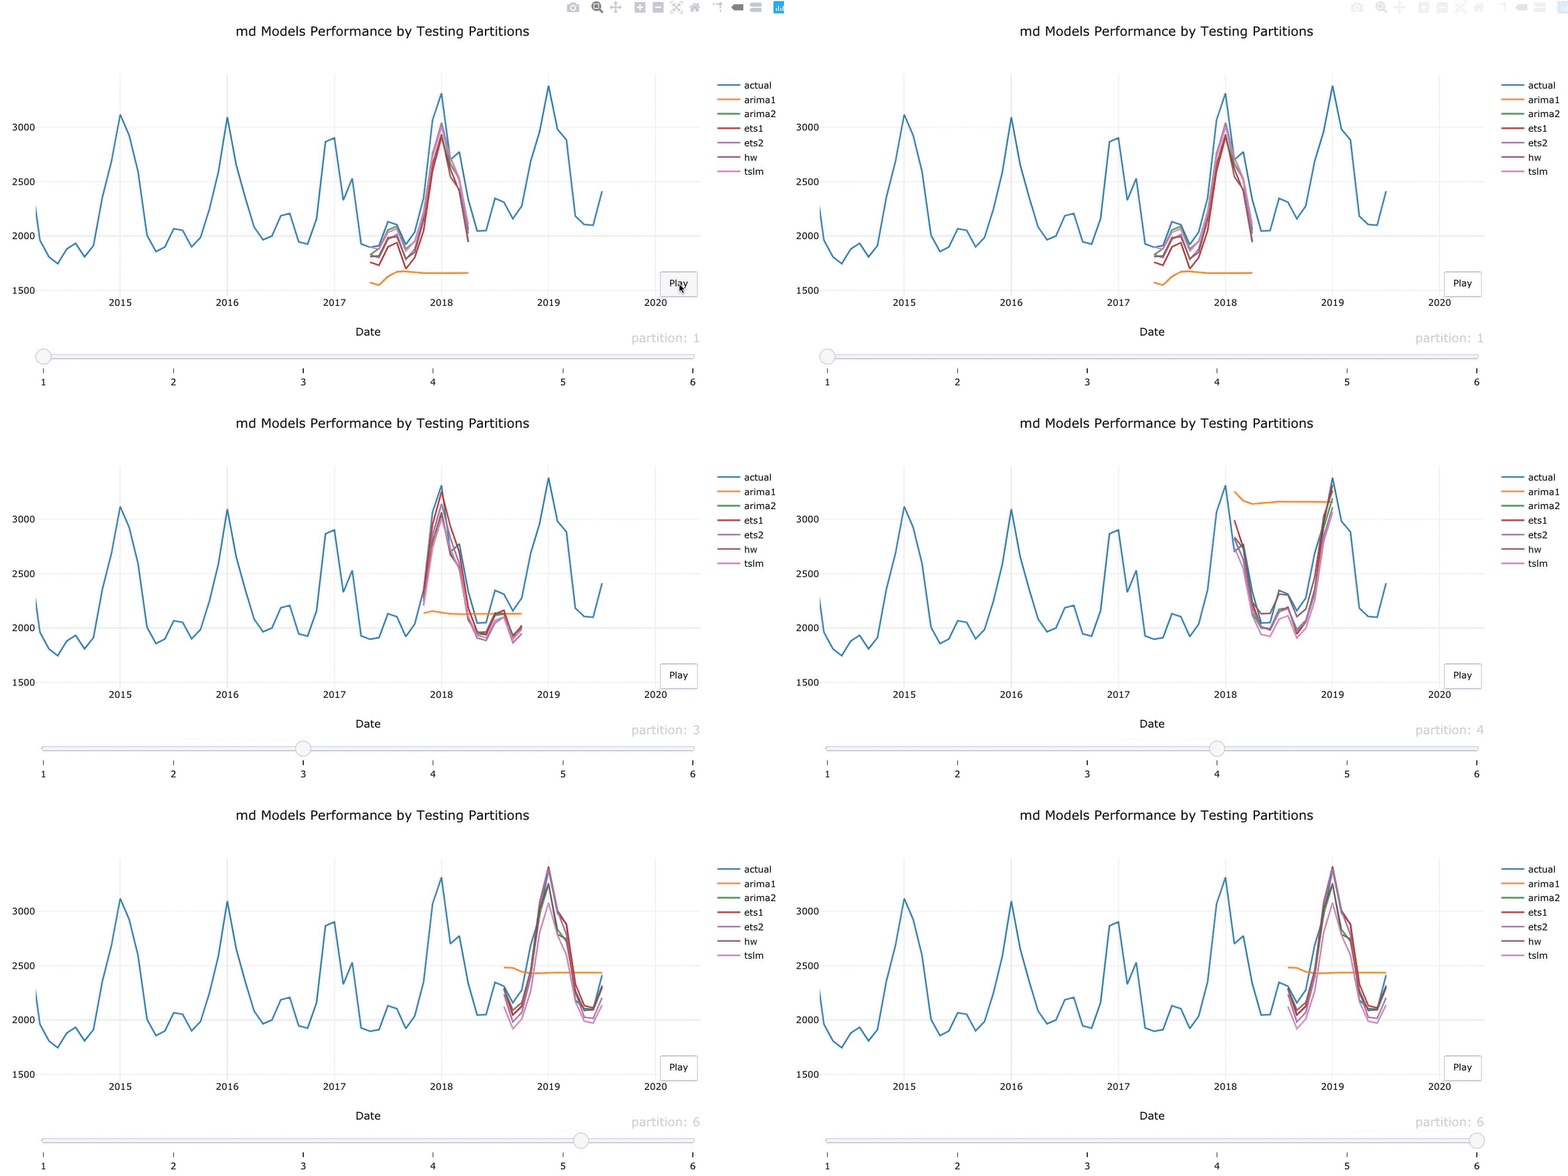
# Plot the performance of the different models on the testing partitions
plot_model(md)
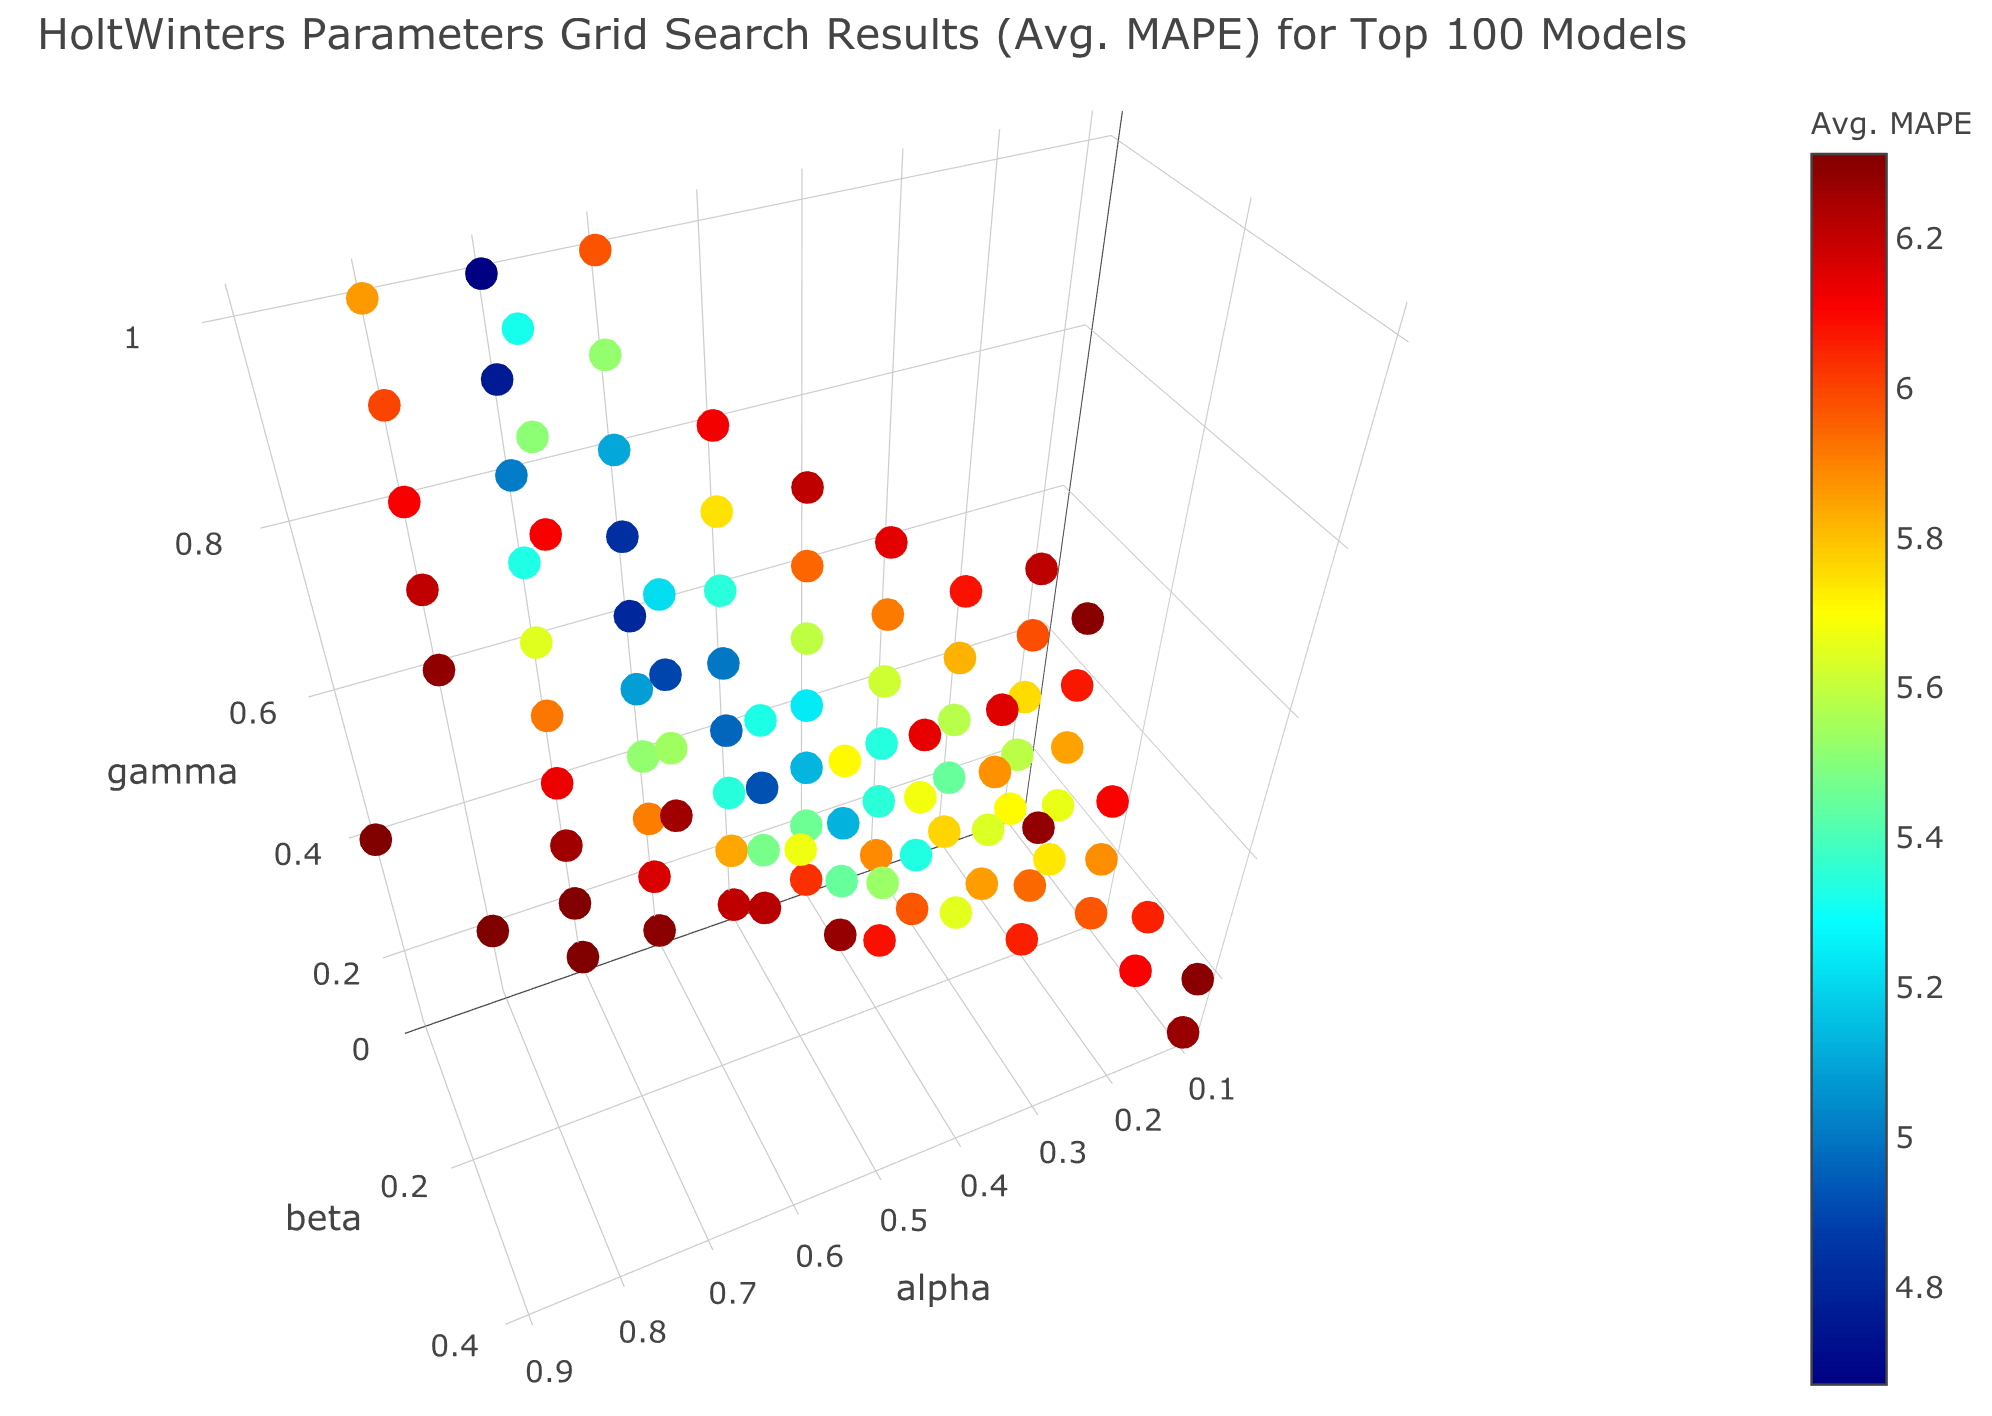
# Holt-Winters tunning parameters with grid search
hw_grid <- ts_grid(USgas,
                   model = "HoltWinters",
                   periods = 6,
                   window_space = 6,
                   window_test = 12,
                   hyper_params = list(alpha = seq(0,1,0.1),
                                       beta = seq(0,1,0.1),
                                       gamma = seq(0,1,0.1)))

plot_grid(hw_grid, type = "3D")
Note that the project description data, including the texts, logos, images, and/or trademarks,
for each open source project belongs to its rightful owner.
If you wish to add or remove any projects, please contact us at [email protected].


