All Projects → nschloe → Tuna

nschloe / Tuna

Licence: gpl-3.0
Python profile viewer

Programming Languages

python
139335 projects - #7 most used programming language

Projects that are alternatives of or similar to Tuna

Vmprof Python
vmprof - a statistical program profiler
Stars: ✭ 395 (-1%)
Mutual labels:  profile, profiler
Androidgodeye
An app performance monitor(APM) , like "Android Studio profiler", you can easily monitor the performance of your app real time in browser
Stars: ✭ 2,430 (+509.02%)
Mutual labels:  profile, profiler
Pyinstrument
🚴 Call stack profiler for Python. Shows you why your code is slow!
Stars: ✭ 3,870 (+869.92%)
Mutual labels:  profile, profiler
Sol Profiler
CLI Tool to List & Store Solidity Smart Contract Methods Attributes
Stars: ✭ 20 (-94.99%)
Mutual labels:  profile, profiler
profiler
Continuous profiling based on pprof
Stars: ✭ 221 (-44.61%)
Mutual labels:  profile, profiler
Nightmare
A high-level browser automation library.
Stars: ✭ 19,067 (+4678.7%)
Mutual labels:  browser
Filer
Node-like file system for browsers
Stars: ✭ 389 (-2.51%)
Mutual labels:  browser
Fuzzdata
Fuzzing resources for feeding various fuzzers with input. 🔧
Stars: ✭ 376 (-5.76%)
Mutual labels:  browser
Hardinfo
System profiler and benchmark tool for Linux systems
Stars: ✭ 385 (-3.51%)
Mutual labels:  profiler
Github Profile Readme Generator
GitHub profile readme generator allows you to create nice and simple GitHub profile readme files that will be included in your profile previews.
Stars: ✭ 374 (-6.27%)
Mutual labels:  profile
Js Dos
The best API for running dos programs in browser
Stars: ✭ 385 (-3.51%)
Mutual labels:  browser
Servo
The Servo Browser Engine
Stars: ✭ 20,469 (+5030.08%)
Mutual labels:  browser
Webrunlocal
PluginOK(牛插)中间件是一个实现网页浏览器(Web Browser)与本地程序(Local App)之间进行双向调用的低成本、强兼容、安全可控、轻量级、易集成、可扩展、跨浏览器的原生小程序系统。通过此中间件可实现网页前端JS脚本无障碍操作本地电脑各种硬件、调用本地系统API及相关组件功能,可彻底解决DLL模块、ActiveX控件及自动化程序(如微软Office、金山WPS、AutoCAD等)在Chrome、Edge、360、FireFox、IE、Opera、QQ、搜狗等浏览器各版本中的嵌入使用问题,媲美原Java Applet的效果
Stars: ✭ 391 (-2.01%)
Mutual labels:  browser
Mechanicalsoup
A Python library for automating interaction with websites.
Stars: ✭ 3,863 (+868.17%)
Mutual labels:  pypi
Pdfjs
A Portable Document Format (PDF) generation library targeting both the server- and client-side.
Stars: ✭ 395 (-1%)
Mutual labels:  browser
Kotlin Result
A multiplatform Result monad for modelling success or failure operations.
Stars: ✭ 369 (-7.52%)
Mutual labels:  browser
Vprof
Visual profiler for Python
Stars: ✭ 3,799 (+852.13%)
Mutual labels:  profiler
Guider
Performance Analyzer
Stars: ✭ 393 (-1.5%)
Mutual labels:  profile
Snazzy
Format JavaScript Standard Style as Stylish (i.e. snazzy) output
Stars: ✭ 381 (-4.51%)
Mutual labels:  browser
Alp
Access Log Profiler
Stars: ✭ 382 (-4.26%)
Mutual labels:  profiler

tuna

Performance analysis for Python.

PyPi Version PyPI pyversions GitHub stars PyPi downloads

Discord

gh-actions codecov LGTM Code style: black

tuna is a modern, lightweight Python profile viewer inspired by SnakeViz. It handles runtime and import profiles, has minimal dependencies, uses d3 and bootstrap, and avoids certain errors present in SnakeViz (see below) and is faster, too.

Create a runtime profile with

python -mcProfile -o program.prof yourfile.py

or an import profile with

python -X importtime yourfile.py 2> import.log

and show it with

tuna program.prof

Why tuna doesn't show the whole call tree

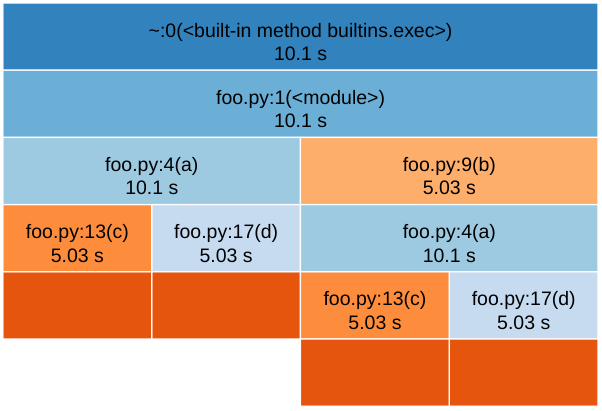
The whole timed call tree cannot be retrieved from profile data. Python developers made the decision to only store parent data in profiles because it can be computed with little overhead. To illustrate, consider the following program.

import time


def a(t0, t1):
    c(t0)
    d(t1)


def b():
    a(1, 4)


def c(t):
    time.sleep(t)


def d(t):
    time.sleep(t)


if __name__ == "__main__":
    a(4, 1)
    b()

The root process (__main__) calls a() which spends 4 seconds in c() and 1 second in d(). __main__ also calls b() which calls a(), this time spending 1 second in c() and 4 seconds in d(). The profile, however, will only store that c() spent a total of 5 seconds when called from a(), and likewise d(). The information that the program spent more time in c() when called in root -> a() -> c() than when called in root -> b() -> a() -> c() is not present in the profile.

tuna only displays the part of the timed call tree that can be deduced from the profile. SnakeViz, on the other hand, tries to construct the entire call tree, but ends up providing lots of wrong timings.
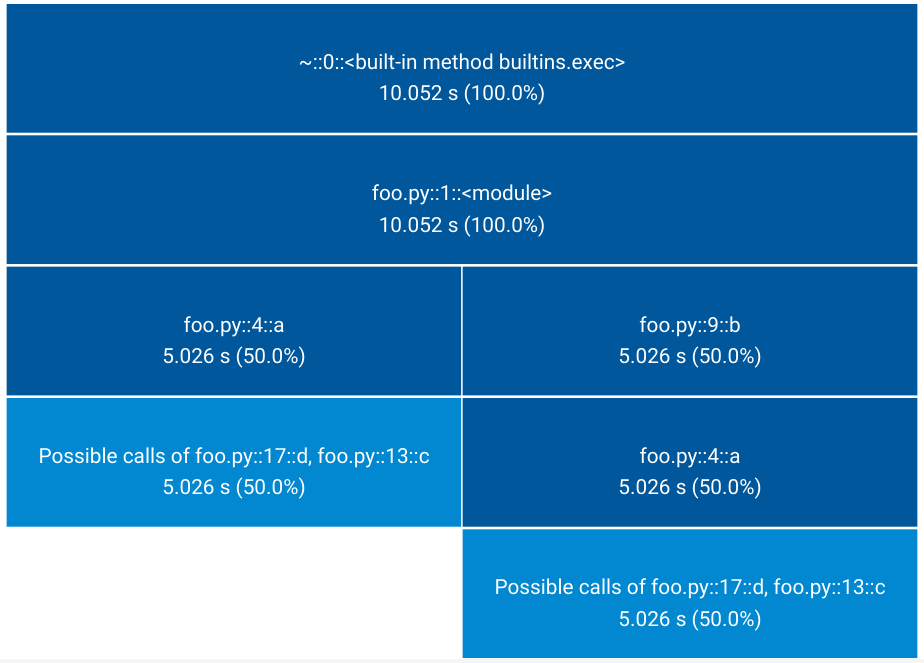
SnakeViz output. Wrong. tuna output. Only shows what can be retrieved from the profile.

Installation

tuna is available from the Python Package Index, so simply do

pip install tuna

to install.

Testing

To run the tuna unit tests, check out this repository and type

pytest

IPython magics

tuna includes a tuna line / cell magic which can be used as a drop-in replacement for the prun magic. Simply run %load_ext tuna to load the magic and then call it like %tuna sleep(3) or

%%tuna
sleep(3)

prun is still used to do the actual profiling and then the results are displayed in the notebook.

Development

After forking and cloning the repository, make sure to run make dep to install additional dependencies (bootstrap and d3) which aren't stored in the repo.

License

This software is published under the GPLv3 license.

Note that the project description data, including the texts, logos, images, and/or trademarks, for each open source project belongs to its rightful owner. If you wish to add or remove any projects, please contact us at [email protected].