sakrist / Vbpiechart
Programming Languages
Projects that are alternatives of or similar to Vbpiechart


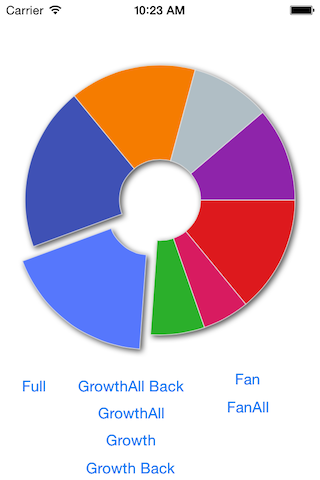
VBPieChart
Animated Pie Chart control for iOS apps, based on CALayer. Very easy in use and have custom labeling.
Usage
Create simple pi chart with VBPieChart:
VBPieChart *chart = [[VBPieChart alloc] initWithFrame:CGRectMake(10, 50, 300, 300)];
[self.view addSubview:chart];

// Setup some options:
[chart setEnableStrokeColor:YES];
[chart setHoleRadiusPrecent:0.3]; /* hole inside of chart */

// Prepare your data
NSArray *chartValues = @[
 @{@"name":@"Apples", @"value":@50, @"color":[UIColor redColor]},
 @{@"name":@"Pears", @"value":@20, @"color":[UIColor blueColor]},
 @{@"name":@"Oranges", @"value":@40, @"color":[UIColor orangeColor]},
 @{@"name":@"Bananas", @"value":@70, @"color":[UIColor purpleColor]}
];

// Present pie chart with animation
[chart setChartValues:chartValues animation:YES duration:0.4 options:VBPieChartAnimationFan];
chartValues needs to be defined as an array of dictionaries.
Dictionary required to contain value for piece with key value.
Optional:
namecolorlabelColoraccentstrokeColor
Chart from JSON
VBPieChart *chart = [[VBPieChart alloc] initWithFrame:CGRectMake(10, 50, 300, 300)];
chart.startAngle = M_PI+M_PI_2;
chart.holeRadiusPrecent = 0.5;
[self.view addSubview:chart];
NSString *json_example = @"[ {\"name\":\"first\", \"value\":\"50\", \"color\":\"#84C69B\", \"strokeColor\":\"#fff\"}, \
{\"name\":\"second\", \"value\":\"60\", \"color\":\"#FECEA8\", \"strokeColor\":\"#fff\"}, \
{\"name\":\"second\", \"value\":\"75\", \"color\":\"#F7EEBB\", \"strokeColor\":\"#fff\"}, \
{\"name\":\"second\", \"value\":\"90\", \"color\":\"#D7C1E0\", \"strokeColor\":\"#fff\"} ]";

NSData *data = [json_example dataUsingEncoding:NSUTF8StringEncoding];
NSArray *chartValues = [NSJSONSerialization JSONObjectWithData:data options:0 error:nil];

[chart setChartValues:chartValues animation:YES duration:0.5 options:VBPieChartAnimationFan];
Chart with custom label position
VBPieChart *chart = [[VBPieChart alloc] initWithFrame:CGRectMake(10, 50, 300, 300)];
chart.startAngle = M_PI+M_PI_2;
chart.holeRadiusPrecent = 0.5;
[self.view addSubview:chart];
[chart setLabelsPosition:VBLabelsPositionCustom];
[chart setLabelBlock:^CGPoint( CALayer *layer, NSInteger index) {
    CGPoint p = CGPointMake(sin(-index/10.0*M_PI)*50+50, index*30);
    return p;
}];

[chart setChartValues:@[
                         @{@"name":@"37%", @"value":@65, @"color":@"#5677fcaa", @"labelColor":@"#000"},
                         @{@"name":@"13%", @"value":@23, @"color":@"#2baf2baa", @"labelColor":@"#000"},
                         @{@"name":@"19.3%", @"value":@34, @"color":@"#b0bec5aa", @"labelColor":@"#000"},
                         @{@"name":@"30.7%", @"value":@54, @"color":@"#f57c00aa", @"labelColor":@"#000"}
                         ]
             animation:YES];
Basic Documentation
VBPieChart is subclass of UIView.
Properties
length
Length of circle pie. Min values is 0 and max value 2*M_PI.
startAngle
Start angle of pie. (M_PI will make start at left side)
holeRadiusPrecent
hole radius in % of whole radius. Values 0..1. (acual hole radius will be calculated radius*holeRadiusPrecent)
radiusPrecent
Defines the radius, full radius = frame.size.width/2, actual radius = full radius*radiusPrecent. Value 0..1.
labelBlock
Block will help to redefine positions for labels.
Methods
Get all changed chart values back.
- (NSArray *) chartValues;
Simple setup data.
- (void) setChartValues:(NSArray *)chartValues;
Setup data to pie chart with animation or not, animation options and duration.
- (void) setChartValues:(NSArray *)chartValues animation:(BOOL)animation duration:(float)duration options:(VBPieChartAnimationOptions)options;
Animation options:
VBPieChartAnimationFanAllVBPieChartAnimationGrowthVBPieChartAnimationGrowthAllVBPieChartAnimationGrowthBackVBPieChartAnimationGrowthBackAllVBPieChartAnimationFanVBPieChartAnimationTimingEaseInOutVBPieChartAnimationTimingEaseInVBPieChartAnimationTimingEaseOutVBPieChartAnimationTimingLinear
Change value for elemet at index. Value will be changed with animation.
- (void) setValue:(NSNumber*)value pieceAtIndex:(NSInteger)index;
Insert new piece at index. Animated.
- (void) insertChartValue:(NSDictionary*)chartValue atIndex:(NSInteger)index;
Remove piece at index.
- (void) removePieceAtIndex:(NSInteger)index;
Supported with ad:
<script async src="https://pagead2.googlesyndication.com/pagead/js/adsbygoogle.js"></script> <script> (adsbygoogle = window.adsbygoogle || []).push({}); </script>