


VIM 逐行调试器插件,支持 VIM 8.1 及以上版本,和三种语言(js、python、go)。
安装
环境依赖
在 VIM 8.1.4、Node v10.15.3、Go go1.12.9 darwin/amd64、Python 3.7.0 下测试通过
Vim 版本:Vim-EasyDebugger 依赖 VIM 8.1 及以上,如果是编译安装,需要开启 +terminal 选项,可以通过下面命令查看是否开启了 +terminal 选项:
vim --version | grep terminal
NodeJS 调试器:Node Inspect
NodeJS 调试基于 node inspect(通常 v8.x 及以上的 node 都自带了)。执行下面命令,如果输出 Useage:... 命令的用法,说明支持 Node Inspector:
node inspect
注意旧版的 Node 的调试器的启动命令是 node debug,则需要升级 node 到新版,且要确保 Node 在 v10.x 及以上版本
Go 调试器:Delve
Go 语言的调试基于 Delve,参考官方文档安装。
Python 调试器:PDB
Python 语言基于 Python(3) 自带的 PDB,命令行启动python3 -m -pdb file.py,可参考官方文档。
安装
可选 Pathogen、Vundle 等很棒的插件管理器:
Vim-EasyDebugger 兼容 Linux 和 MacOS,暂不支持 CygWin
- 基于 Pathogen.vim 安装(VIM7 & 8)
进入到 VIM 安装目录中,在 bundle 里安装
cd ~/.vim/bundle/
git clone https://github.com/jayli/vim-easydebugger
- 基于 Vundle.vim 安装(VIM7 & 8)
在.vimrc中添加下面代码,进入vim后执行:PluginInstall
" EasyDebugger 插件
Plugin 'jayli/vim-easydebugger'
- 也可以直接基于 VIM8 安装
git clone https://github.com/jayli/vim-easydebugger.git \
    ~/.vim/pack/dist/start/vim-easydebugger
Done!
快捷键配置
命令列表:
InspectInit、Debugger:启动 VIM 调试器WebInspectInit:启动 Chrome DevTools 调试服务InspectCont:继续执行InspectNext:单步执行InspectStep:单步进入InspectOut:跳出函数InspectPause:暂停执行InspectExit、ExitDebugger:退出调试LocalvarWindow:打开本地变量窗口StackWindow:打开调用堆栈窗口BreakPointSetting: 设置断点
我常用的快捷键配置:
" Vim-EasyDebugger 快捷键配置
" 启动 NodeJS/Python/Go 调试
nmap <S-R>  <Plug>EasyDebuggerInspect
" 启动 NodeJS 的 Web 调试模式
nmap <S-W>  <Plug>EasyDebuggerWebInspect
" 关闭调试
nmap <S-E>  <Plug>EasyDebuggerExit
" 暂停程序
nmap <F6>   <Plug>EasyDebuggerPause
tmap <F6>   <Plug>EasyDebuggerPause
" 跳出函数
nmap <F7>   <Plug>EasyDebuggerStepOut
tmap <F7>   <Plug>EasyDebuggerStepOut
" 进入函数
nmap <F8>   <Plug>EasyDebuggerStepIn
tmap <F8>   <Plug>EasyDebuggerStepIn
" 单步执行
nmap <F9>   <Plug>EasyDebuggerNext
tmap <F9>   <Plug>EasyDebuggerNext
" Continue
nmap <F10>  <Plug>EasyDebuggerContinue
tmap <F10>  <Plug>EasyDebuggerContinue
" 设置断点
nmap <F12>  <Plug>EasyDebuggerSetBreakPoint
定义打开本地变量窗口<Plug>EasyDebuggerLocalvarWindow,定义打开调用堆栈窗口<Plug>EasyDebuggerStackWindow
快捷键说明:
- Shift-R :启动 VIM 调试器
- Shift-W :启动 Chrome DevTools 调试服务(仅支持NodeJS)
- Shift-E :关闭 VIM 调试器
- F6 :暂停执行,pause
- F7 :跳出函数,Python 中为
up命令 - F8 :单步进入,stepin
- F9 :单步执行,next
- F10 :继续执行,continue
- F12 :给当前行设置/取消断点,break
使用
- VIM 调试模式
在 Normal 模式下按下 Shift-R (或者:Debugger)进入 VIM 调试模式。默认情况下启动诸如 python -m pdb {filename} 的命令,其中{filename}为当前所在文件,如果调试运行文件的入口不是当前文件,需要在当前代码前部注释中添加debugger_entry = {filepath},以 Python 为例:
# debugger_entry = ../index.py
退出调试模式:
- 当光标在 Terminal 时,可以使用
Ctrl-D或者exit + 回车退出。 - 在源码窗口
:exit或者:ExitDebugger退出调试。或者Shift-E退出,退出 vim 命令首先会退出 debug
Terminal 窗口如何滚动:进入 Terminal-Normal 模式即可,光标在 Terminal 时通过 Ctrl-w N(Ctrl-w,Shift-N)进入,i 或者 a 再次进入 Terminal 交互模式。
界面说明:
 _______________________________________________________________
|                               |                               |
|                               |                               |
|                               |                               |
|        Source Window          |         Debug Window          |
|    g:debugger.original_winid  |     g:debugger.term_winid     |
|                               |                               |
|                               |                               |
|_______________________________|_______________________________|
|                               |                               |
|          Call Stack           |        Local Variables        |
|    g:debugger.stacks_winid    |   g:debugger.localvars_winid  |
|_______________________________|_______________________________|
Debug Window 为 Terminal,可输入命令。命令参考语言对应的调试器。
- Python
Python 调试支持调用堆栈查看和本地变量监视。常用的快捷键有F9单步执行,F12设置断点,F10继续执行,Shift-E退出调试等。
Python PDB 常用指令:next 下一步,continue 继续执行,w 查看当前堆栈,exit退出调试...
堆栈窗口的打开和关闭:

设置断点:
- JavaScript
JavaScript 暂未实现本地变量监视。启动调试后,程序自动执行 node inspect {filename} 并停留在当前代码第一行(Go 调试器执行dlv debug {filename}),代码窗口对应行高亮。敲击两次 Ctrl-C 终止调试。如果要查看当前变量,NodeJS 需要进入“Read-Eval-Print-Loop”(repl)模式,在左侧终端内输入 repl,输入变量名字即可查看。需要退出 Repl 模式才能继续逐行跟踪,输入 Ctrl-C 退出 Repl 模式。Go 则直接输命令即可,比如vars输出当前包内的变量,locals - {变量名}查看变量的值。
由于 Node Inspector 会将 JS 源码包一层外壳,因此调试器中所示行数通常比源文件多出一到两行,但行号跟源码是一一对应的,基本不影响调试
- Go
启动调试后自动执行dlv debug {filename},并自动停留在 main() 函数处,更多指令参照 Go Delve 官网文档。敲击两次 Ctrl-C 终止调试。也可以执行exit退出调试。
- NodeJS 的 Chrome DevTools 调试模式
NodeJS 提供了基于 Chrome DevTools 的调试,我也封装了进来:
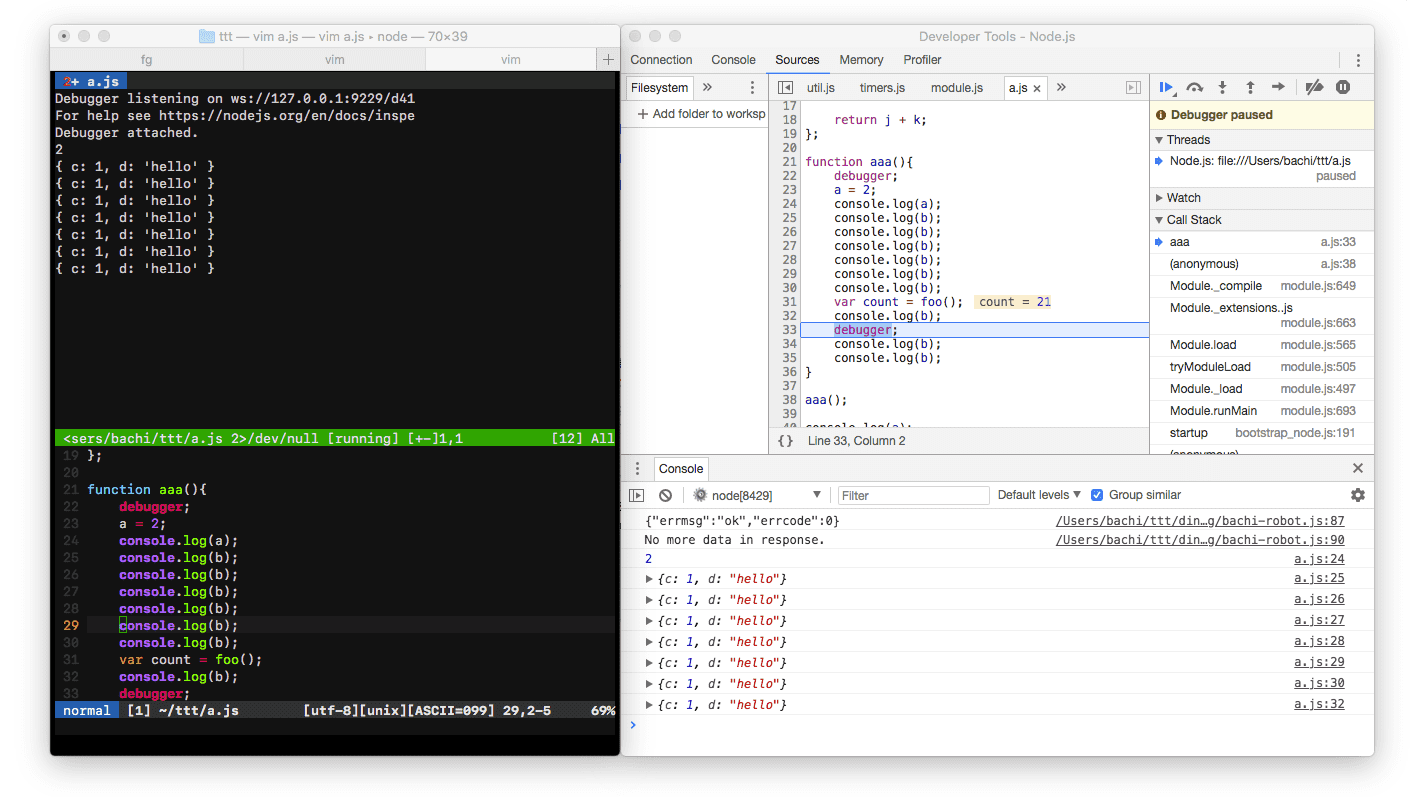
在 normal 模式下按下 Shift-W 开启调试,这时启动了 Debug 服务,打开 Chrome DevTool 即可开始调试。关闭调试:Ctrl-C ,打开 Chrome DevTool 的方法:
- 方法A:在 Chrome 地址栏输入
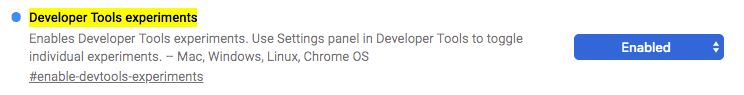
about:inspect,点击Open dedicated DevTools for Node - 方法B:在 Chrome 地址栏输入
chrome://flags/#enable-devtools-experiments,(下图)将devtools-experiments开启,然后每次 Command-Alt-I 打开开发者工具,点击(VIM 中开启调试时才出现)
For Help!?
→ ISSUE
ChangeLog
- TODO:目前不支持 Go 协程和 Python 多线程
- v1.0:
- 支持 Unix 和 MacOS,Windows 平台暂未支持
- 支持语言种类:NodeJS
- v1.1:支持 Go、NodeJS 调试
- v1.2:支持 Quickfix 窗口显示回调堆栈
- v1.3: 放弃 Quickfix 和 Localist,支持 python 和 Go 的本地变量查看,代码重构 & 大量 bugfix