WebPerformanceDashboard
- Introduction
- Requirements
- Installation
- Run The project
- Configuration
- Dashboards Built-in
- Develop
packages/lighthouse - Test local container for
packages/lighthouse - Deploy your container
- GitHub BOT
- Troubleshooting
- Other Tips
Introduction
Web performance dashboard powered by Lighthouse, forked from https://github.com/boyney123/garie with addition of
- Typescript
- Monorepo approach
- GitHub BOT
- Removed Pagespeed Insights (now powered by lighthouse)
- Latest lighthouse
- Grafana dashboards with more details
- more to come.. (Performance delta on target Branch, more metrics, parallel page analysis)
Requirements
- docker >= 18 and Node >= 8
Installation
git clone https://github.com/FeliceGeracitano/webperf-dashboard.gitRun the project
$ docker-compose -f "docker-compose.yml" up -d --buildopen dashboard at localhost, user: admin pass: secret
this will run 4 services
influxdb,chronograf,grafana&felicegeracitano/webperf-dashboard-lighthouse
Configuration
In the root of the application there is a config.json file, which is propagated to packages/lighthouse during docker build step.
example,
{
  "cron": "0 */10 * * * *",
  "urls": [
    { "url": "https://reactjs.org", "options": { "report": true } },
    { "url": "https://vuejs.org", "options": { "report": true } },
    { "url": "https://angular.io", "options": { "report": true } }
  ]
}
Set
reportif you want to save lighthouse report as html.
More info about the cron pattern at https://www.npmjs.com/package/cron
Dashboards Built-in
- Single Audit
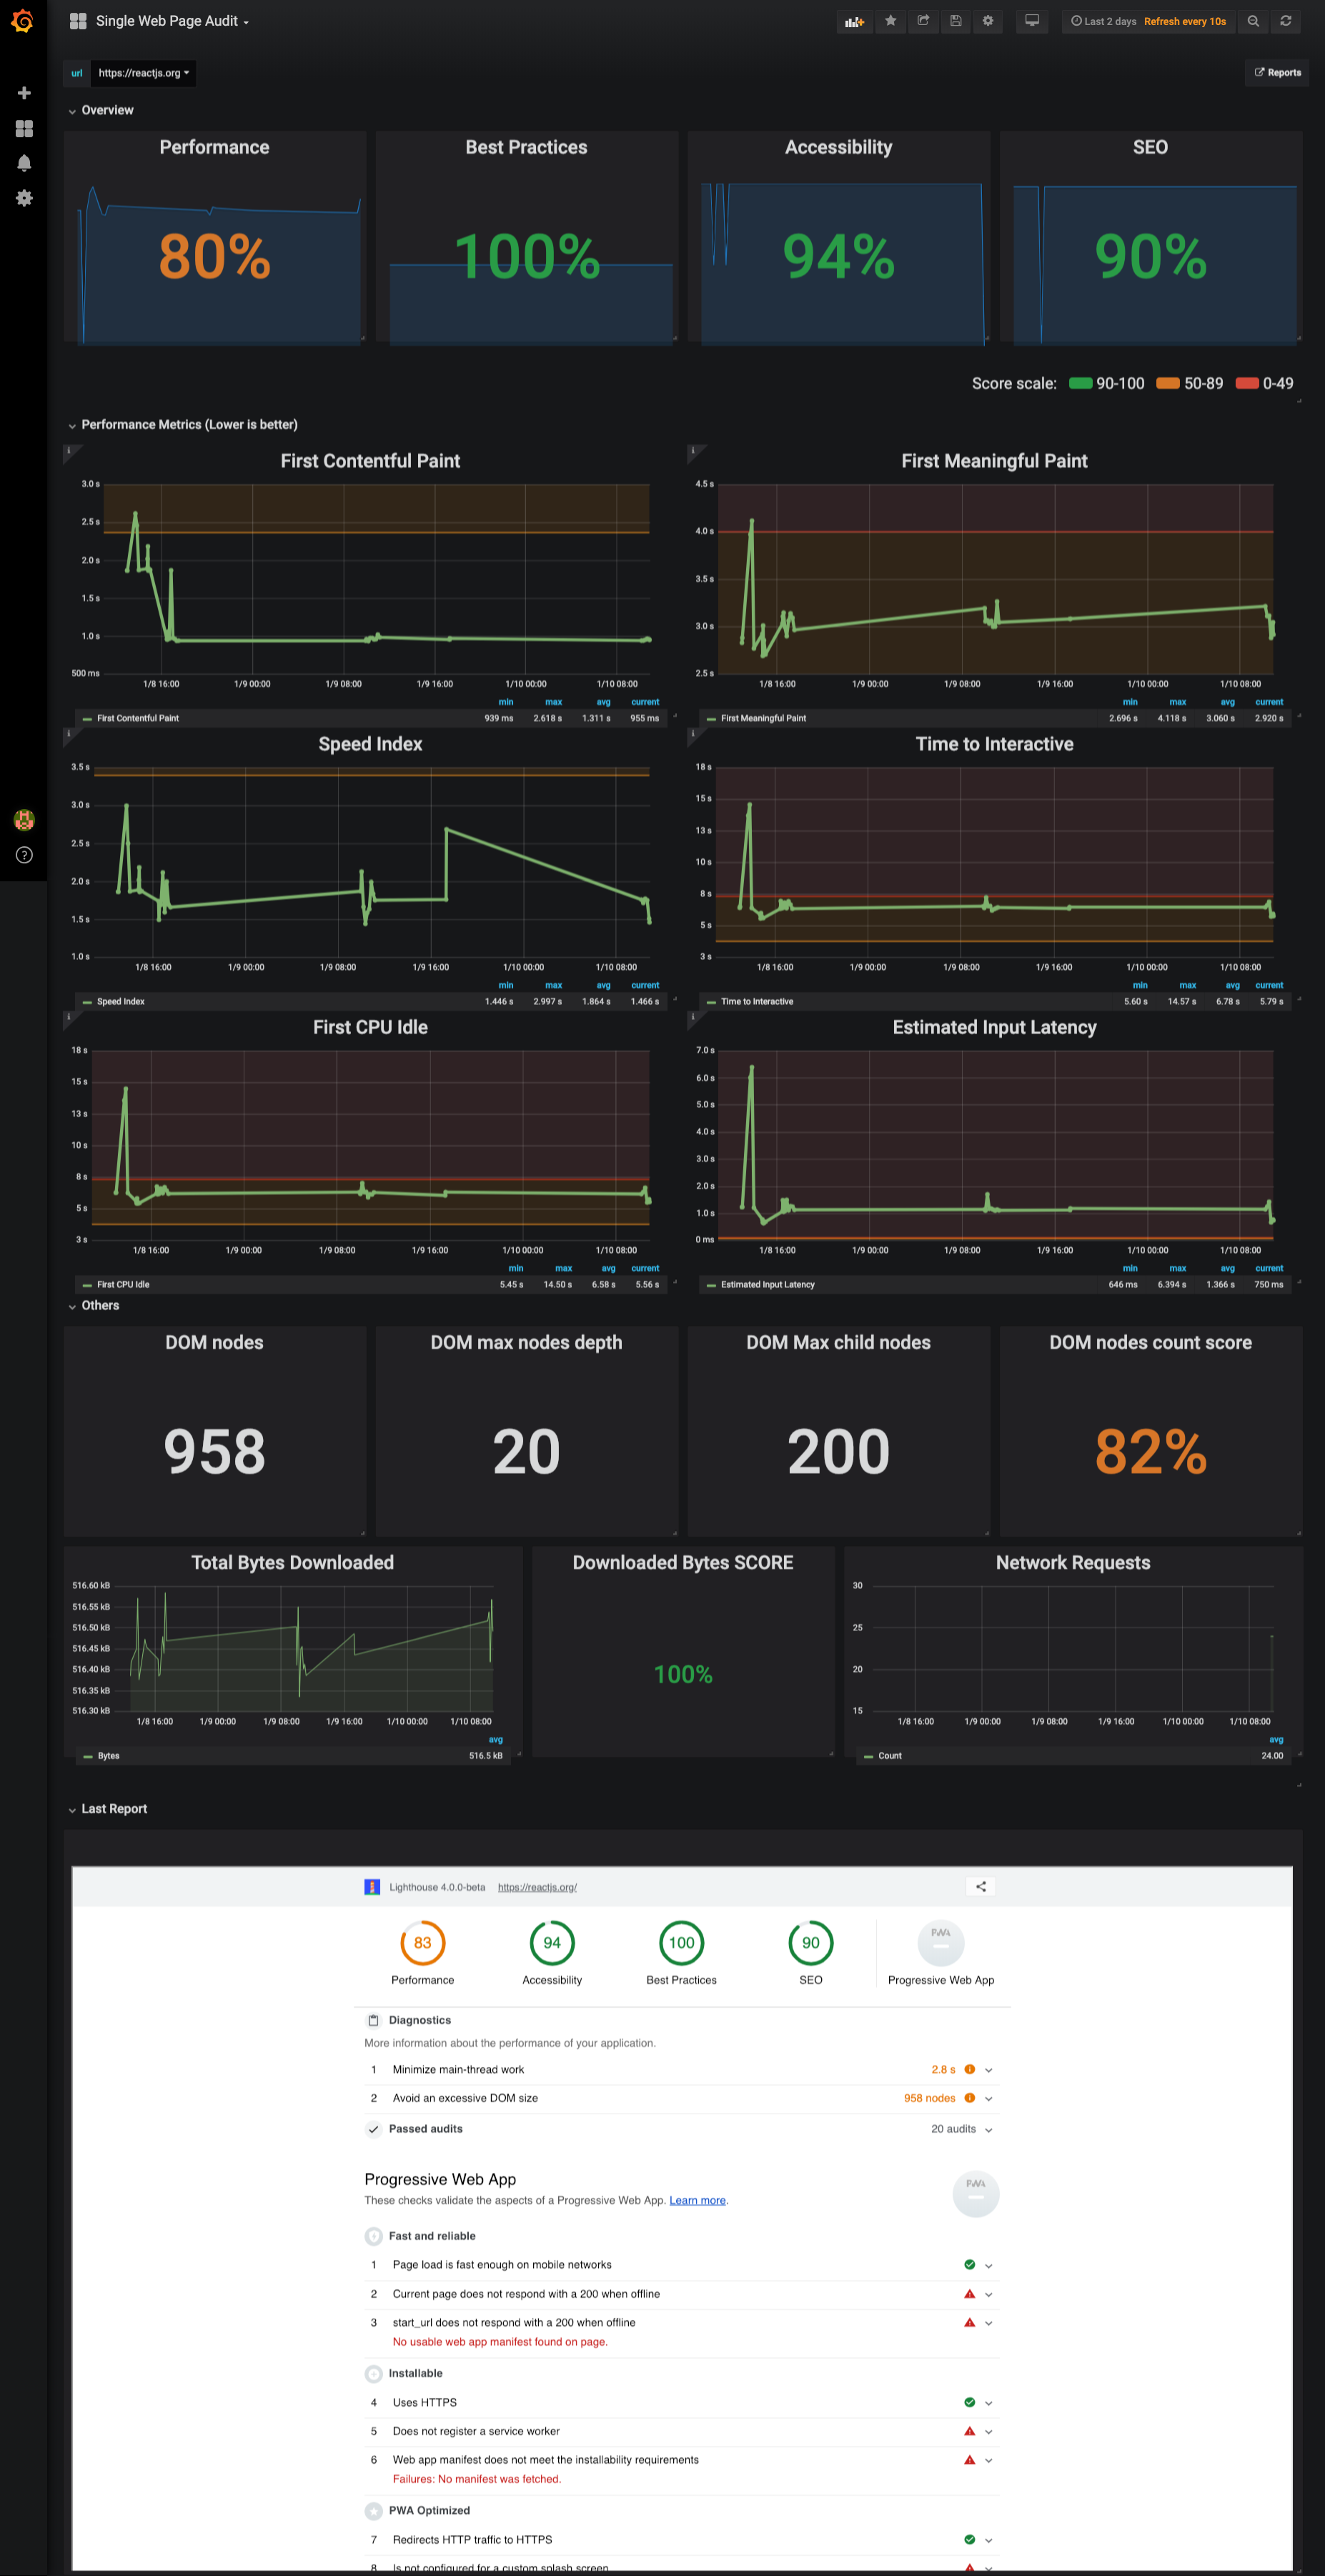
Inspired by the lighthouse report, analyze score trend over time, identify performance metric and their thresholds. Read suggestions directly from Latest Lighthouse report embedded in the dashboard
- Versus
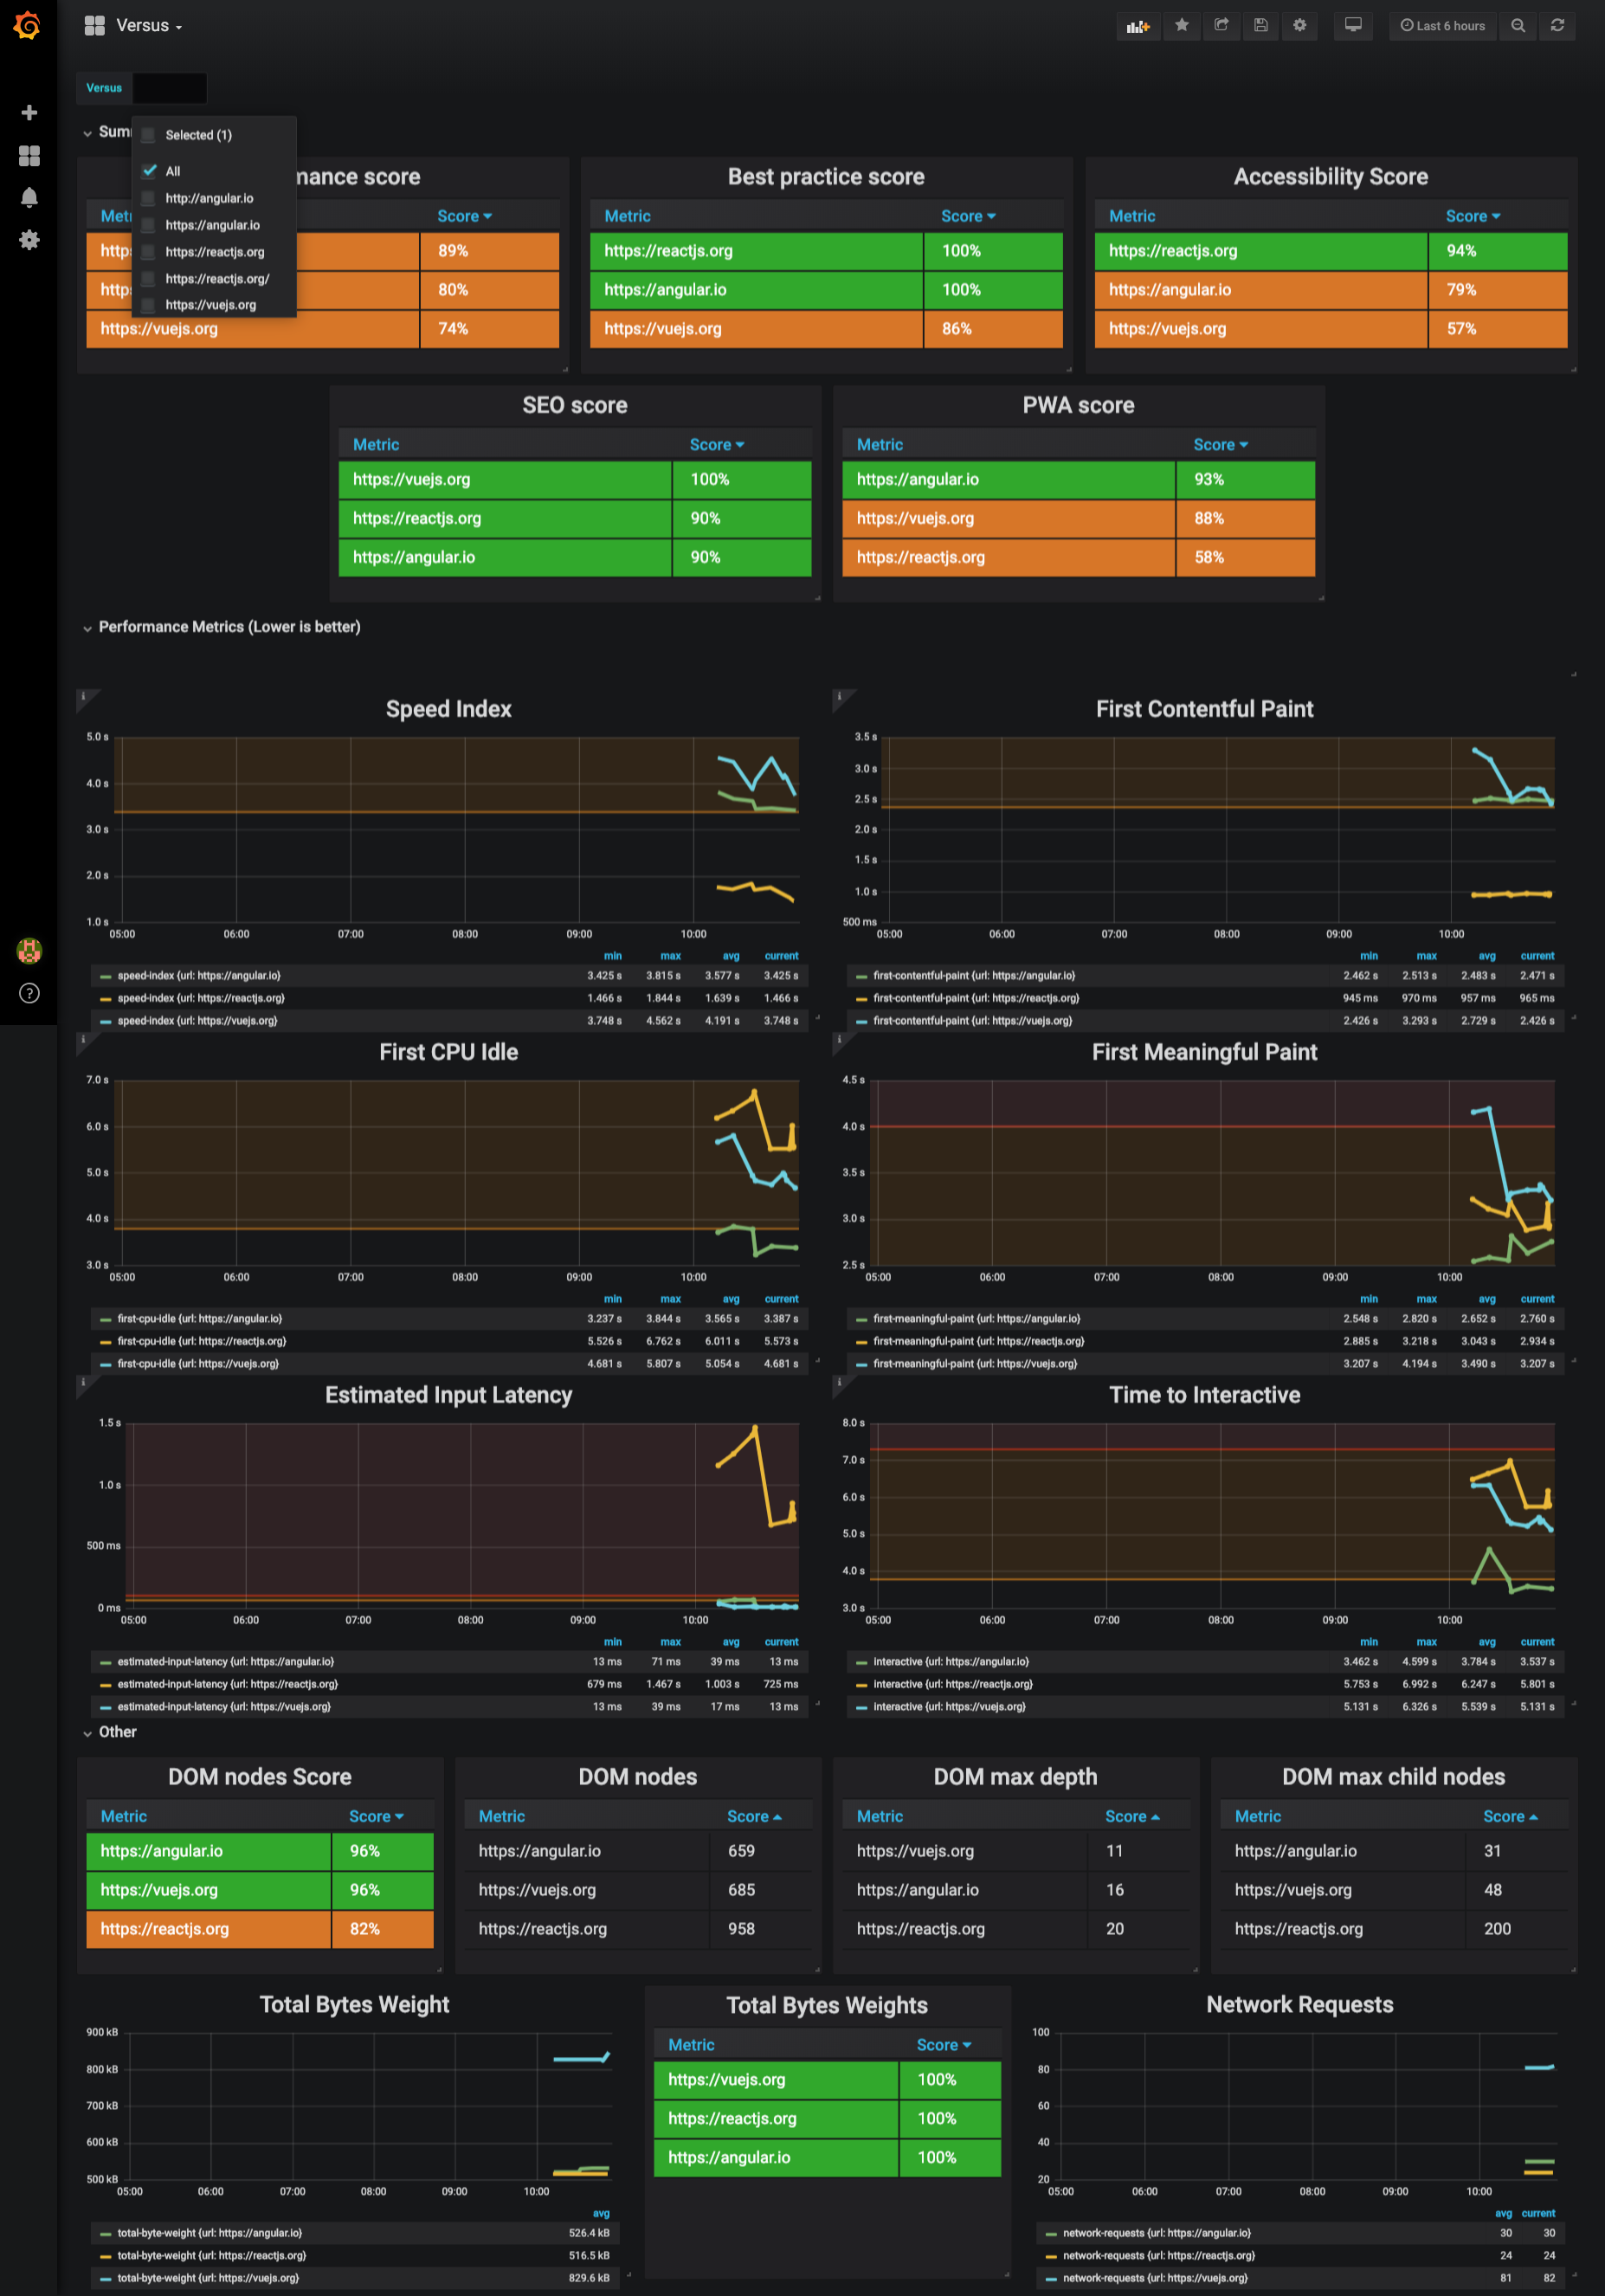
Pretty much a like Single Page Dashboard but oriented to 1vs1 or all comparision.
Develop packages/lighthouse
Comment out felicegeracitano/webperf-dashboard-lighthouse service in docker-compose.yml, then run to spin up dependecies:
$ docker-compose -f "docker-compose.yml" up -d --build
$ cd packages/lighthouse && npm start
Test local container for packages/lighthouse
In docker-compose.yml replace felicegeracitano/webperf-dashboard-lighthouse with
webperf-dashboard-lighthouse (or any other local name you prefer), then run:
$ cd packages/lighthouse && docker build -t webperf-dashboard-lighthouse .
$ cd ../.. && docker-compose up
Deploy your container
$ cd packages/lighthouse
$ docker tag webperf-dashboard-lighthouse:latest felicegeracitano/webperf-dashboard-lighthouse:latest
$ docker push felicegeracitano/webperf-dashboard-lighthouse:latest
Tip:
replace latest tag with fixed version etc 1.1, 2.0...
Troubleshooting
- Kills all running containers with
docker kill $(docker ps -q) - Delete all stopped containers with
docker rm $(docker ps -a -q) - Delete all images with
docker rmi $(docker images -q)
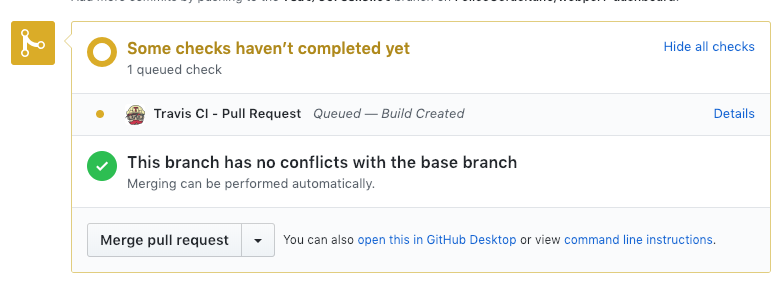
GitHub BOT
You can improve reviewers life running Lighthouse audit on every PR update. In this repo there is an example using a Travis CI, the job communicate progress and result to GitHub.
Running Job:
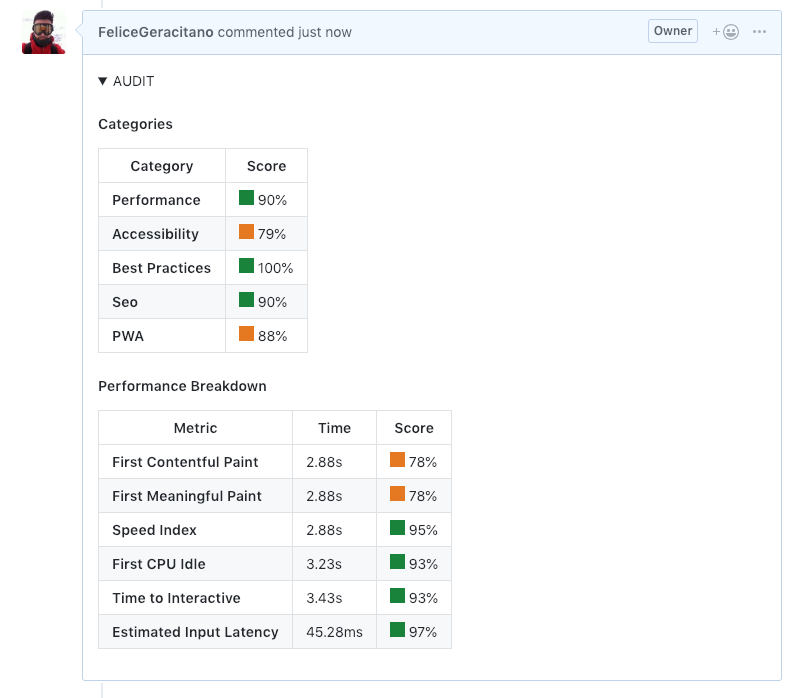
Result Comment from the BOT:
Configure your repo with a Travis Job:
- Enbale Travis Intergation for your repo (https://travis-ci.com/)
- Enable build on Pull request: https://travis-ci.com/{owner}/{repo}/settings
- Generate Github Access token here: https://github.com/settings/tokens
- Set enviroment an variable called
GITHUB_TOKENfor your Travis job with the GitHub token here: https://travis-ci.com/{owner}/{repo}/settings - Commit a
.travis.ymlfile in your repo similar to: https://github.com/FeliceGeracitano/webperf-dashboard/blob/master/.travis.yml
if you inspect run_audit.sh you will notice that you need to provide an url of your running up. This obsvously depends on your app, you can choose to build your app in the travis job itsels or provide an external URL.
run_audit.shwill launch the lighthouse service and inspectig your app, posting the result in the PR created.
Other Tips
- if you use VSCODE install docker extensions to manage, start & stop containers: https://marketplace.visualstudio.com/items?itemName=peterjausovec.vscode-docker