AC-D3 / Ac D3
Javascript Library for building Audiovisual Charts in D3
Stars: ✭ 76
Programming Languages
javascript
184084 projects - #8 most used programming language
Labels
Projects that are alternatives of or similar to Ac D3
Just Dashboard
📊 📋 Dashboards using YAML or JSON files
Stars: ✭ 1,511 (+1888.16%)
Mutual labels: data, data-visualization, chart, d3
Anychart
AnyChart is a lightweight and robust JavaScript charting solution with great API and documentation. The chart types and unique features are numerous, the library works easily with any development stack.
Stars: ✭ 288 (+278.95%)
Mutual labels: data-visualization, chart, charts, javascript-library
Reaviz
📊 Data visualization library for React based on D3
Stars: ✭ 215 (+182.89%)
Mutual labels: data-visualization, chart, charts, d3
Unity Ugui Xcharts
A charting and data visualization library for Unity. 一款基于UGUI的数据可视化图表插件。
Stars: ✭ 1,086 (+1328.95%)
Mutual labels: data-visualization, chart, charts
Victory Chart
Chart Component for Victory
Stars: ✭ 286 (+276.32%)
Mutual labels: data-visualization, charts, d3
React Jsx Highcharts
Highcharts built with proper React components
Stars: ✭ 336 (+342.11%)
Mutual labels: data-visualization, chart, charts
Aachartcore
📈📊☕️☕️☕️An elegant modern declarative data visualization chart framework for Android. Extremely powerful, supports line, spline, area, areaspline, column, bar, pie, scatter, angular gauges, arearange, areasplinerange, columnrange, bubble, box plot, error bars, funnel, waterfall and polar chart types.极其精美而又强大的 Android 数据可视化图表框架,支持柱状图、条形图、折线图、曲线图、折线填充图、曲线填充图、气泡图、扇形图、环形图、散点图、雷达图、混合图等各种类型的多达几十种的信息图图表,完全满足工作所需.
Stars: ✭ 424 (+457.89%)
Mutual labels: data-visualization, chart, charts
Britecharts
Client-side reusable Charting Library based on D3.js v5 that allows easy and intuitive use of charts and components that can be composed together creating amazing visualizations.
Stars: ✭ 3,688 (+4752.63%)
Mutual labels: data-visualization, chart, d3
Victory Pie
D3 pie & donut chart component for React
Stars: ✭ 61 (-19.74%)
Mutual labels: data-visualization, charts, d3
Uplot
📈 A small, fast chart for time series, lines, areas, ohlc & bars
Stars: ✭ 6,808 (+8857.89%)
Mutual labels: data-visualization, chart, charts
Datagear
数据可视化分析平台,使用Java语言开发,采用浏览器/服务器架构,支持SQL、CSV、Excel、HTTP接口、JSON等多种数据源
Stars: ✭ 266 (+250%)
Mutual labels: data, data-visualization, chart
Jschema
A simple, easy to use data modeling framework for JavaScript
Stars: ✭ 261 (+243.42%)
Mutual labels: data, data-visualization, javascript-library
Gojs
JavaScript diagramming library for interactive flowcharts, org charts, design tools, planning tools, visual languages.
Stars: ✭ 5,739 (+7451.32%)
Mutual labels: data-visualization, chart, javascript-library
Amcharts4
The most advanced amCharts charting library for JavaScript and TypeScript apps.
Stars: ✭ 907 (+1093.42%)
Mutual labels: data-visualization, chart, charts
Flutter echarts
A Flutter widget to use Apache ECharts (incubating) in a reactive way.
Stars: ✭ 420 (+452.63%)
Mutual labels: data-visualization, chart, charts
Keen Dataviz.js
Data Visualization Charting Library
Stars: ✭ 215 (+182.89%)
Mutual labels: data-visualization, charts, d3
Resonance
◾️Resonance | 5kb React animation library
Stars: ✭ 1,011 (+1230.26%)
Mutual labels: data, charts, d3
Clip
Create charts from the command line
Stars: ✭ 5,111 (+6625%)
Mutual labels: data-visualization, chart, charts
Reasonbizcharts
ReasonML binding for BizCharts https://bizcharts.net/products/bizCharts/demo
Stars: ✭ 23 (-69.74%)
Mutual labels: data-visualization, chart, charts

AC-D3 is a Javascript Library for building Audiovisual Charts in D3.
- Build predefined visualizations
- Use AC-D3 methods to add audiovisual elements to your D3 visualization
Installation
$ npm install ac-d3 --save
Using AC-D3
HTML
- Create div with specific ID (Used in config object later)
<div id='vis1'></div>
Javascript
- Require in library
const acd3 = require('ac-d3');
- Create data array
Bubble Chart:
| Key | Value datatype | Note |
|---|---|---|
| src | string | Accepts paths to HTML5 supported file types and Vimeo and YouTube embedded URL links. |
| scalingParameter | number | Used to determine the relative size of each bubble. |
| v_id | string | Must be unique for each video. |
| type | string | Either 'video' (for direct URL path), 'vimeo', or 'youtube'. |
const bubbleChartData = [
      {
        "src": 'https://www.youtube.com/embed/F-eMt3SrfFU',
        "scalingParameter": 36,
        "v_id": "vid1",
        "type": "youtube"
    },
    {
        "src": "https://player.vimeo.com/video/12868296",
        "scalingParameter": 12,
        "v_id": "vid2",
        "type": "vimeo"
    },
    {
        "src": "http://upload.wikimedia.org/wikipedia/commons/7/79/Big_Buck_Bunny_small.ogv",
        "scalingParameter": 24,
        "v_id": "vid3",
        "type": "video"
    }]
Bubble Scatter Chart:
| Key | Value datatype | Note |
|---|---|---|
| src | string | Accepts paths to HTML5 supported file types and Vimeo and YouTube embedded URL links. |
| v_id | string | Must be unique for each video. |
| type | string | Either 'video' (for direct URL path), 'vimeo', or 'youtube'. |
| x | number or date string | Used to determine the x position of the center of bubble. |
| y | number or date string | Used to determine the y position of the center of bubble. |
| r | number or date string | Used to determine the relative size of each bubble. |
const bubbleScatterChartData = [
      {
        "src": 'https://www.youtube.com/embed/F-eMt3SrfFU',
        "v_id": "vid4",
        "type": "youtube",
        "x": "18-Dec-09",
        "y": 425000000,
        "r": 2783918982
    },
    {
        "src": "https://player.vimeo.com/video/12868296",
        "v_id": "vid5",
        "type": "vimeo",
        "x": "24-May-07",
        "y": 306000000,
        "r": 2058662225
    },
    {
        "src": "http://upload.wikimedia.org/wikipedia/commons/7/79/Big_Buck_Bunny_small.ogv",
        "v_id": "vid6",
        "type": "video",
        "x": "6-Nov-15",
        "y": 425000000,
        "r": 2783918982
    }]
- Create config object
Bubble Chart Config Options:
| Key | Value datatype | Note |
|---|---|---|
| chartType | string | Type of chart to create (current options are 'bubble' and 'bubbleScatter') |
| htmlAnchorID | string | ID of the div where AC-D3 will append the visualization |
| diameter | number | Overall diameter of the visualization in pixels |
| zoom | number | Zoom level of each of the videos |
| resolutionThresholds | array | This sets the bounds for which video resolution to use depending on height of the video (in pixels) |
| autoplay | boolean | This specifies whether the videos will begin playing automatically or not |
| loop | boolean | This specifies whether videos will start over again, every time it is finished |
| onDoubleClick | string | This specifies which event handler to invoke on dblclick (current options are 'openNewWindow', a function that opens the video in a new window, and 'expandBubble', a function that expands the size of the bubbe to fill the entire visualization) |
const bubbleConfig = {
  chartType: 'bubble',
  htmlAnchorID: 'vis1',
  diameter: 600,
  zoom: 1.5,
  resolutionThresholds: [250, 500],
  autoplay: false,
  loop: false,
  onDoubleClick: 'expandBubble'
}
Bubble Scatter Chart Config Options:
| Key | Value datatype | Note |
|---|---|---|
| chartType | string | Type of chart to create (current options are 'bubble' and 'bubbleScatter') |
| htmlAnchorID | string | ID of the div where AC-D3 will append the visualization |
| height | number | Overall height of the visualization in pixels |
| width | number | Overall width of the visualization in pixels |
| zoom | number | Zoom level of each of the videos |
| resolutionThresholds | array | This sets the bounds for which video resolution to use depending on height of the video (in pixels) |
| autoplay | boolean | This specifies whether the videos will begin playing automatically or not |
| loop | boolean | This specifies whether videos will start over again, every time it is finished |
| onDoubleClick | string | This specifies which event handler to invoke on dblclick (current options are 'openNewWindow', a function that opens the video in a new window, and 'expandBubble', a function that expands the size of the bubbe to fill the entire visualization) |
| dateFormat | string | This specifies the date format used |
| xIsDate | boolean | This specifies whether the data for the x position is a date |
| yIsDate | boolean | This specifies whether the data for the y position is a date |
| rIsDate | boolean | This specifies whether the data for the r dimension is a date |
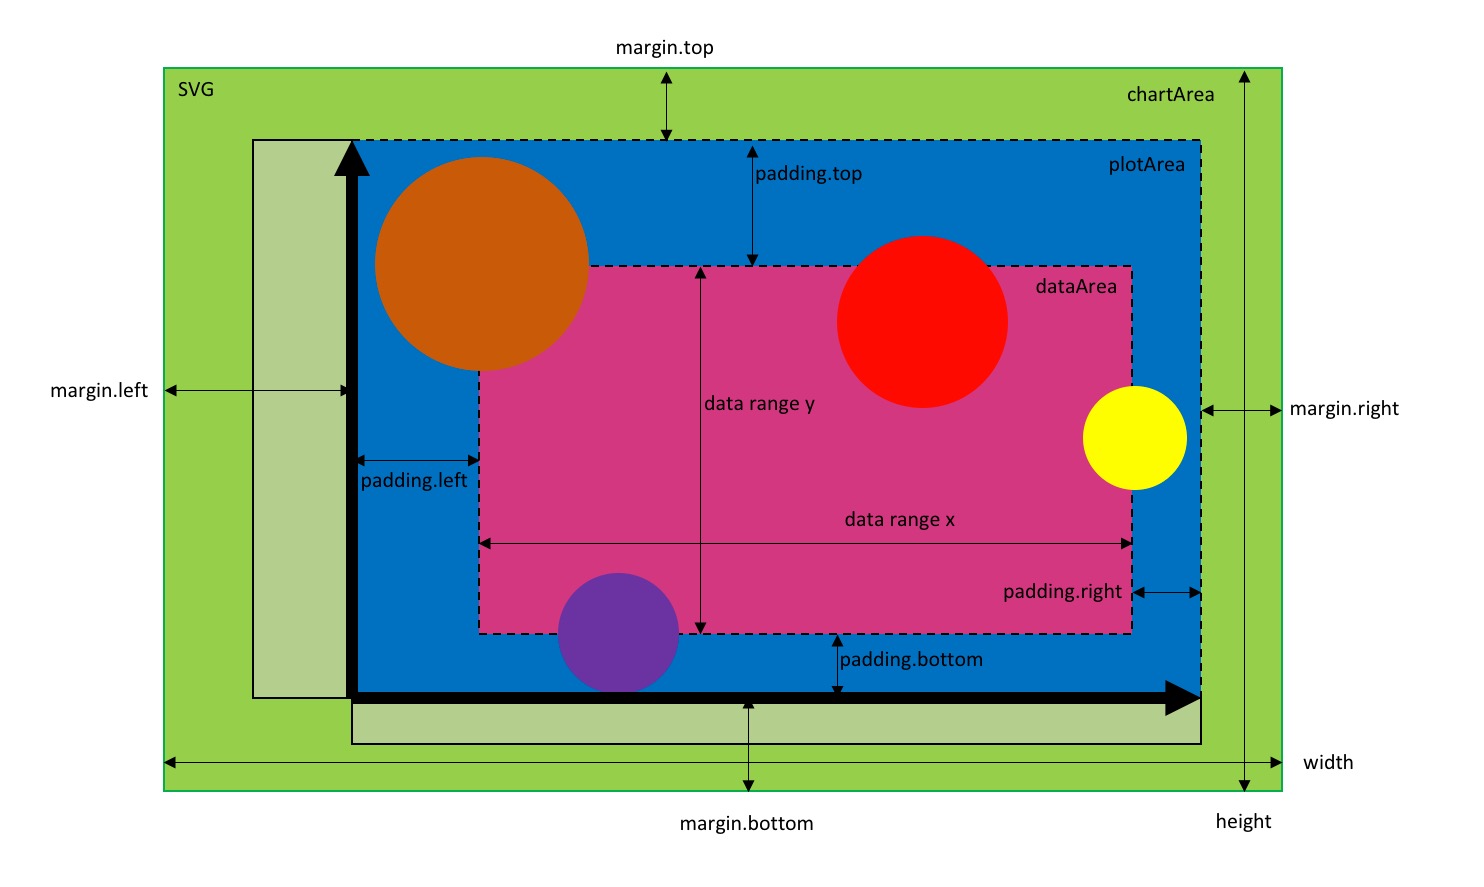
| plottableAreaMargin | object | See example and diagram below |
| plottableAreaPadding | object | See example and diagram below |
| rLimits | object | See example and diagram below |
const bubbleScatterConfig = {
  chartType: 'bubbleScatter',
  htmlAnchorID: 'vis2',
  height: 600,
  height: 900,
  zoom: 1.5,
  resolutionThresholds: [250, 500],
  autoplay: false,
  loop: false,
  onDoubleClick: 'openNewWindow',
  dateFormat: '%d-%b-%y',
  xIsDate: true,
  yIsDate: false,
  rIsDate: false,
  plottableAreaMargin: { top: 0, right: 0, bottom: 30, left: 65 },
  plottableAreaPadding: { top: 120, right: 100, bottom: 80, left: 60 },
  rLimits: { lower: 20, upper: 120 }
}
 4) Create a new chart instance and invoke the createBubbleChart or createBubbleScatterChart method
const chart1 = new acd3(data, config);
chart1.createBubbleChart();
const chart2 = new acd3(data, config);
chart2.createBubbleScatterChart();
Note that the project description data, including the texts, logos, images, and/or trademarks,
for each open source project belongs to its rightful owner.
If you wish to add or remove any projects, please contact us at [email protected].