All Projects → entronad → Flutter_echarts

entronad / Flutter_echarts

Licence: other
A Flutter widget to use Apache ECharts (incubating) in a reactive way.

Programming Languages

javascript
184084 projects - #8 most used programming language
dart
5743 projects

Projects that are alternatives of or similar to Flutter echarts

Anychart
AnyChart is a lightweight and robust JavaScript charting solution with great API and documentation. The chart types and unique features are numerous, the library works easily with any development stack.
Stars: ✭ 288 (-31.43%)
Mutual labels:  data-visualization, chart, charts, charting-library
Echarts
Apache ECharts is a powerful, interactive charting and data visualization library for browser
Stars: ✭ 49,119 (+11595%)
Mutual labels:  data-visualization, charts, echarts, charting-library
Amcharts4
The most advanced amCharts charting library for JavaScript and TypeScript apps.
Stars: ✭ 907 (+115.95%)
Mutual labels:  data-visualization, chart, charts, charting-library
React Jsx Highcharts
Highcharts built with proper React components
Stars: ✭ 336 (-20%)
Mutual labels:  data-visualization, chart, charts, charting-library
Graphic
A Flutter data visualization library based on Grammar of Graphics.
Stars: ✭ 173 (-58.81%)
Mutual labels:  data-visualization, chart, charts, charting-library
Anychart Android
AnyChart Android Chart is an amazing data visualization library for easily creating interactive charts in Android apps. It runs on API 19+ (Android 4.4) and features dozens of built-in chart types.
Stars: ✭ 1,762 (+319.52%)
Mutual labels:  data-visualization, chart, charts, charting-library
Reasonbizcharts
ReasonML binding for BizCharts https://bizcharts.net/products/bizCharts/demo
Stars: ✭ 23 (-94.52%)
Mutual labels:  data-visualization, chart, charts
React Vis
Data Visualization Components
Stars: ✭ 8,091 (+1826.43%)
Mutual labels:  data-visualization, chart, charting-library
Unity Ugui Xcharts
A charting and data visualization library for Unity. 一款基于UGUI的数据可视化图表插件。
Stars: ✭ 1,086 (+158.57%)
Mutual labels:  data-visualization, chart, charts
Clip
Create charts from the command line
Stars: ✭ 5,111 (+1116.9%)
Mutual labels:  data-visualization, chart, charts
Ac D3
Javascript Library for building Audiovisual Charts in D3
Stars: ✭ 76 (-81.9%)
Mutual labels:  data-visualization, chart, charts
Timeline Plus
Timeline - chronological visualization of your data
Stars: ✭ 140 (-66.67%)
Mutual labels:  data-visualization, chart, charting-library
Plotly.js
Open-source JavaScript charting library behind Plotly and Dash
Stars: ✭ 14,268 (+3297.14%)
Mutual labels:  data-visualization, charts, charting-library
Keen Dataviz.js
Data Visualization Charting Library
Stars: ✭ 215 (-48.81%)
Mutual labels:  data-visualization, charts, charting-library
Uplot
📈 A small, fast chart for time series, lines, areas, ohlc & bars
Stars: ✭ 6,808 (+1520.95%)
Mutual labels:  data-visualization, chart, charts
React Chartjs 2
React components for Chart.js, the most popular charting library
Stars: ✭ 4,667 (+1011.19%)
Mutual labels:  chart, charts, charting-library
Aachartcore
📈📊☕️☕️☕️An elegant modern declarative data visualization chart framework for Android. Extremely powerful, supports line, spline, area, areaspline, column, bar, pie, scatter, angular gauges, arearange, areasplinerange, columnrange, bubble, box plot, error bars, funnel, waterfall and polar chart types.极其精美而又强大的 Android 数据可视化图表框架,支持柱状图、条形图、折线图、曲线图、折线填充图、曲线填充图、气泡图、扇形图、环形图、散点图、雷达图、混合图等各种类型的多达几十种的信息图图表,完全满足工作所需.
Stars: ✭ 424 (+0.95%)
Mutual labels:  data-visualization, chart, charts
Reactochart
📈 React chart component library 📉
Stars: ✭ 459 (+9.29%)
Mutual labels:  data-visualization, charts, charting-library
Matplotplusplus
Matplot++: A C++ Graphics Library for Data Visualization 📊🗾
Stars: ✭ 2,433 (+479.29%)
Mutual labels:  data-visualization, charts, charting-library
Reaviz
📊 Data visualization library for React based on D3
Stars: ✭ 215 (-48.81%)
Mutual labels:  data-visualization, chart, charts

中文

pub

A Flutter widget to use Apache ECharts (incubating) in a reactive way.

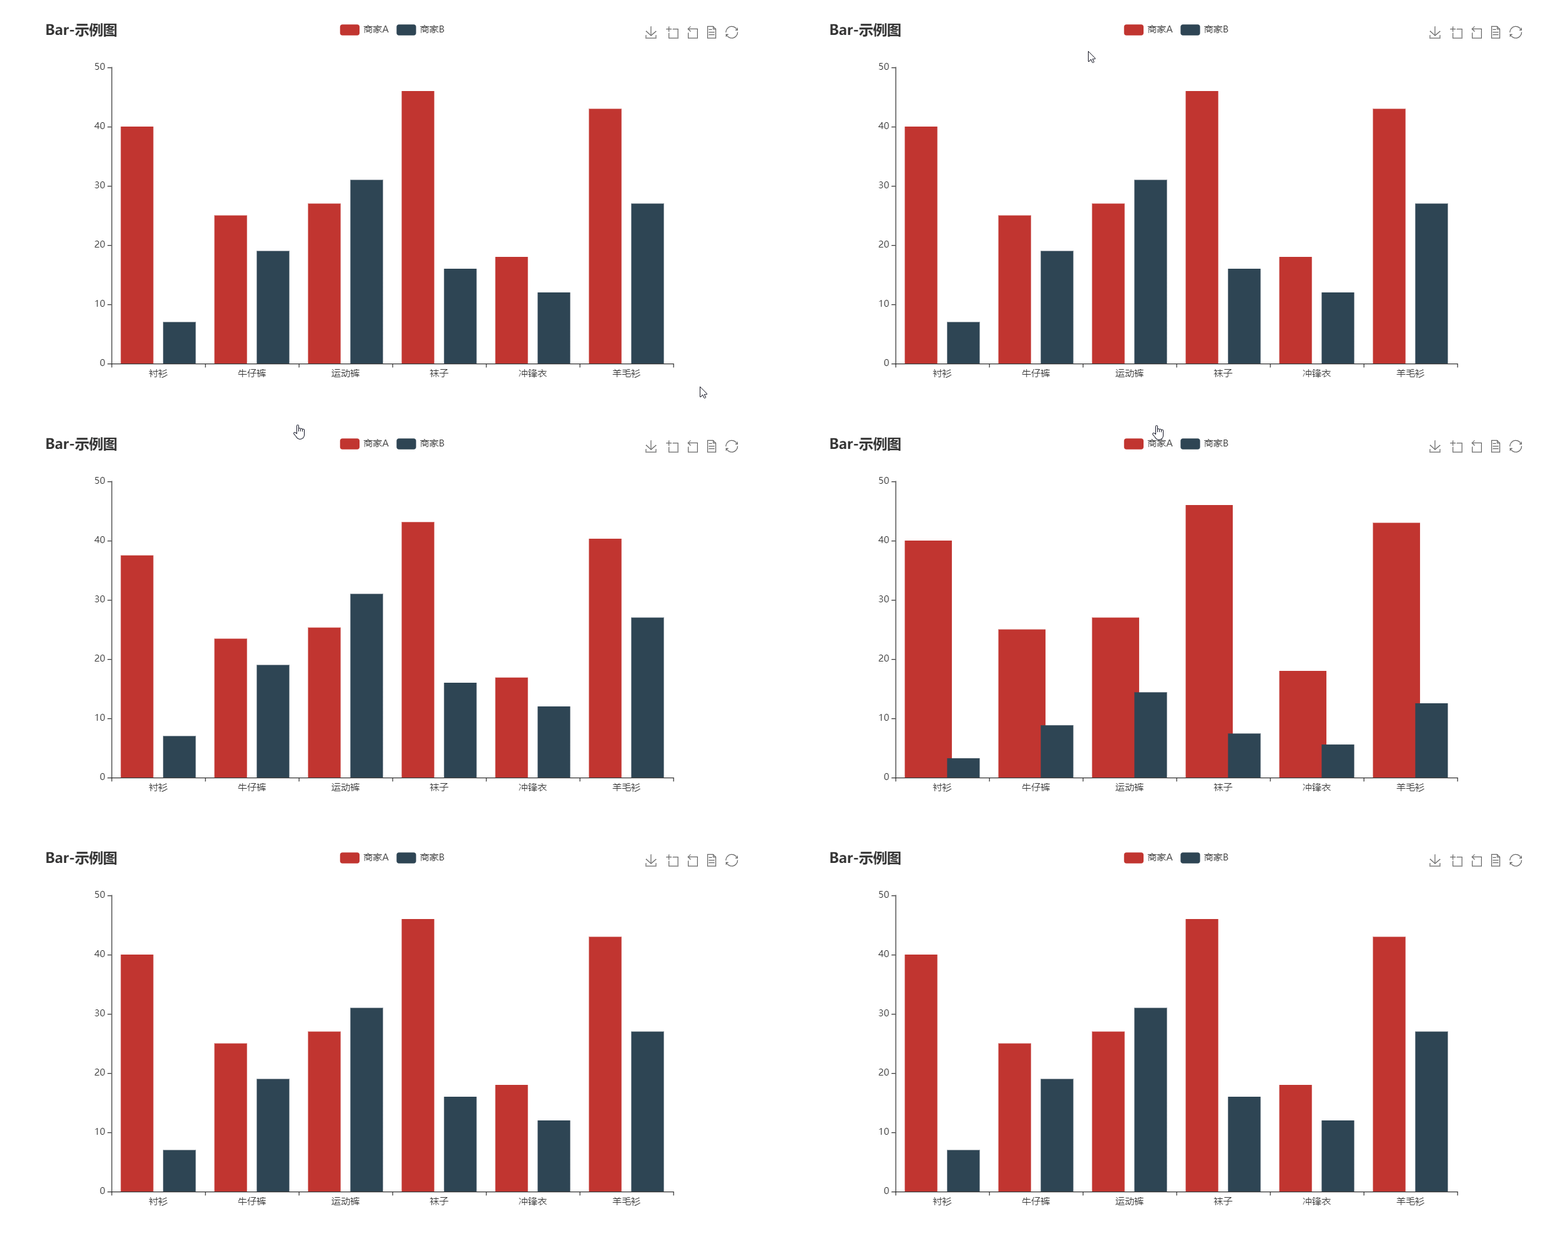
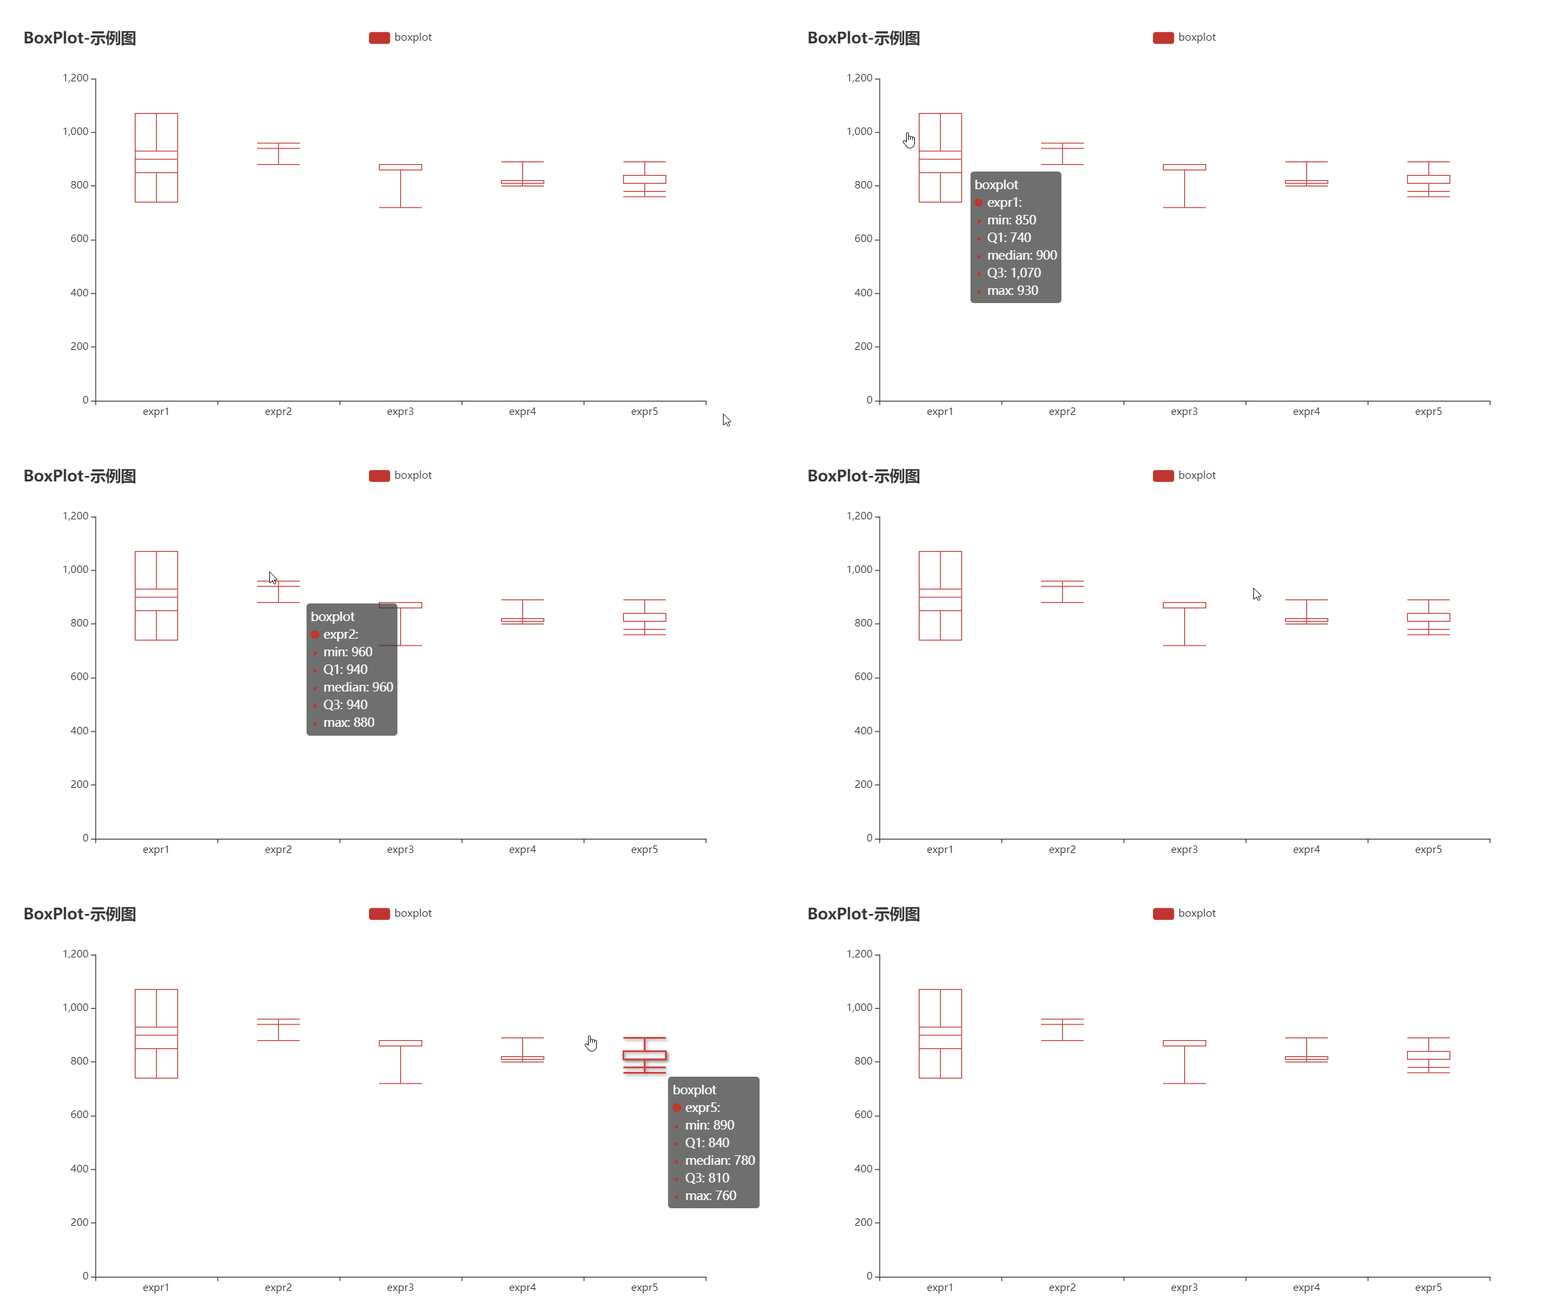
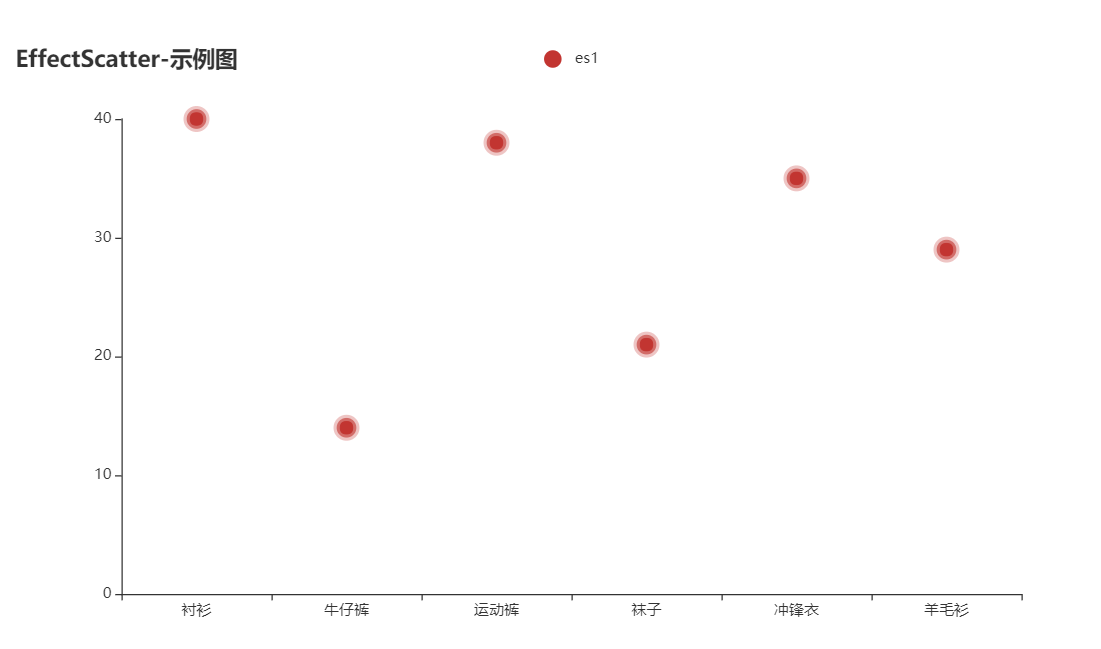
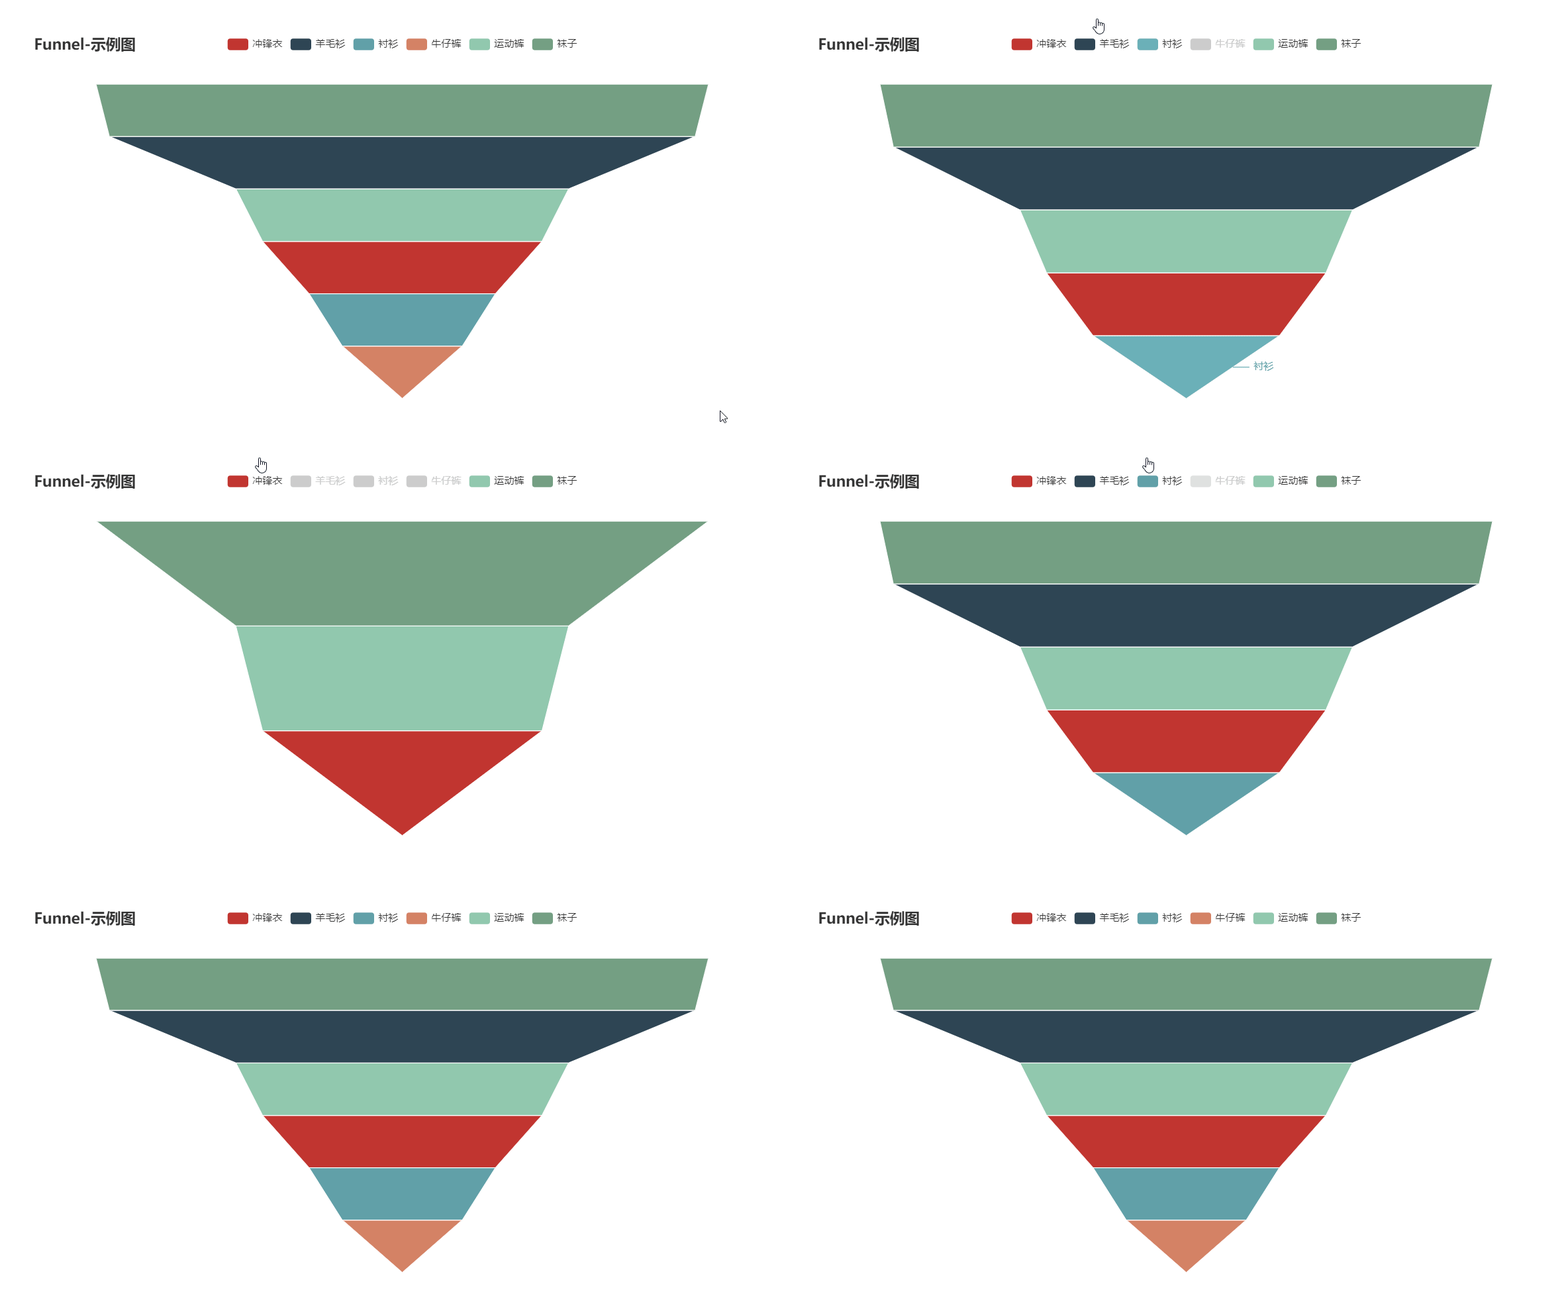
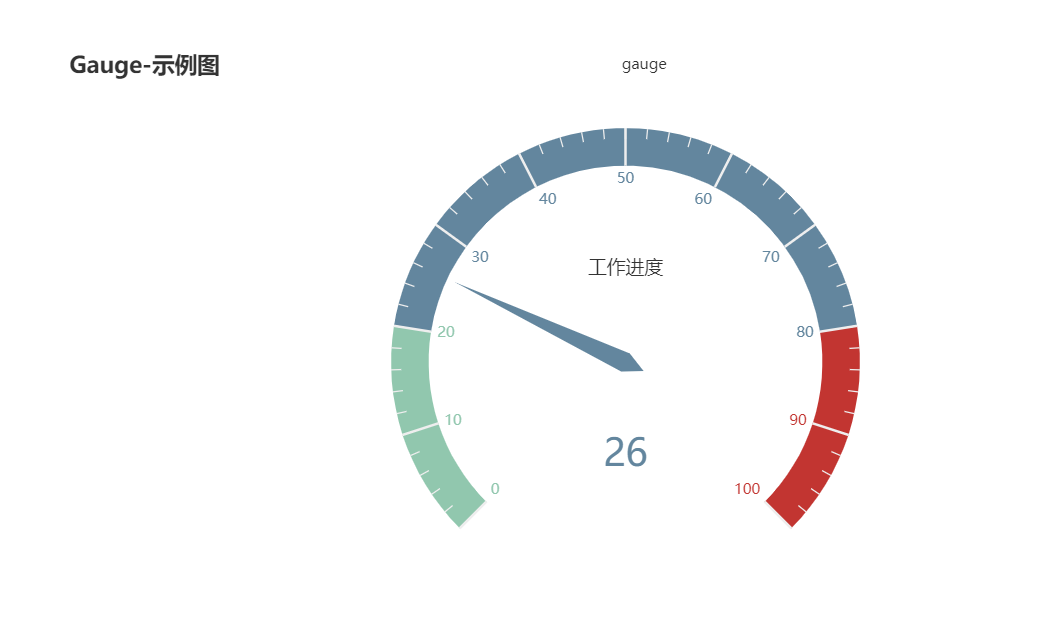
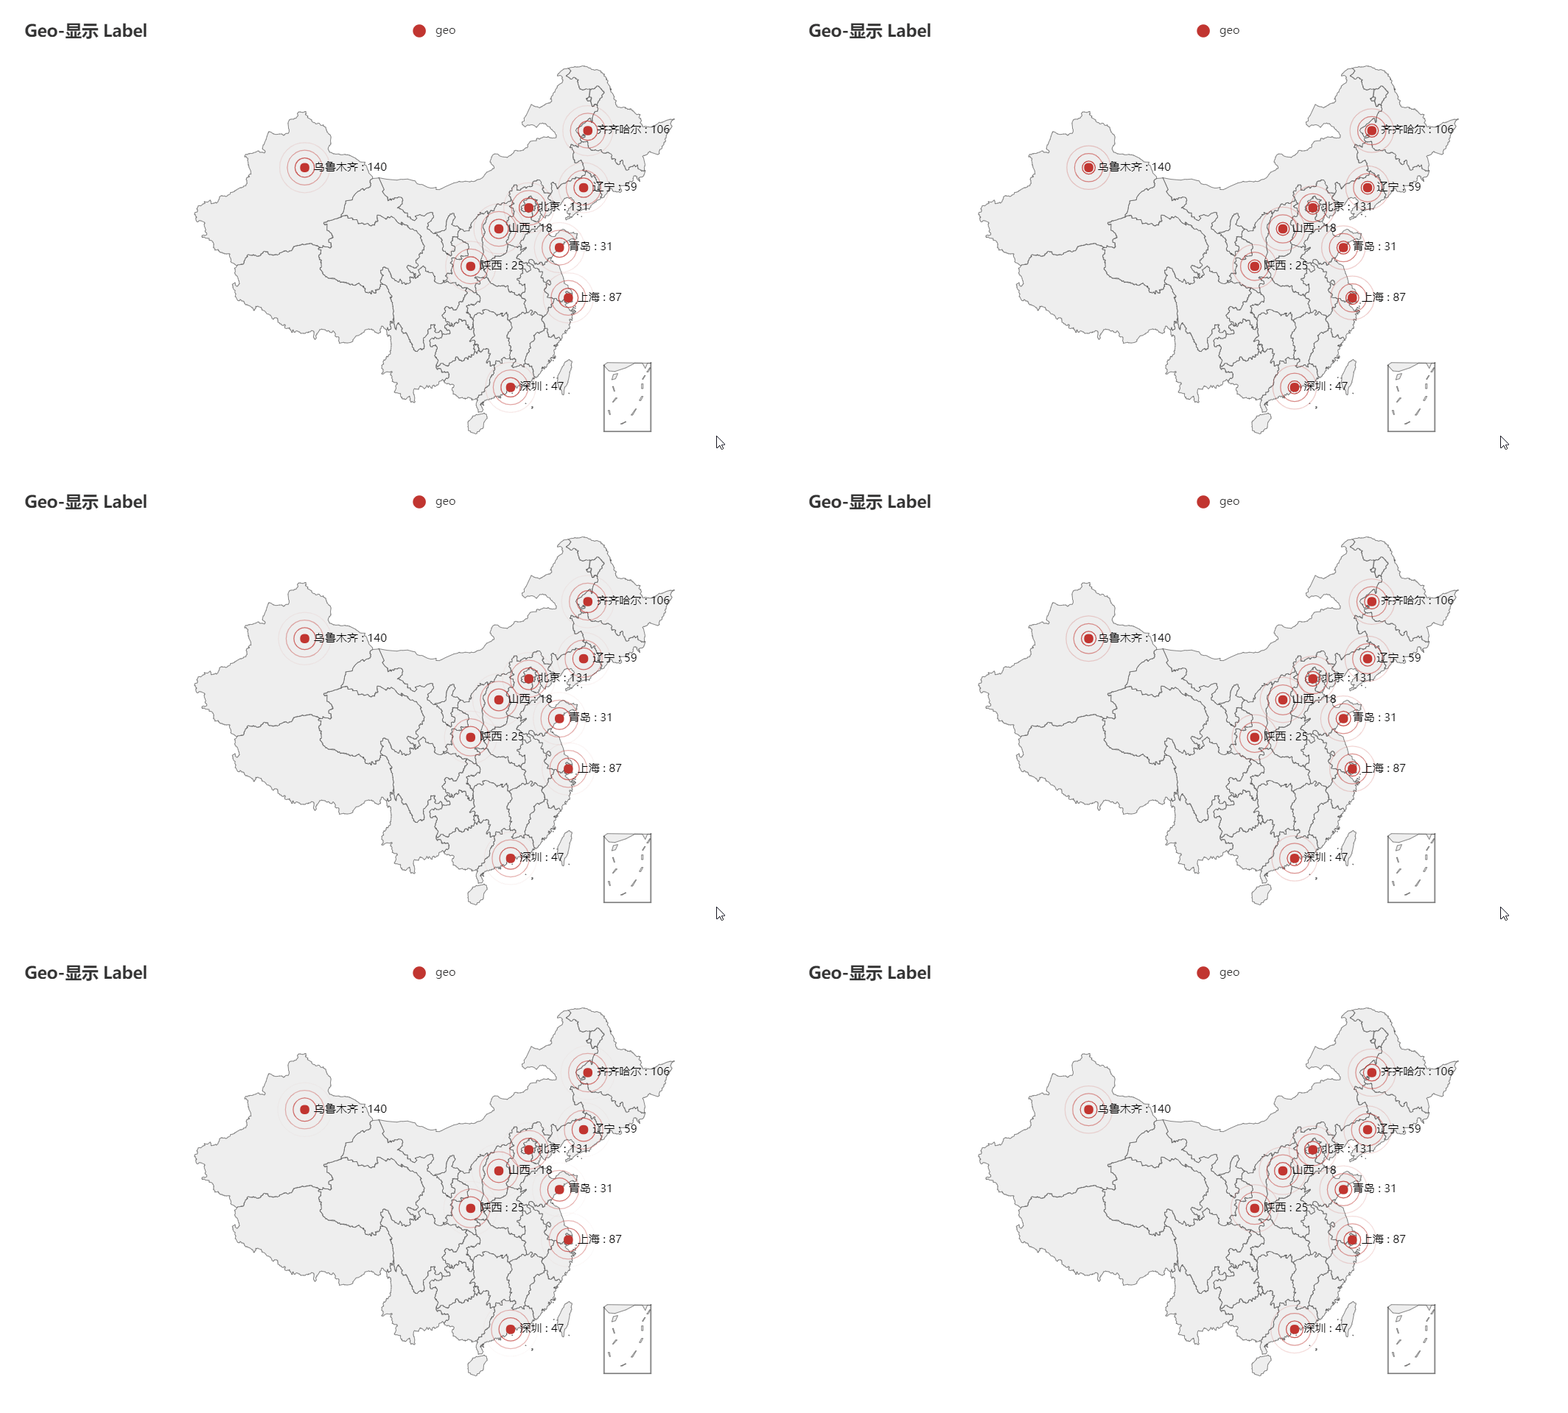
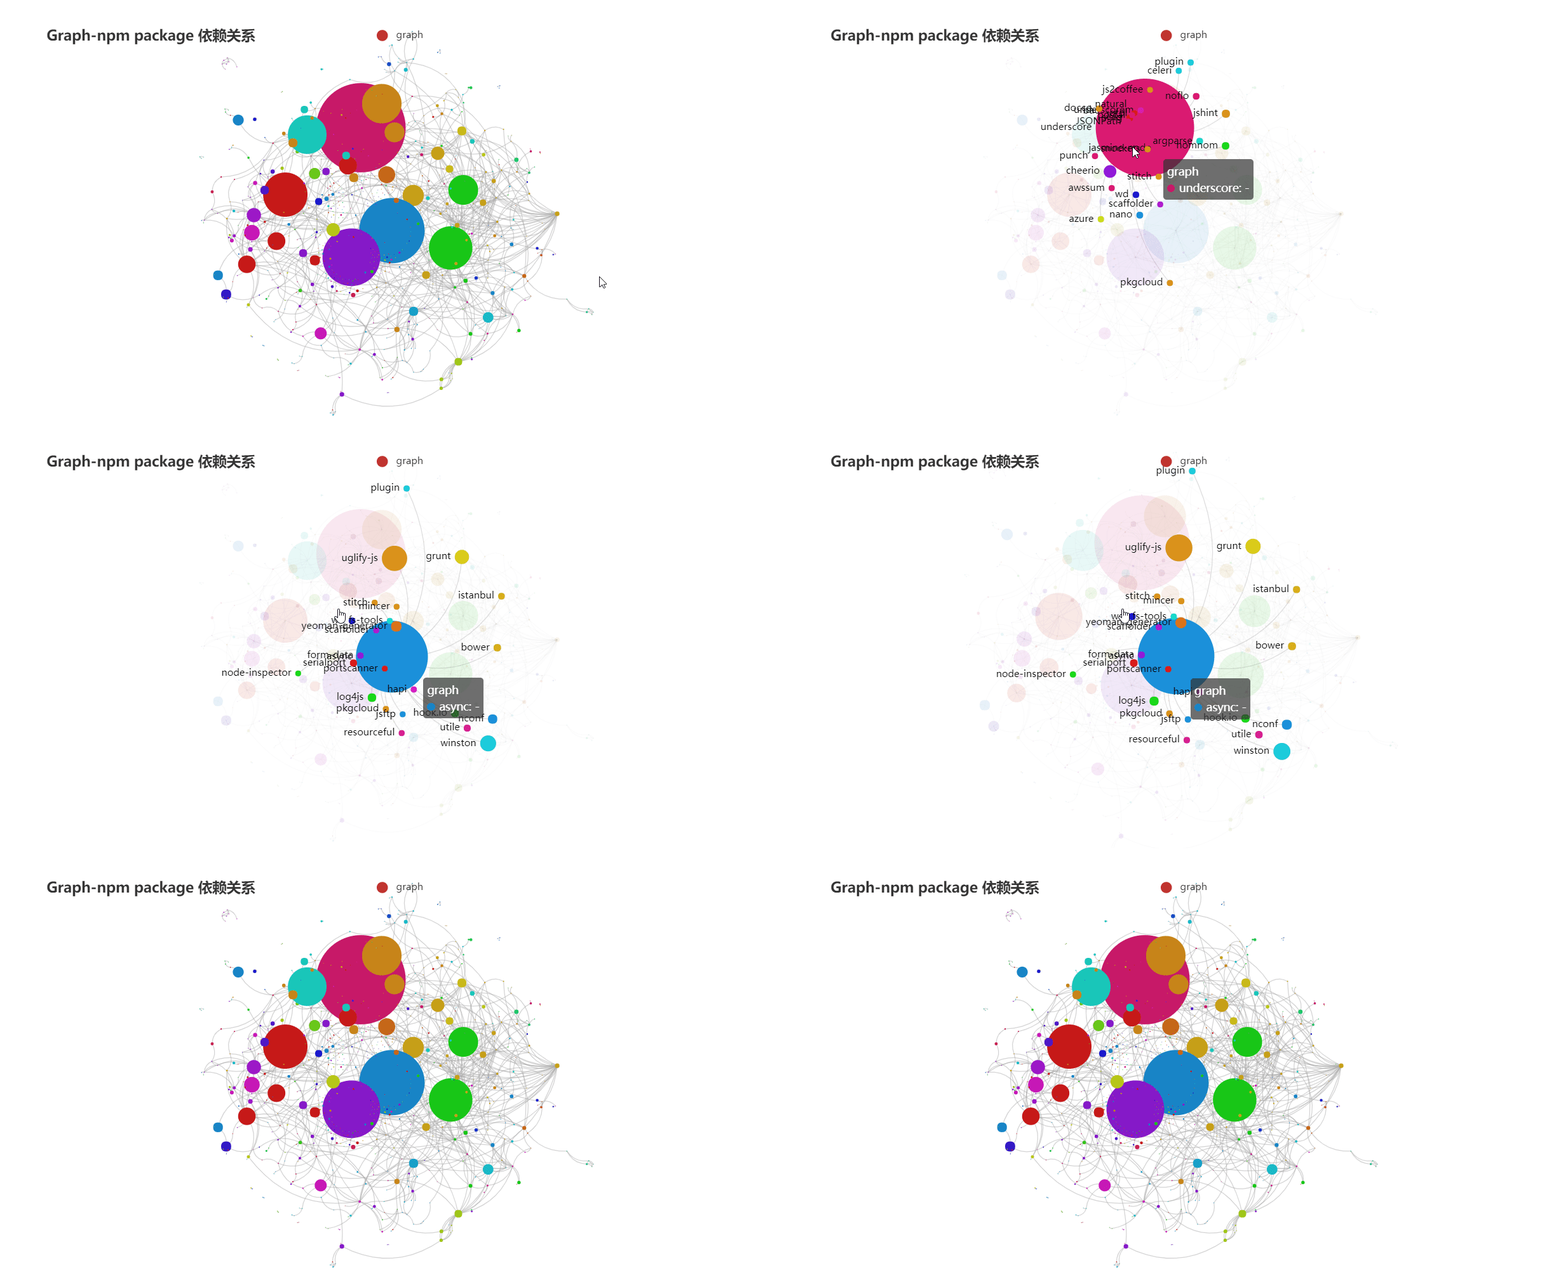
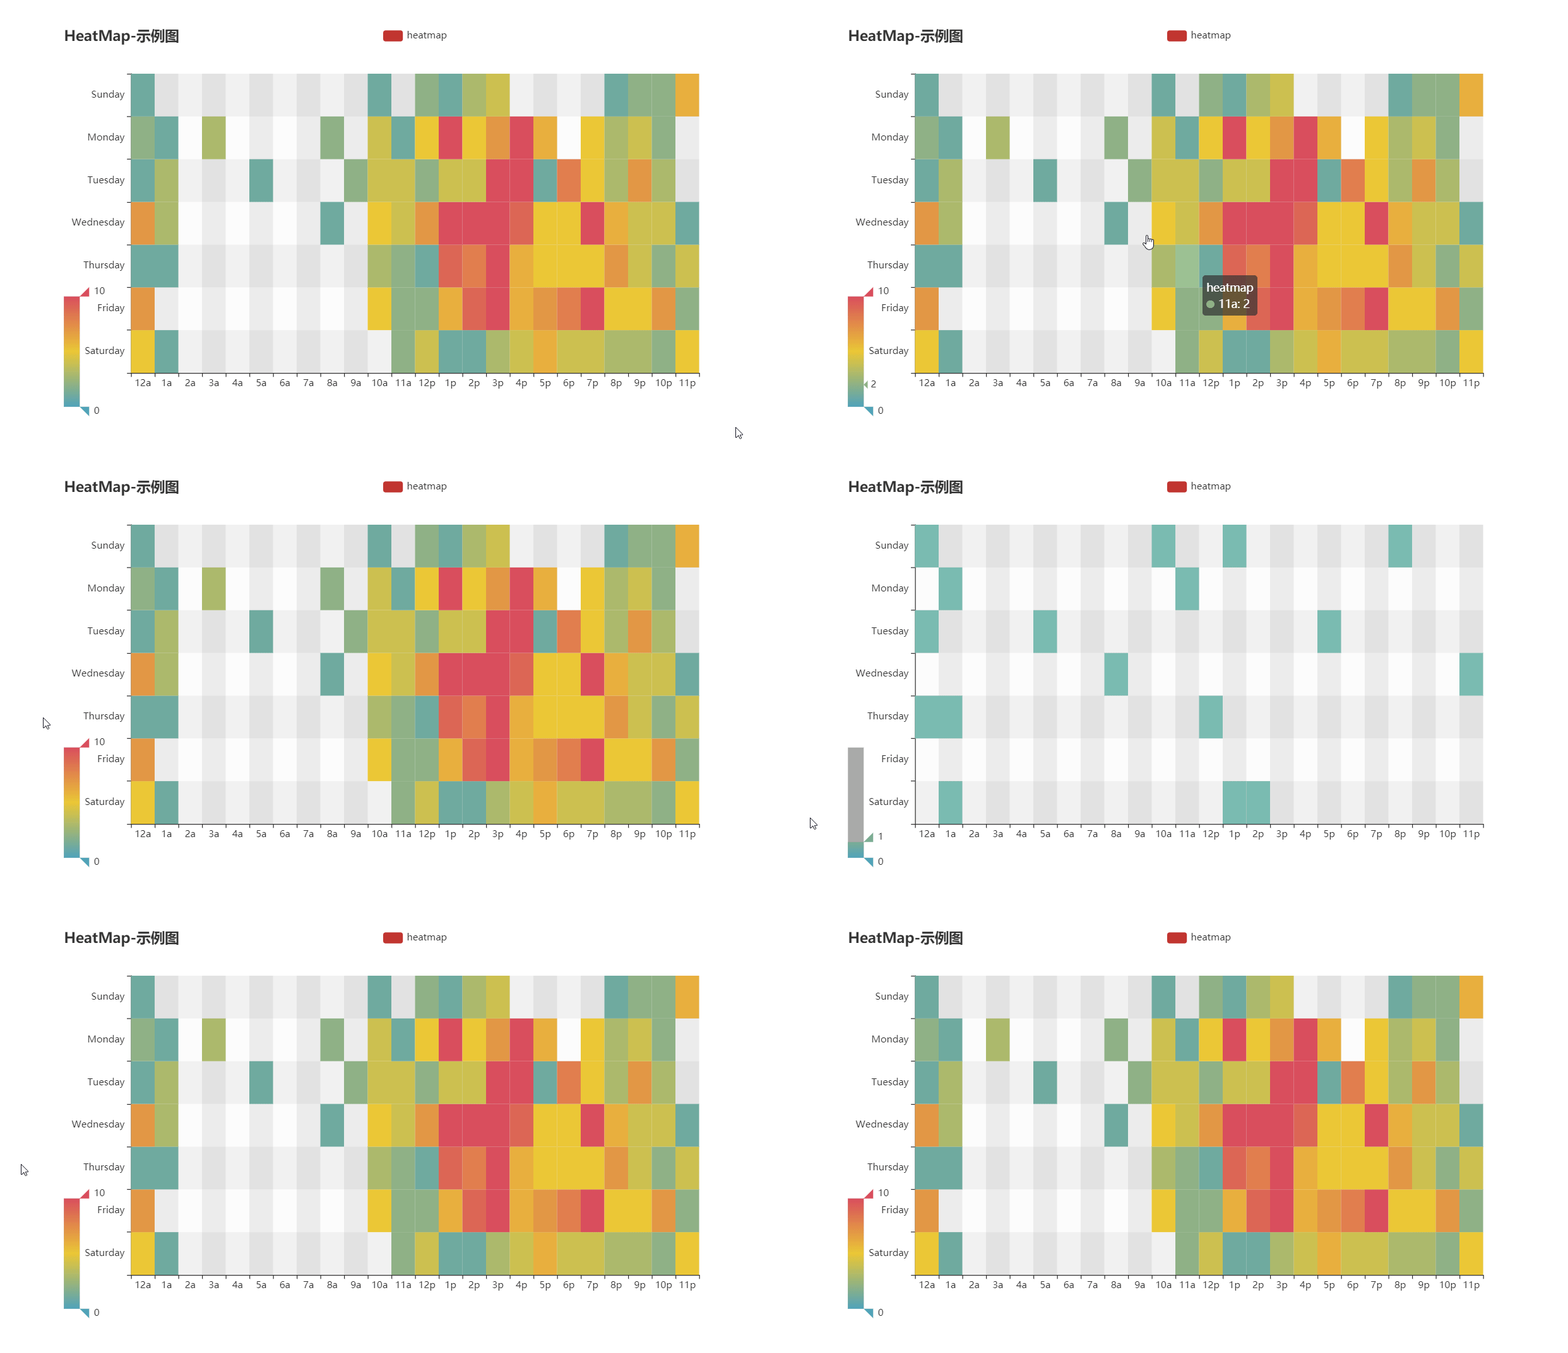
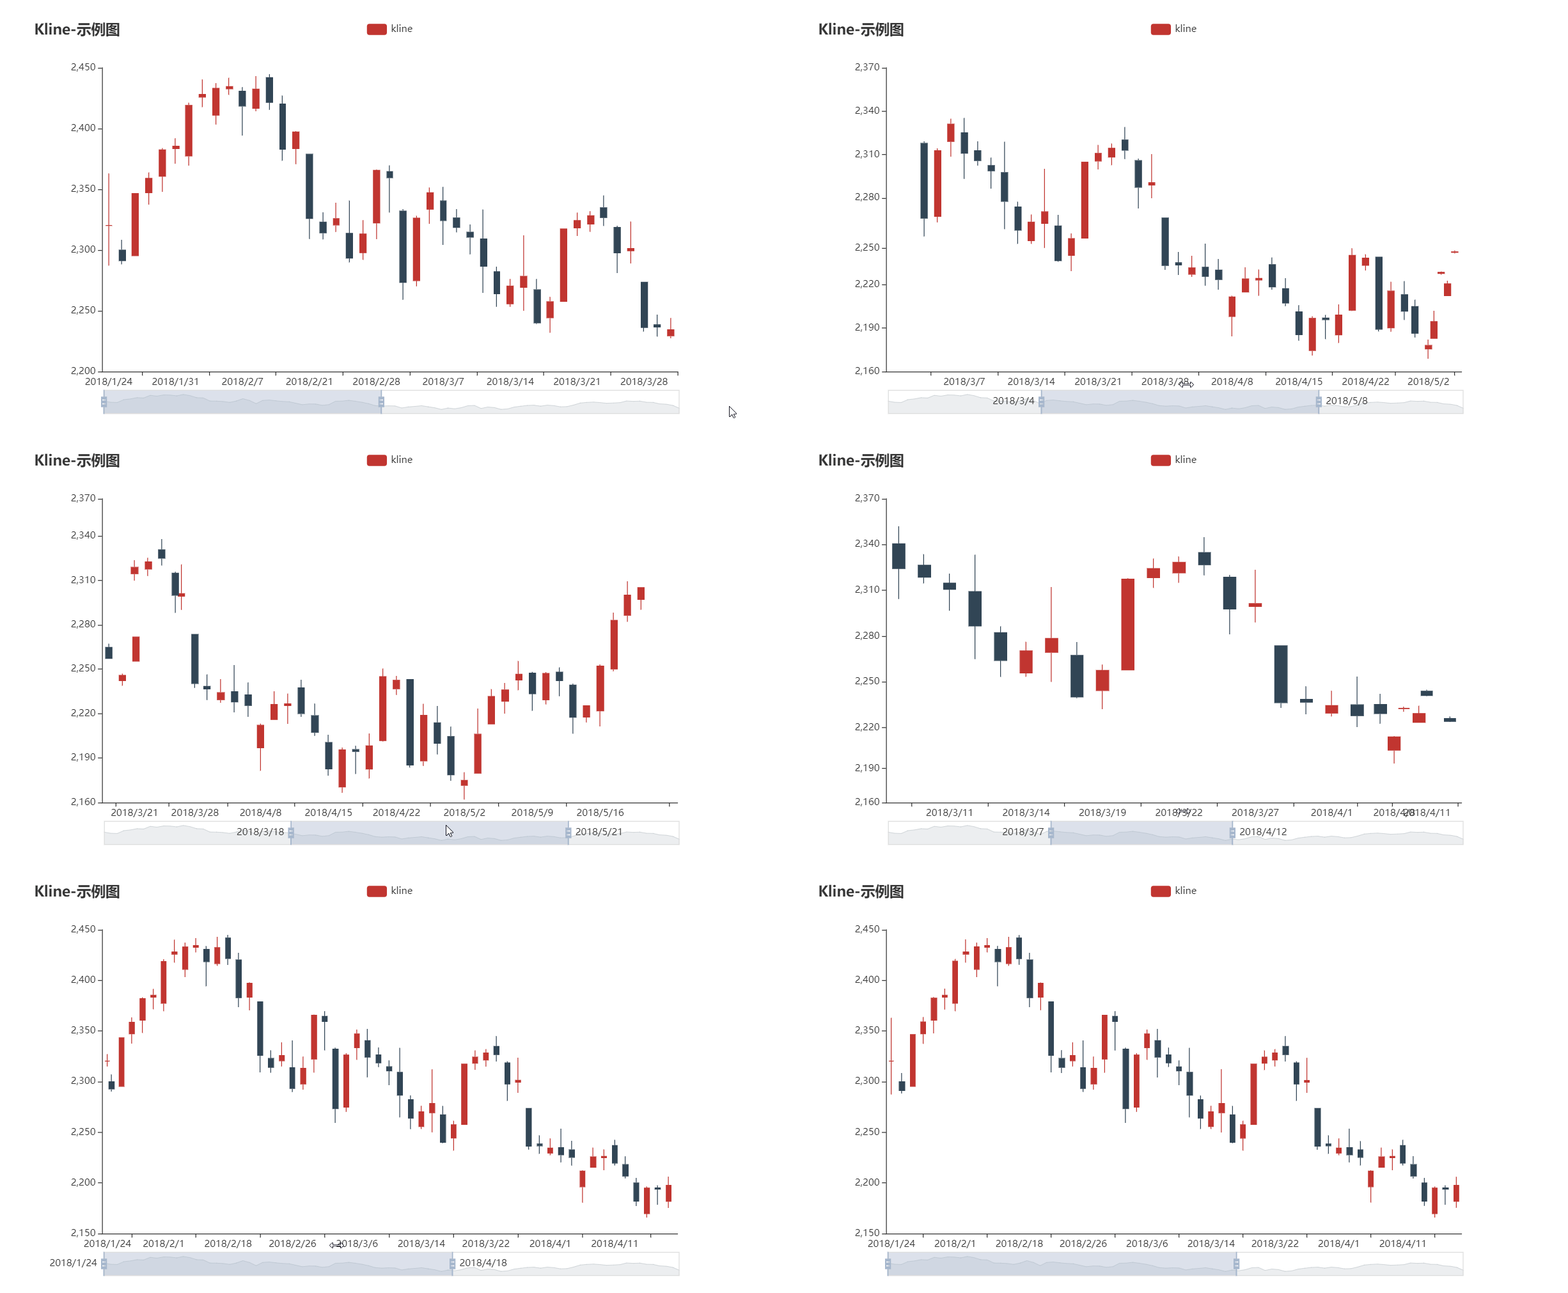
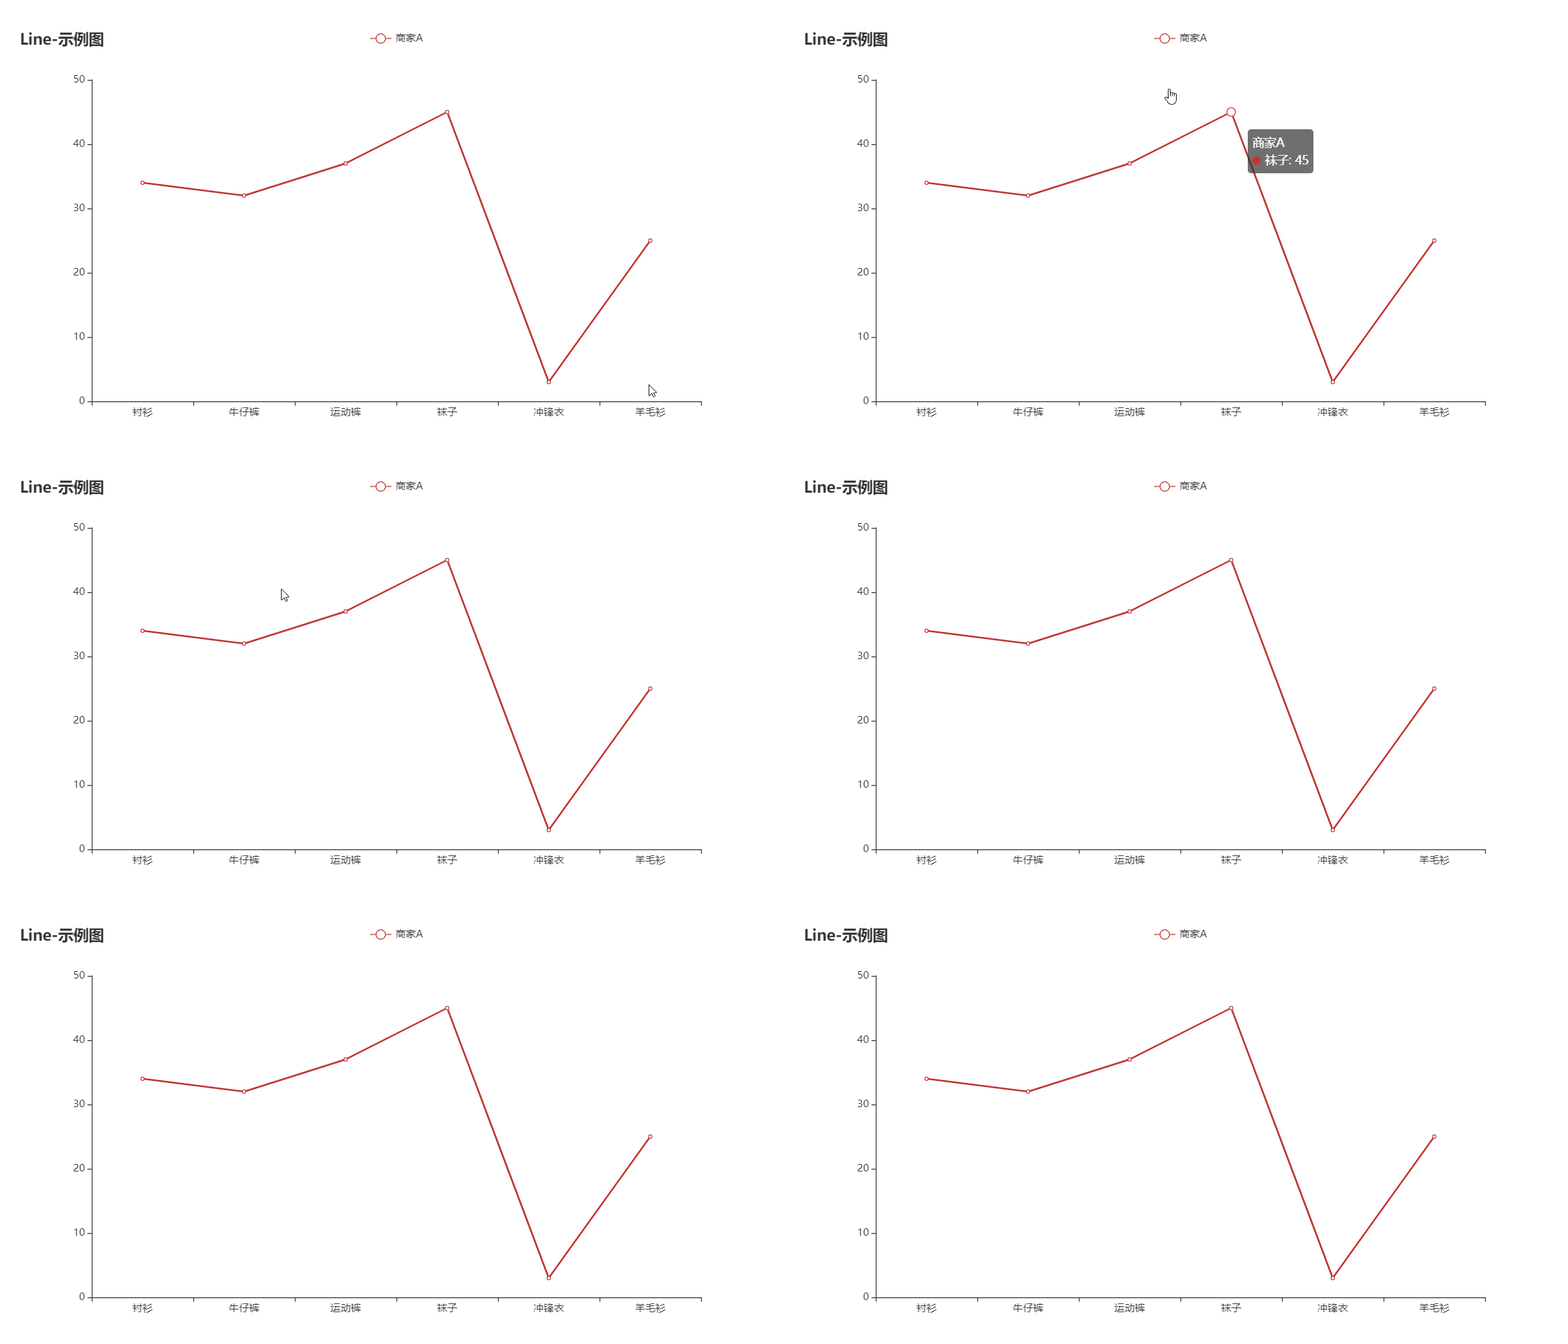
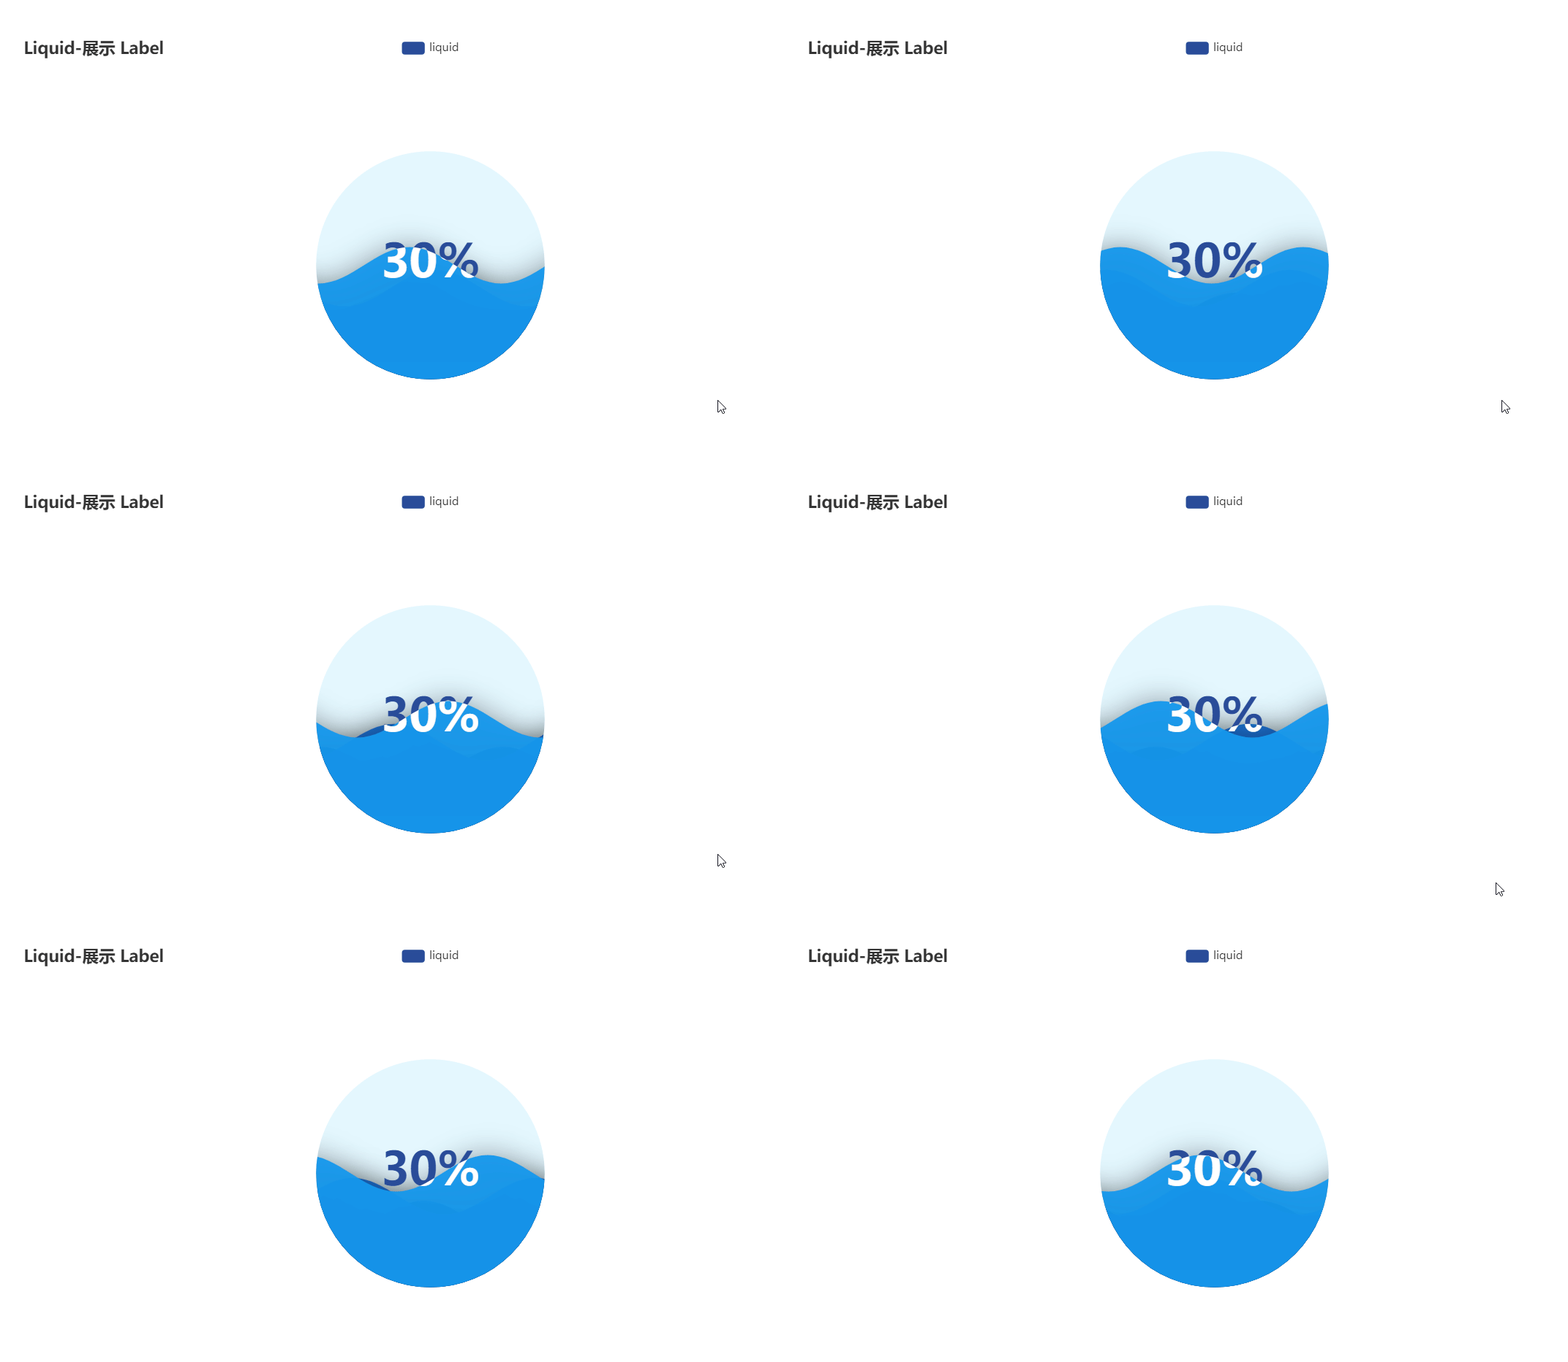
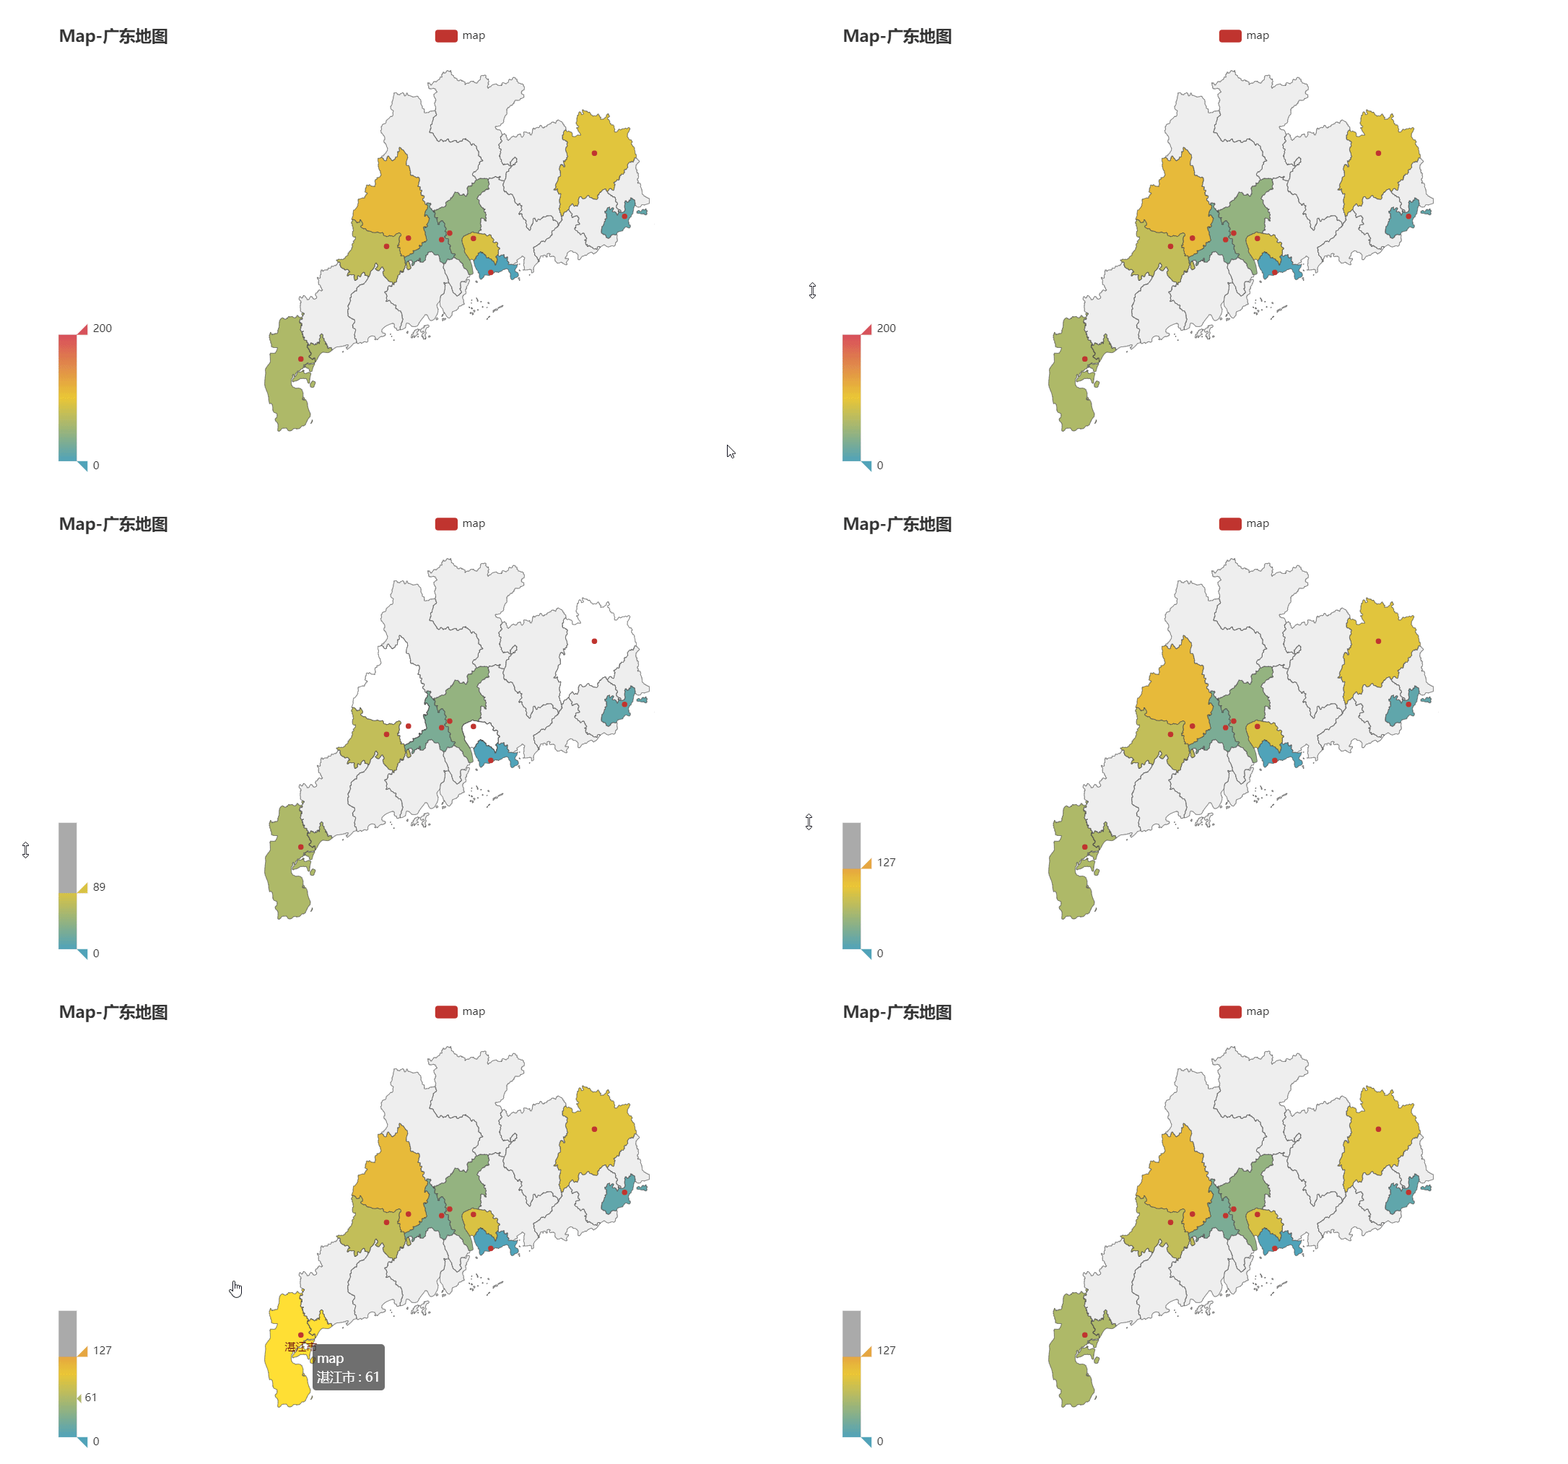
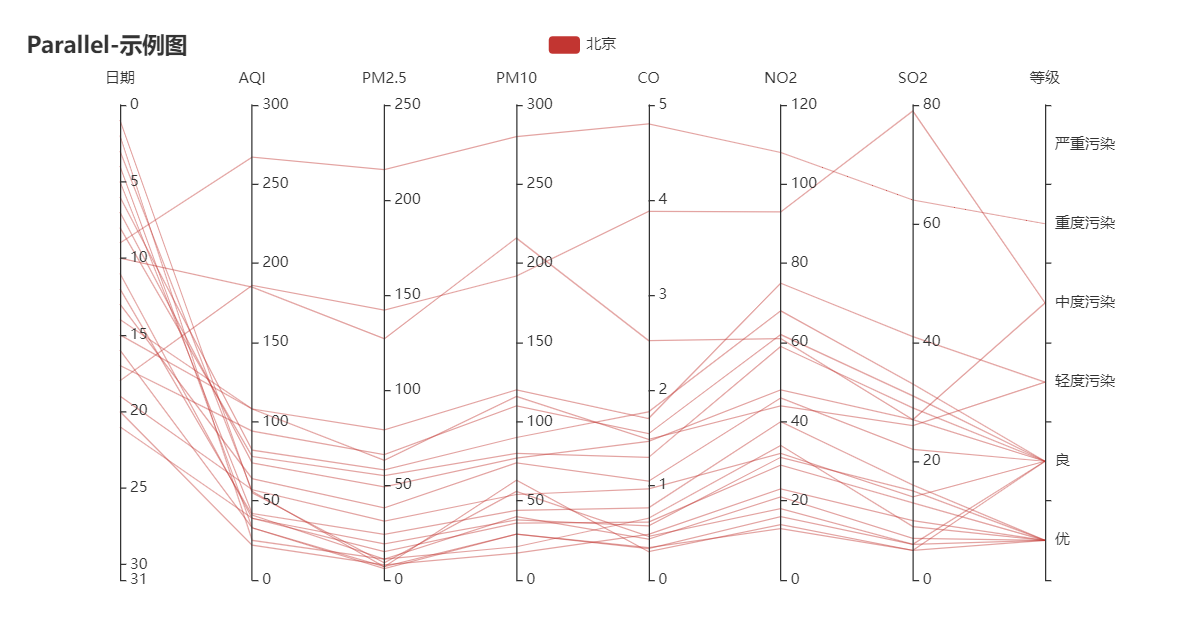
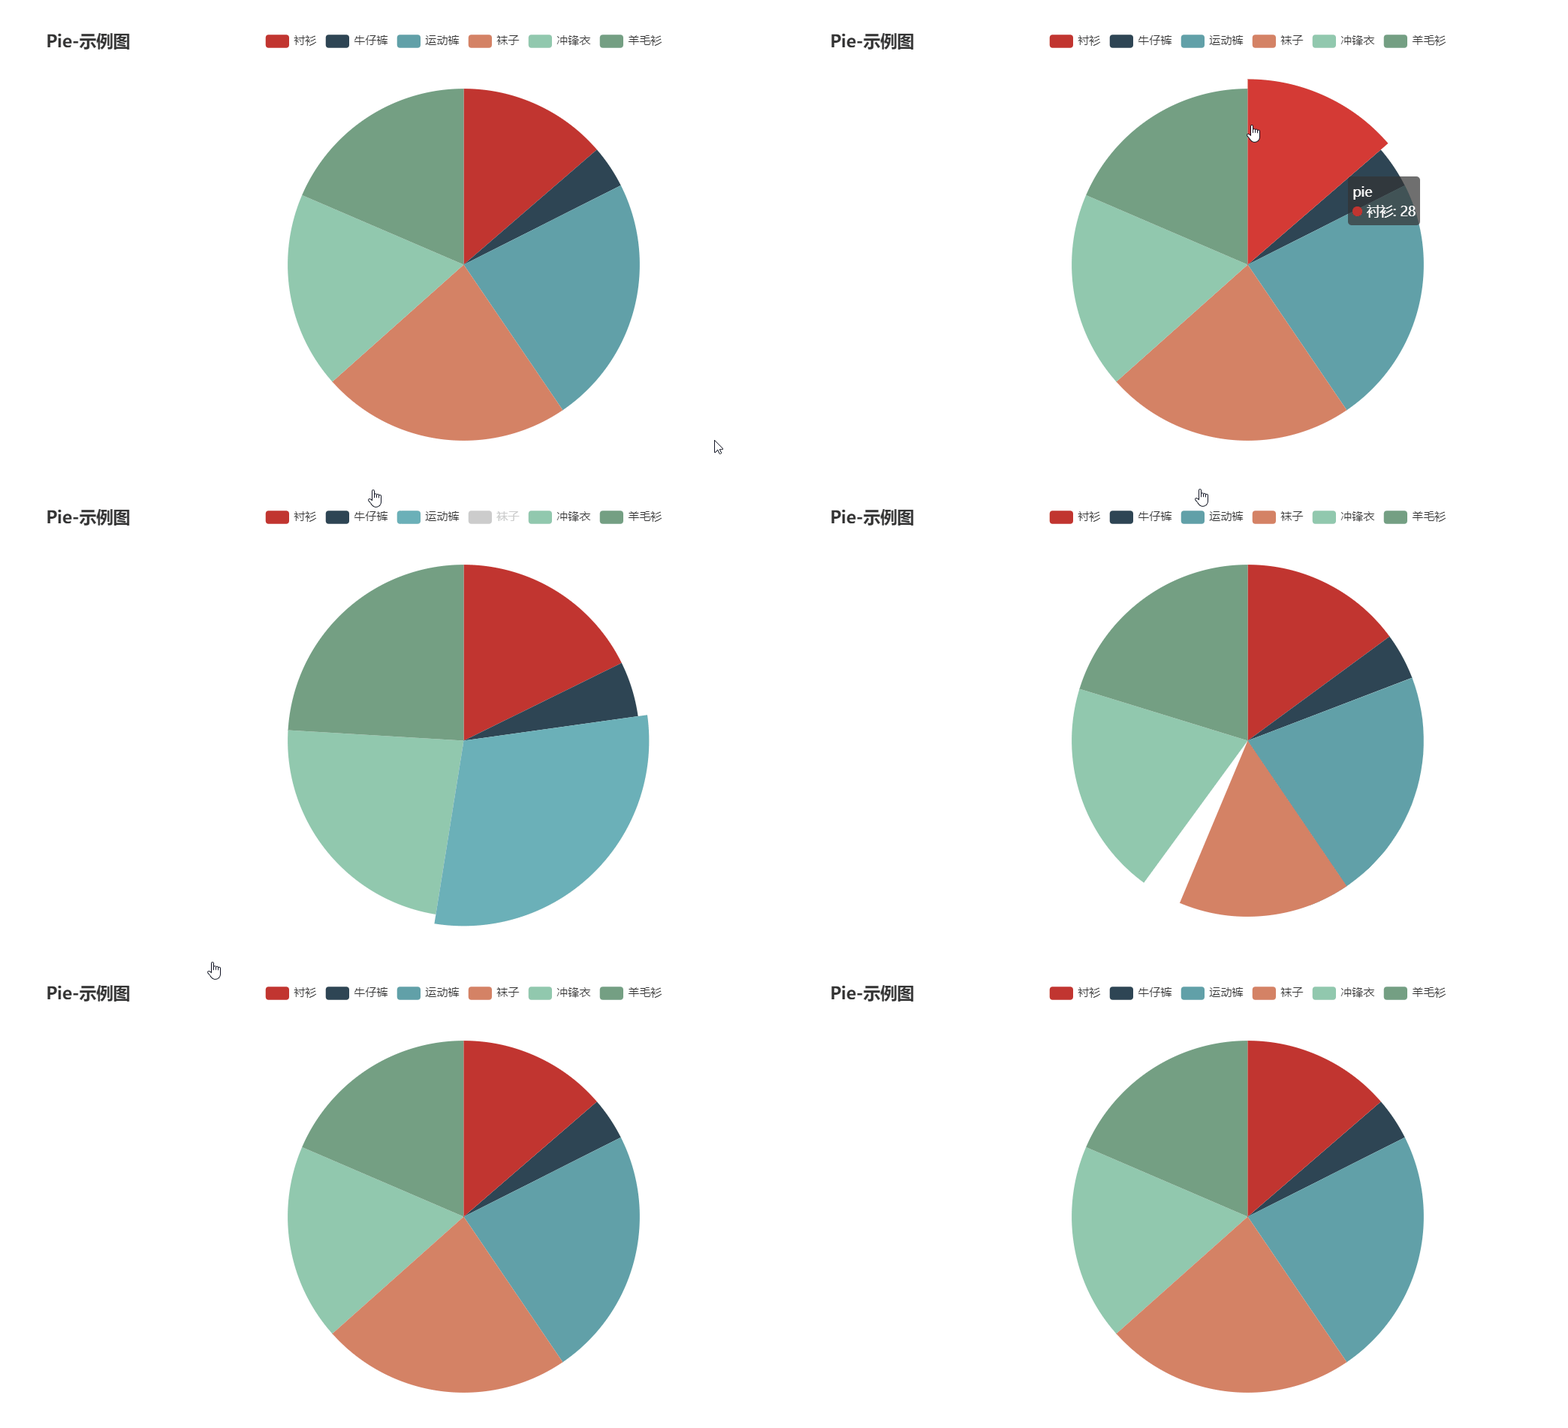
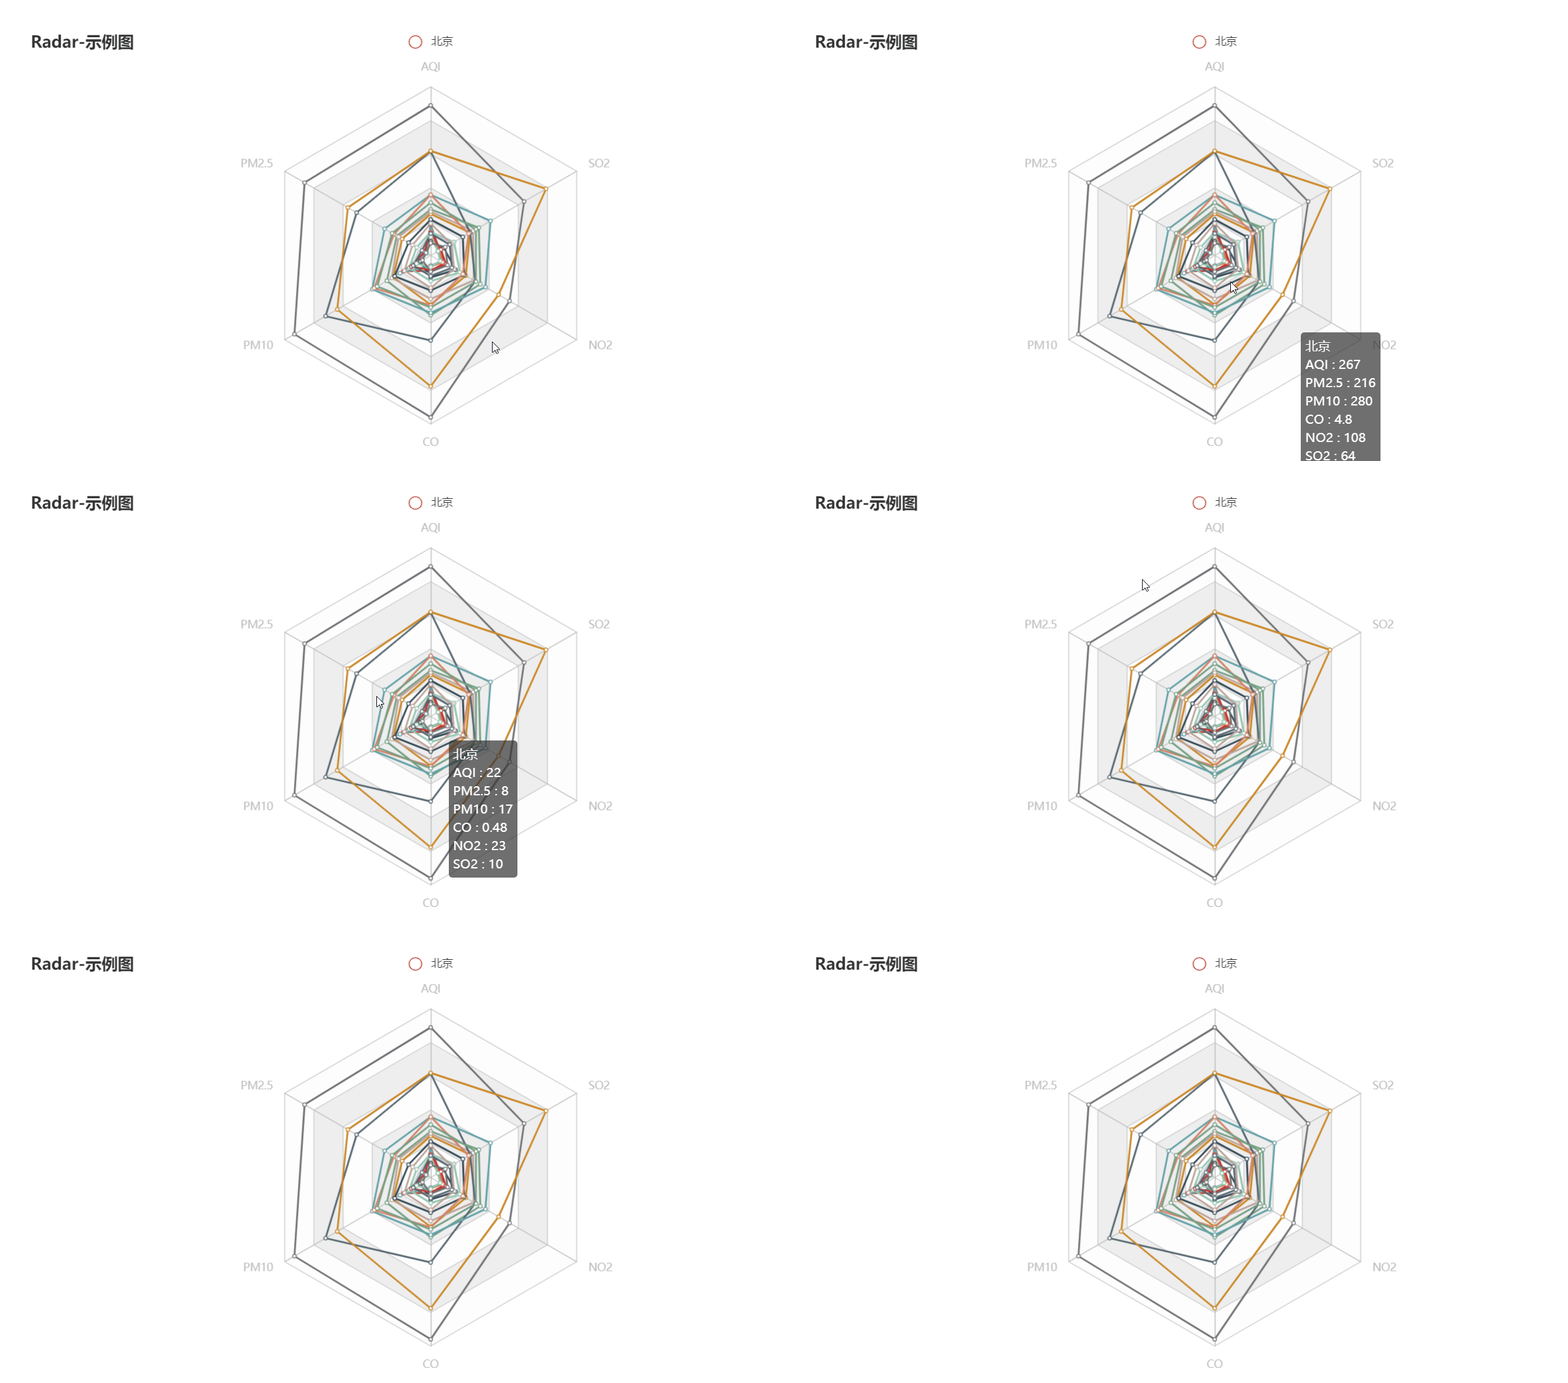
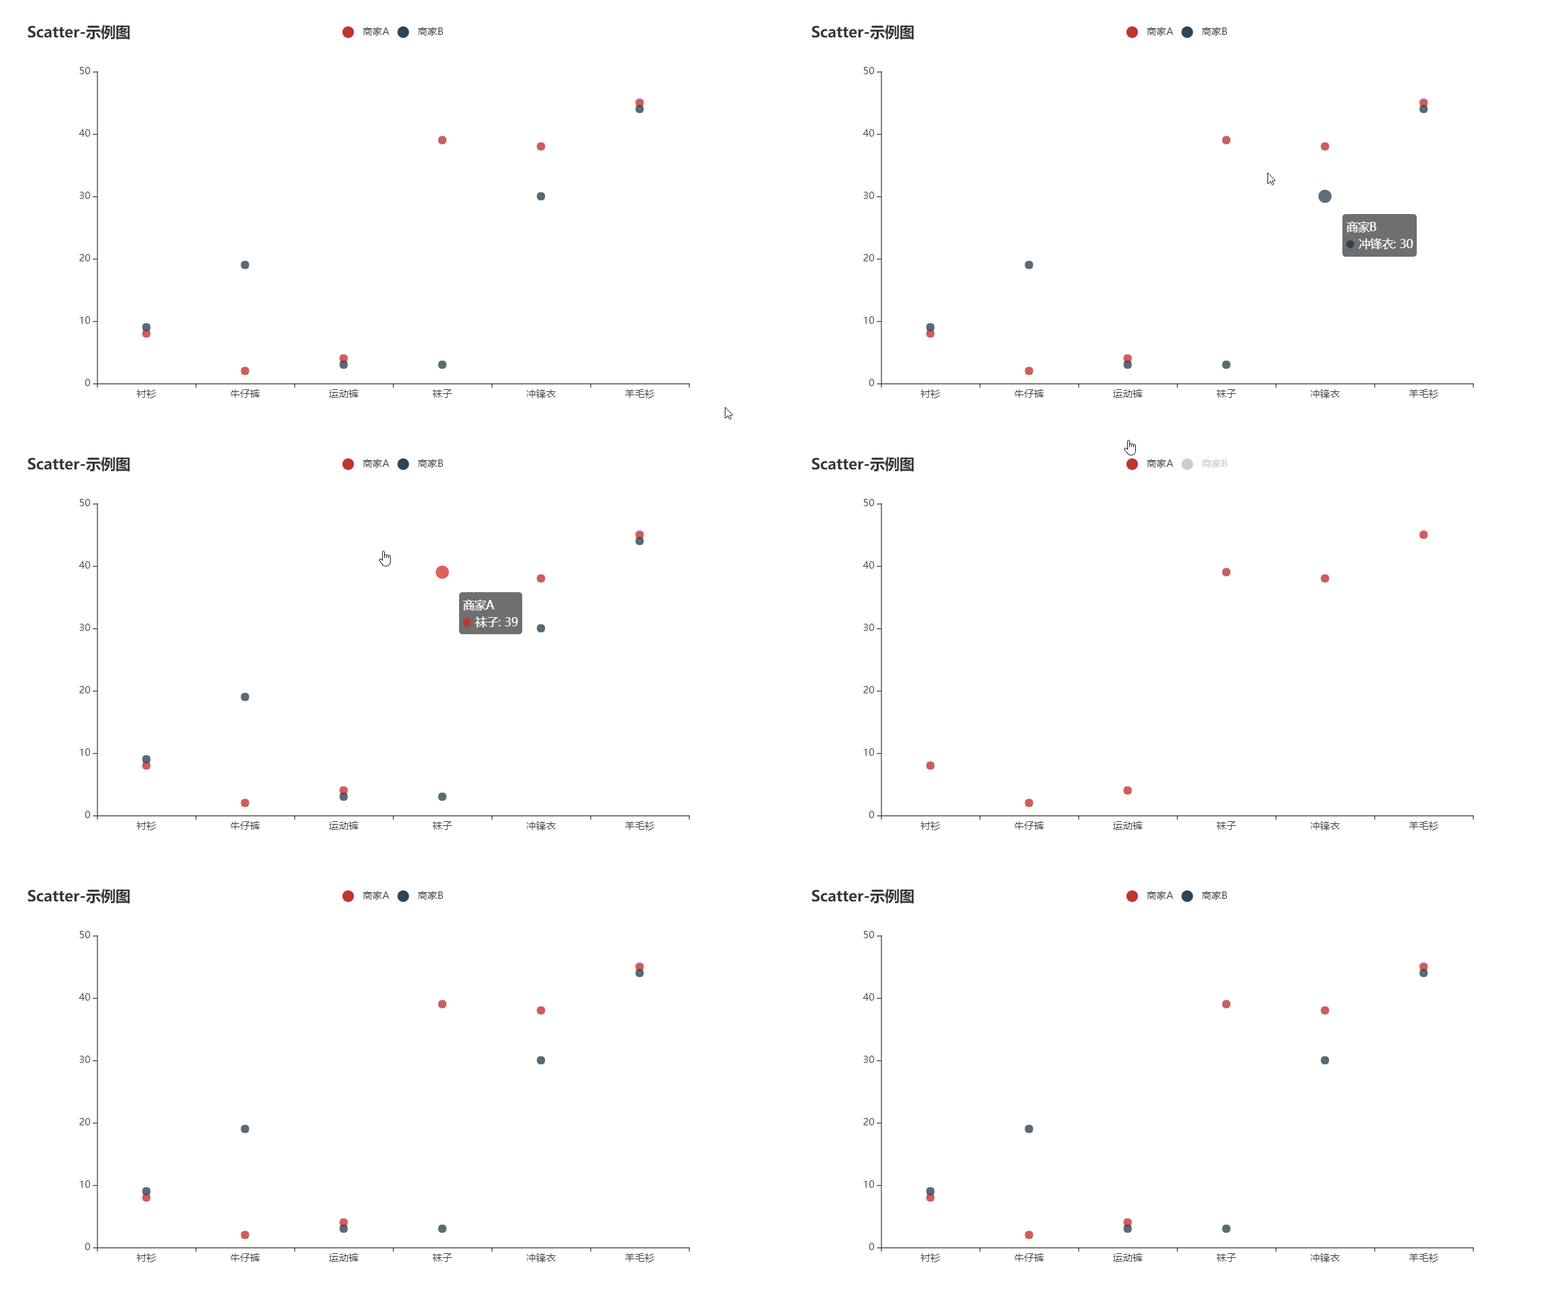
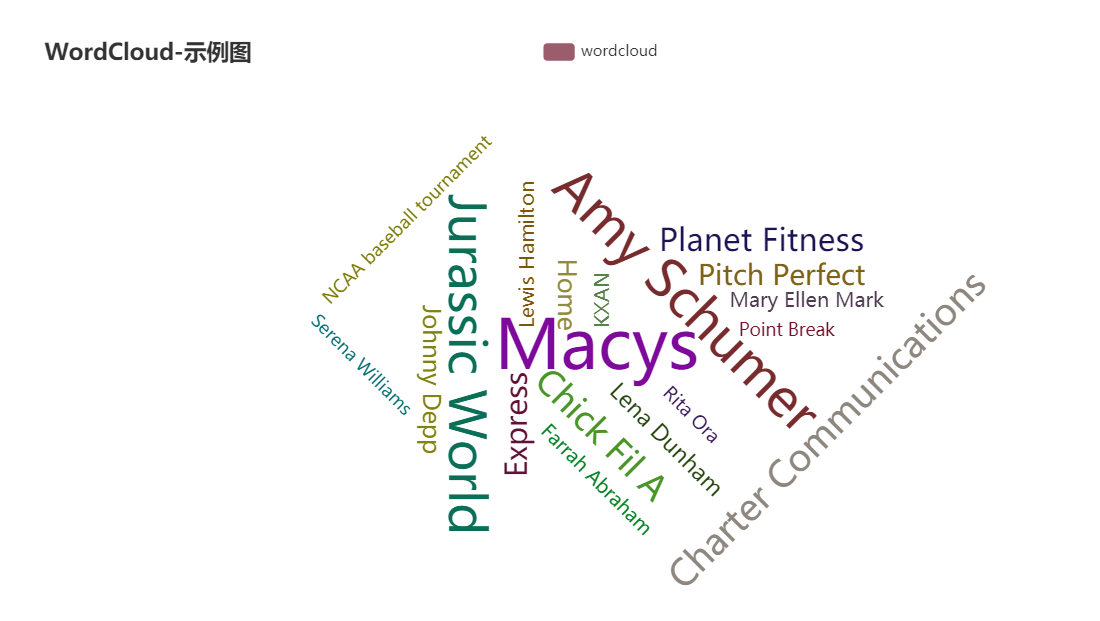
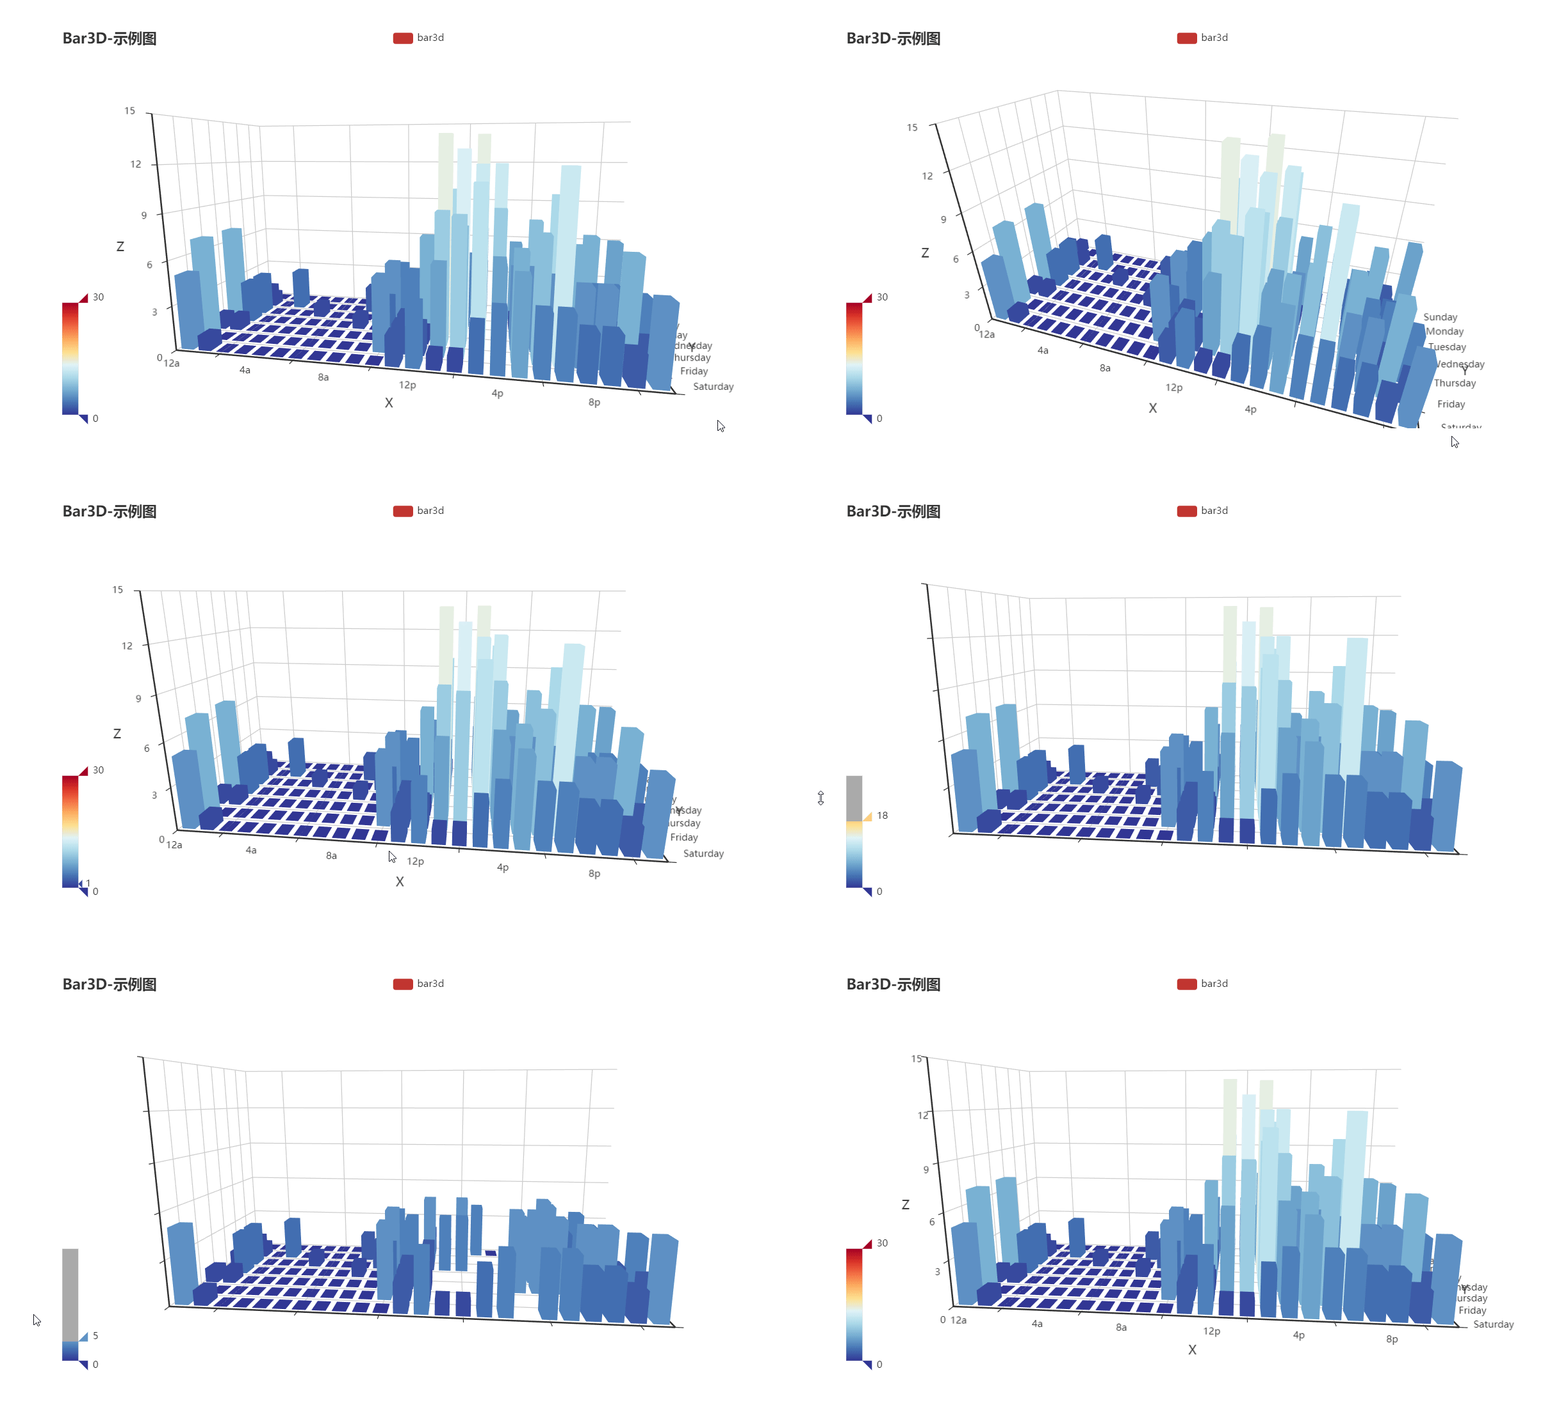
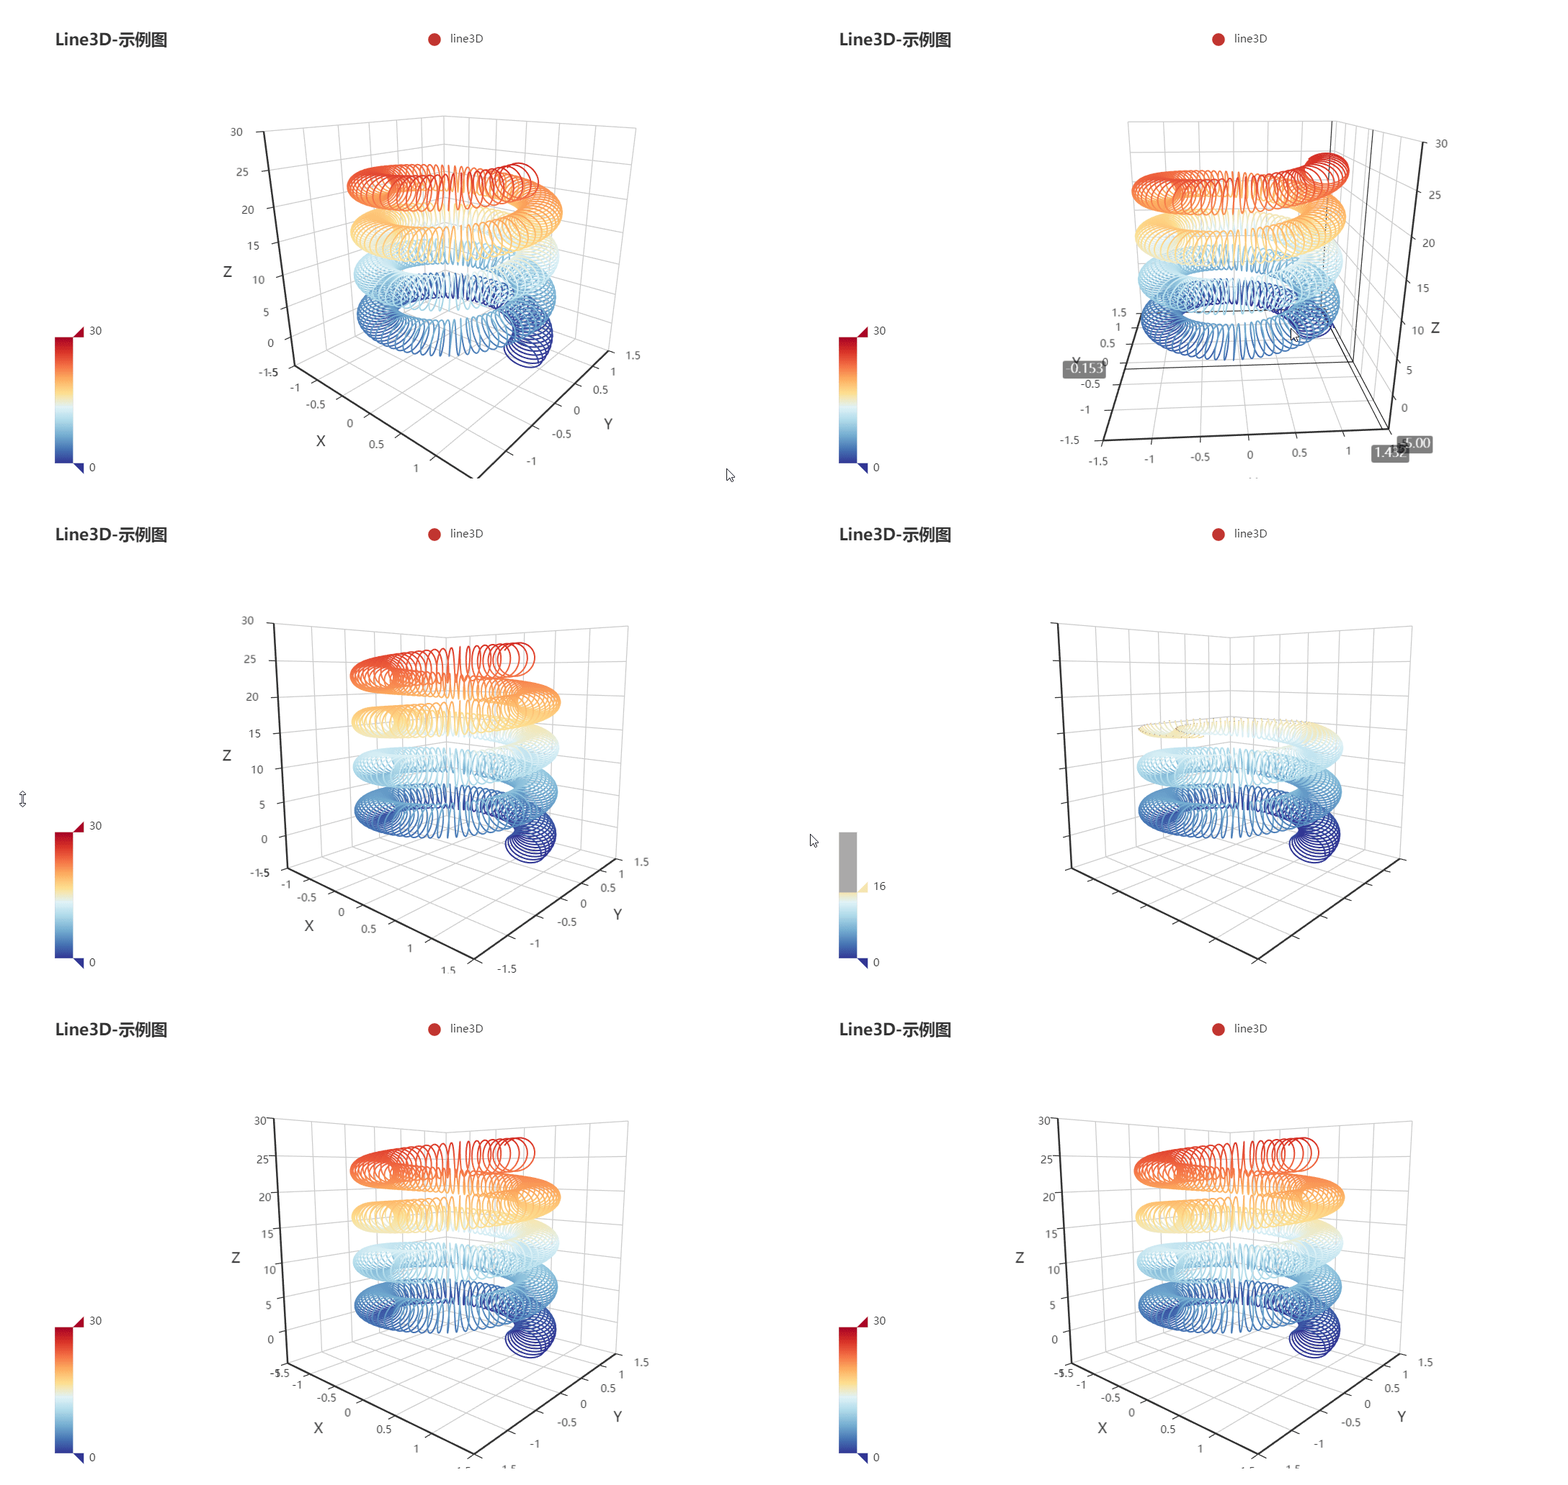
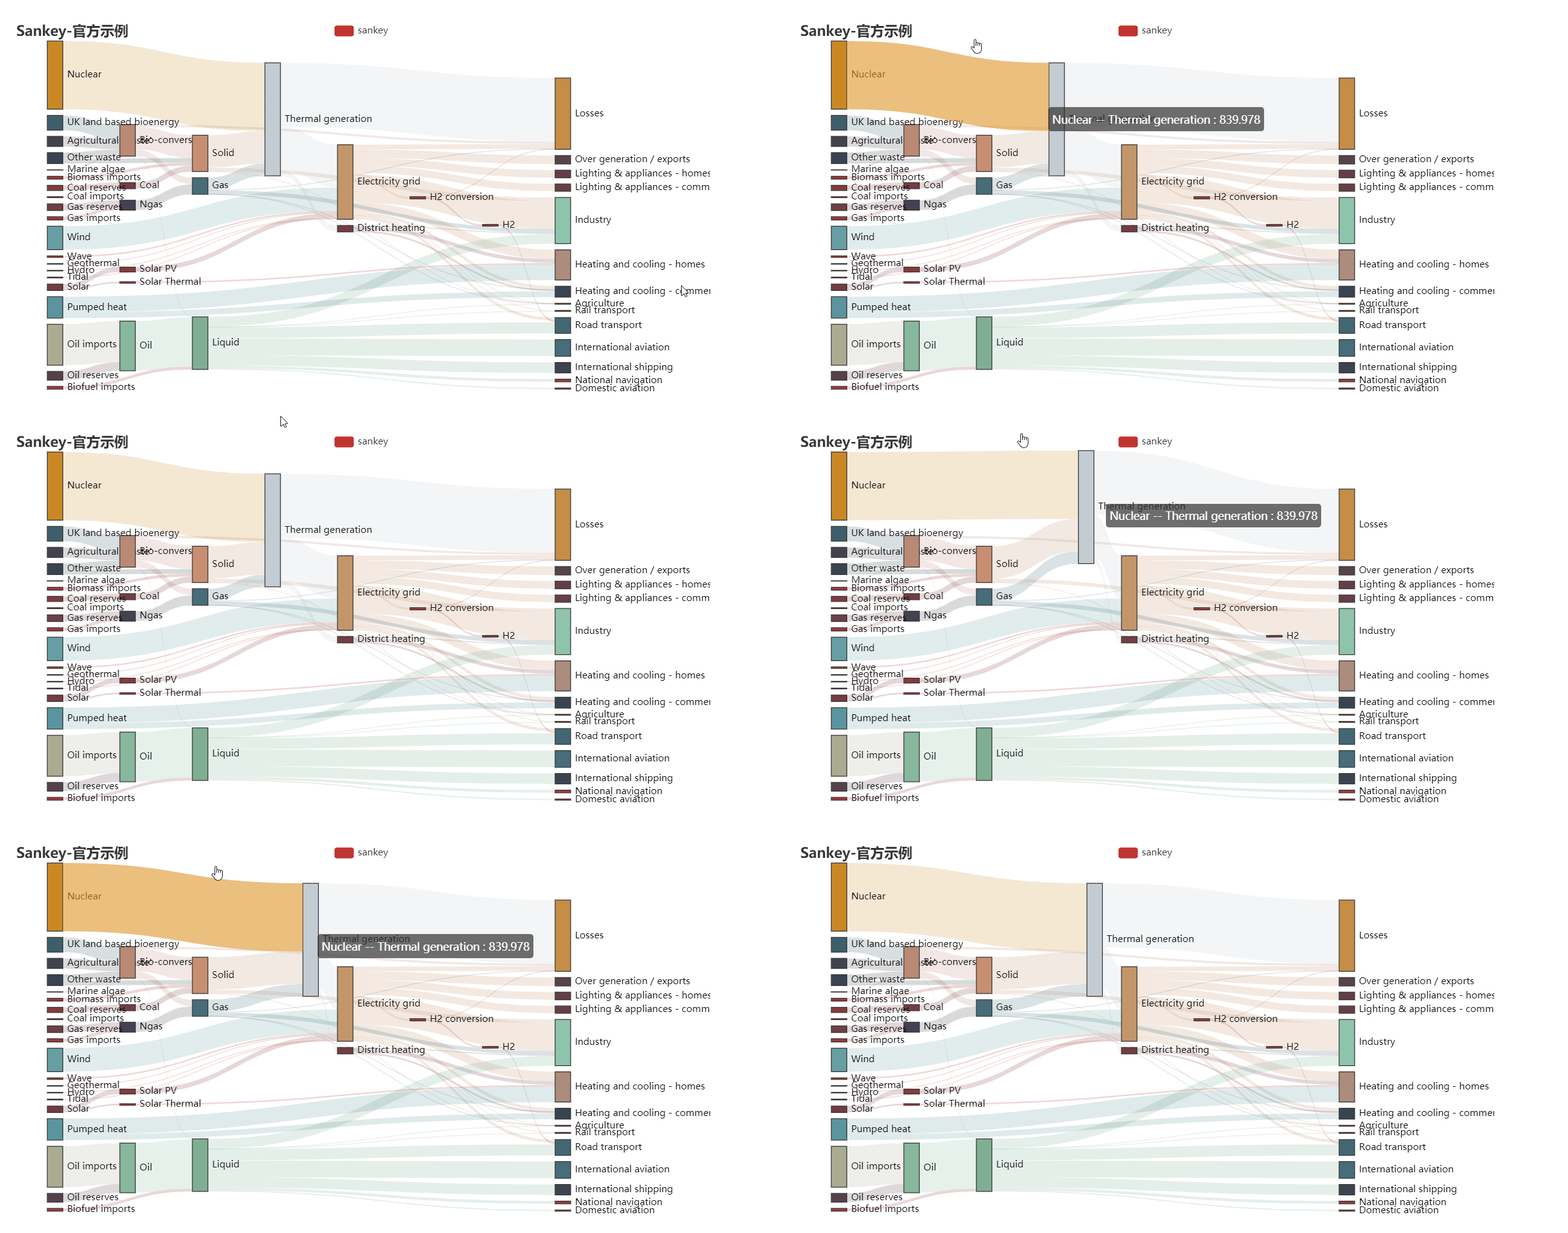
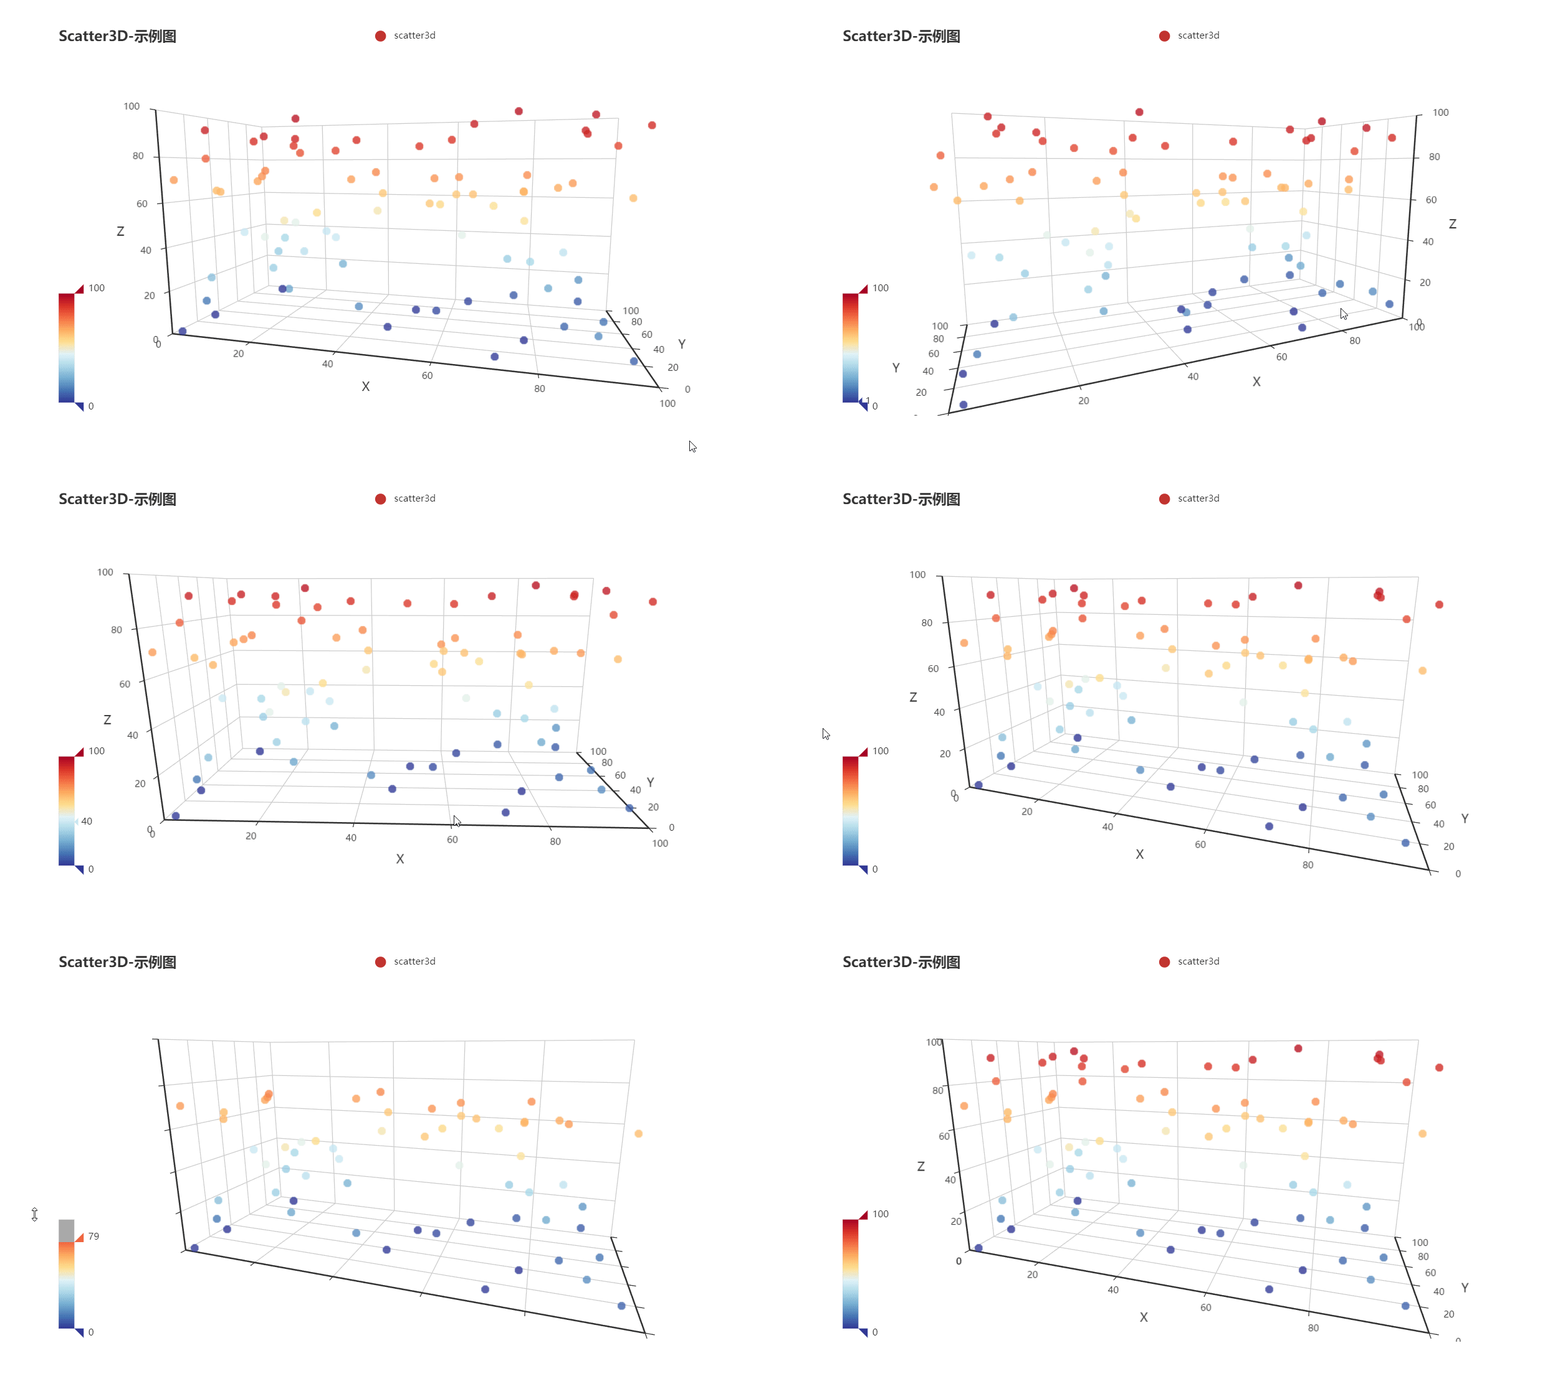
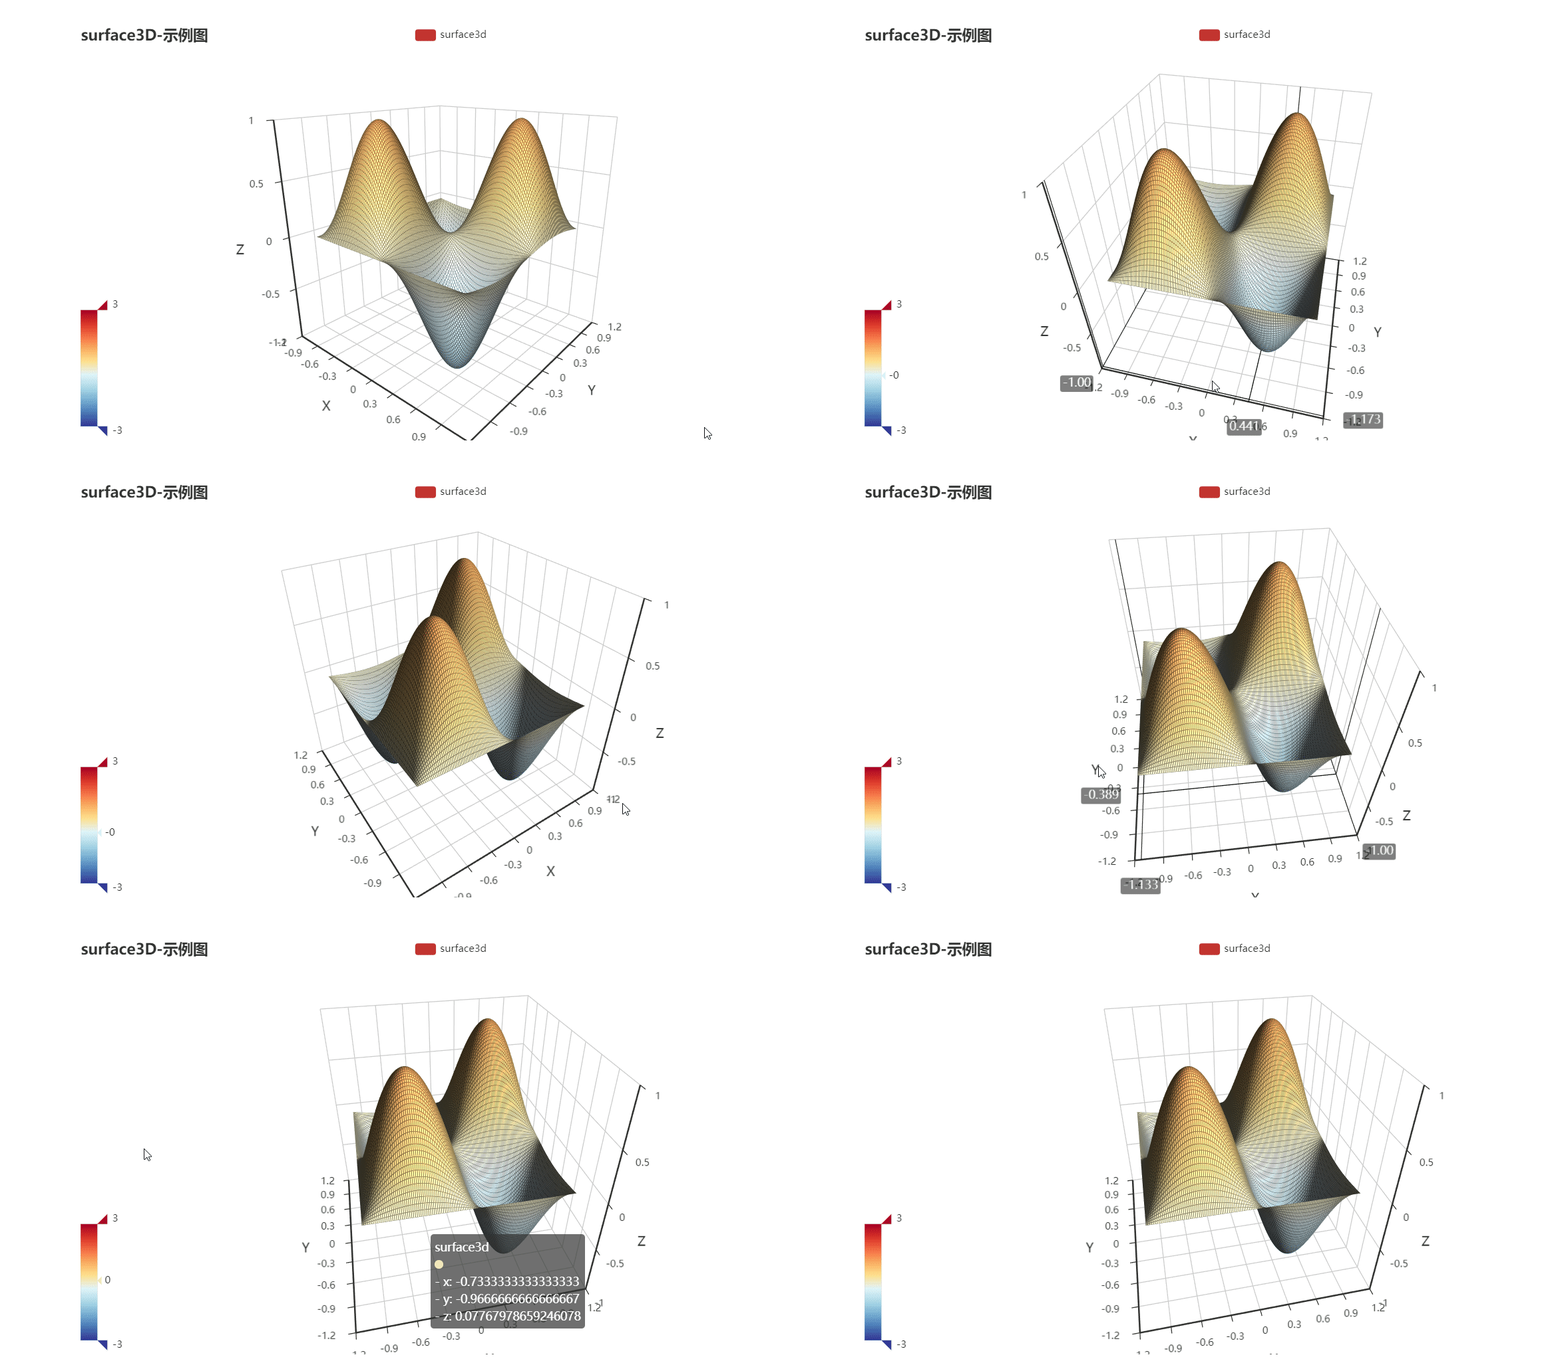
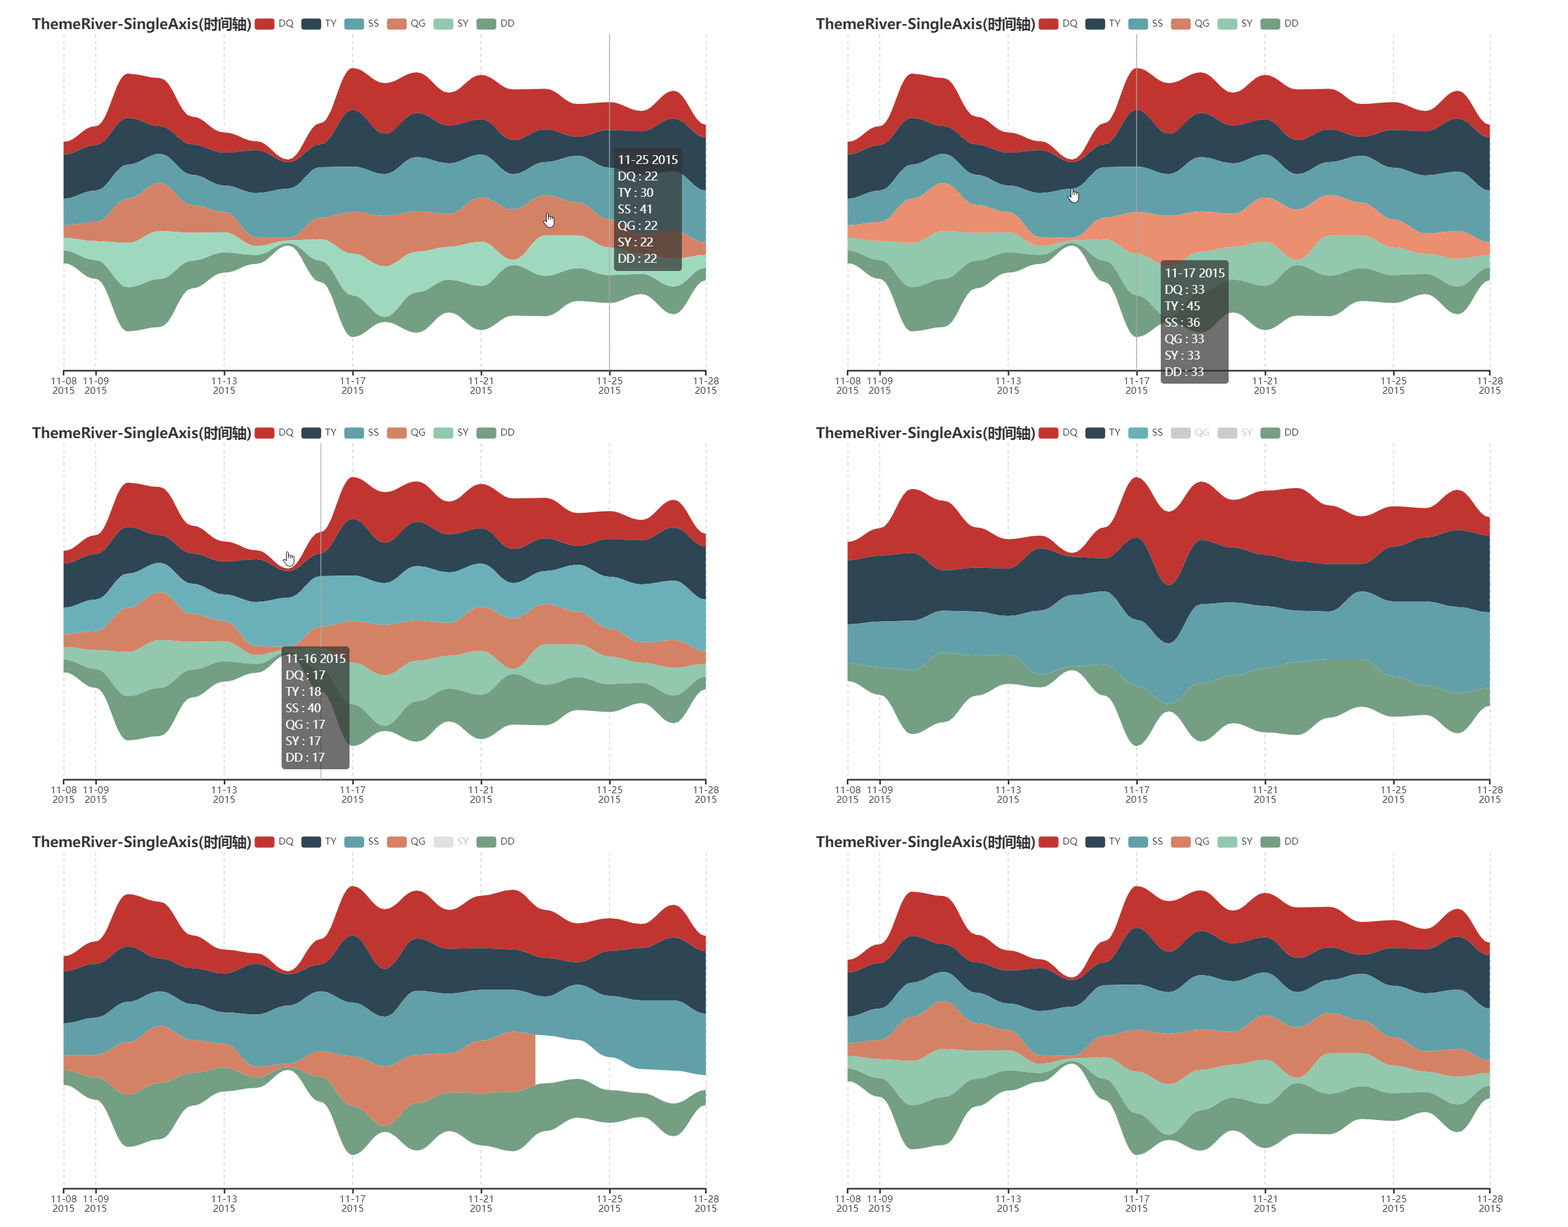
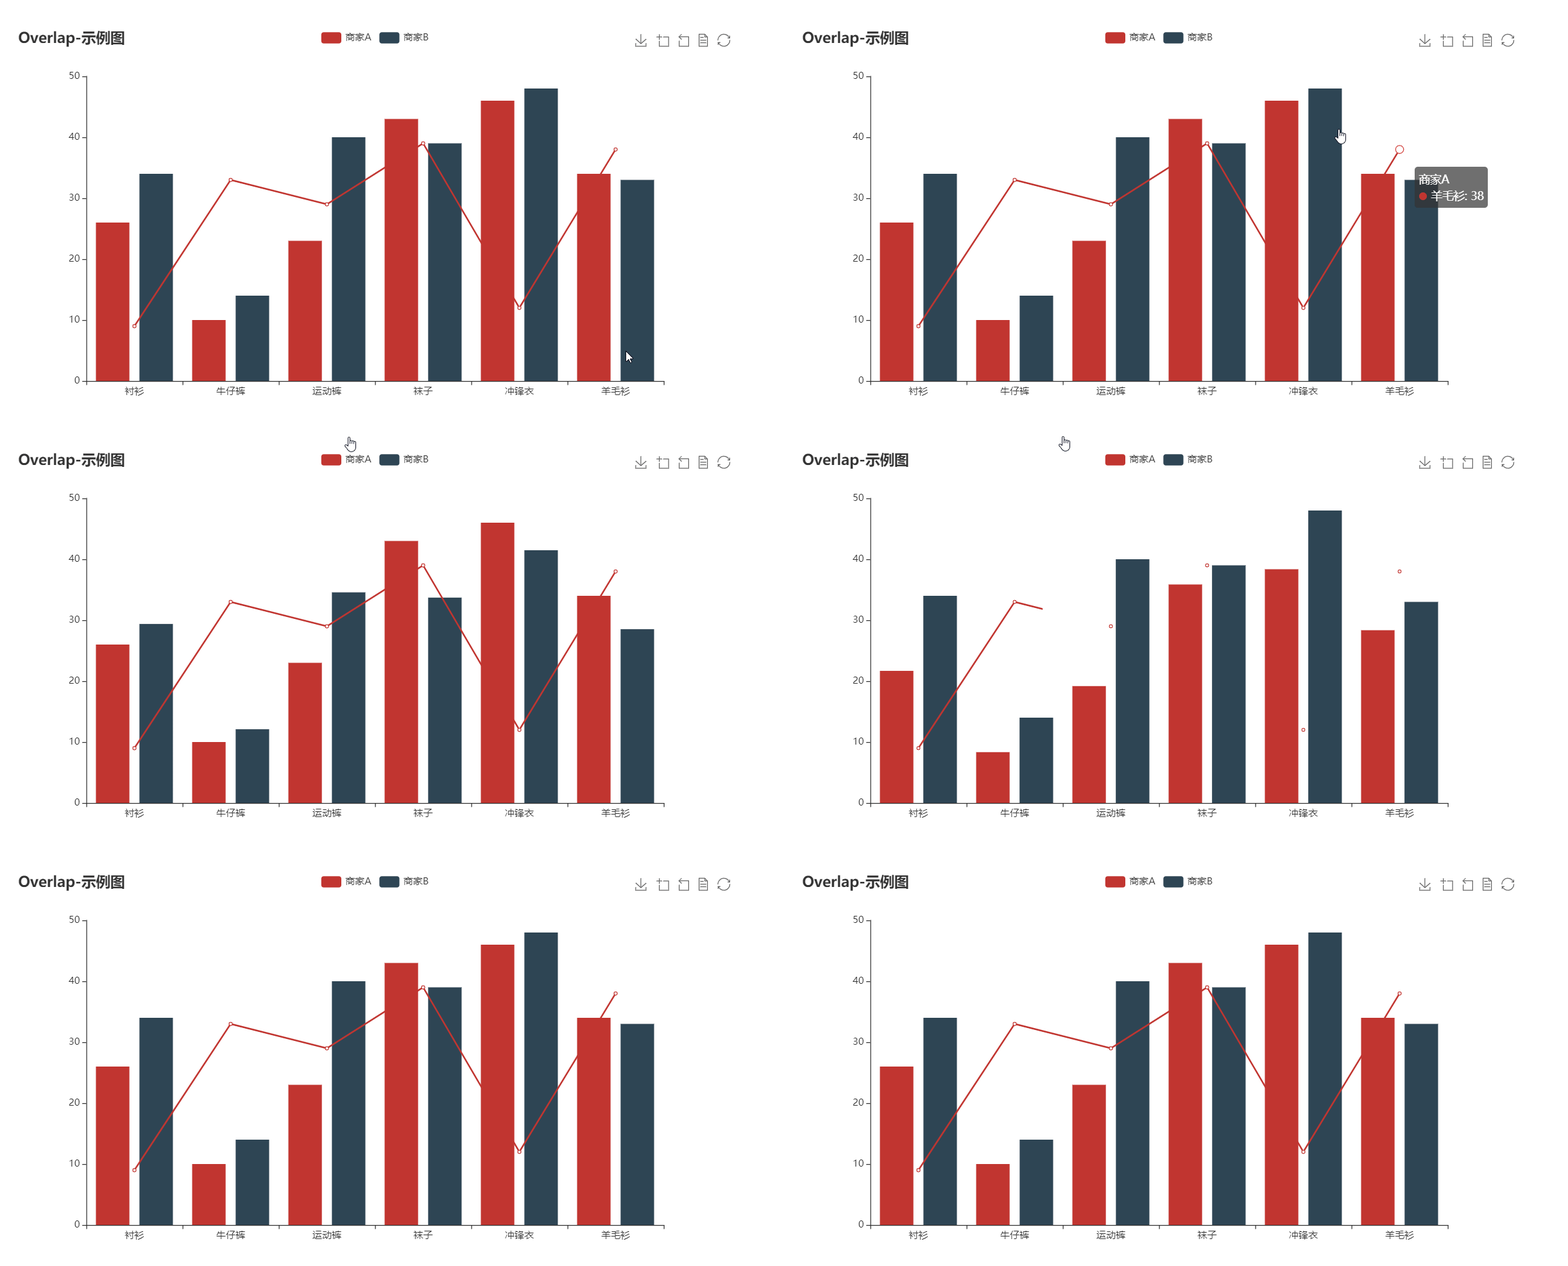
bar boxplot effectScatter funnel gague geo graph heatmap kline line liquid map parallel pie radar scatter wordCloud bar3D line3D sankey scatter3D surface3D themeRiver overlap

Features

Note: flutter_echarts focuses on complex charts and interactions. It's implemented by WebView. If you prefer better performance and capability but simpler charts, we recommend this pure Flutter visualization lib: Graphic

Reactive Updating

The most exciting feature of Flutter widgets and React components is that the view can update reactively when data changes. Thanks to ECharts' data driven architecture, flutter_echarts implements a reactive way to connect charts with data. The charts automatically re-render when data in the option property changes.

Two Way Communication

The onMessage and extraScript properties provide a way to set two-way event communication between Flutter and JavaScript.

Configurable Extensions

ECharts has a lot of extensions. The extensions property allows you to inject the extension scripts as raw strings. In this way, you can copy these scripts to your source code without being confusing by assets dirs.

Installing

Add this to your package's pubspec.yaml file:

dependencies:
  flutter_echarts: #latest version

Now in your Dart code, you can use:

import 'package:flutter_echarts/flutter_echarts.dart';  

Details see pub.dev.

Usage

The flutter_echarts package itself is very simple to use, just like a common statelessWidget:

Details about the option object is in the Echarts docs or Echarts examples.

Container(
  child: Echarts(
  option: '''
    {
      xAxis: {
        type: 'category',
        data: ['Mon', 'Tue', 'Wed', 'Thu', 'Fri', 'Sat', 'Sun']
      },
      yAxis: {
        type: 'value'
      },
      series: [{
        data: [820, 932, 901, 934, 1290, 1330, 1320],
        type: 'line'
      }]
    }
  ''',
  ),
  width: 300,
  height: 250,
)

See the full flutter_echarts_example.

Widget Properties

option

String

( required )

ECharts is mainly configured by passing a string value to the JavaScript option property.

You can use jsonEncode() function in dart:convert to convert data in Dart object form:

source: ${jsonEncode(_data1)},

Because JavaScript don't have ''', you can use this operator to reduce some escape operators for quotas:

Echarts(
  option: '''
  
    // option string
    
  ''',
),

To use images in option properties, we suggest the Base64 Data URL :

image: 'data:image/png;base64,iVBORw0KG...',

extraScript

String

JavaScript which will execute after the Echarts.init() and before any chart.setOption(). The widget has a Javascript channel named Messager, so you can use this identifier to send messages from JavaScript to Flutter:

extraScript: '''
  chart.on('click', (params) => {
    if(params.componentType === 'series') {
        Messager.postMessage('anything');
    }
  });
''',

onMessage

void Function(String)

Function to handle the message sent by Messager.postMessage() in extraScript .

extensions

List<String>

List of strings are from Echarts extensions, such as themes, components, WebGL, and languages. You can download them from the official ECharts extension list. Insert extensions as raw strings:

const liquidPlugin = r'''

  // copy from liquid.min.js

''';

theme

String

You can download built-in ECharts themes or build your own custom themes with the ECharts theme builder. Copy the theme script into the extensions param and register the theme name with this param.

captureAllGestures

bool

( default: false )

Setting captureAllGestures to true is useful when handling 3D rotation and data zoom bars. Note that setting prevents containers like ListViews from reacting to gestures on the charts.

If true, captureHorizontalGestures and captureVerticalGestures are forced true.

captureHorizontalGestures

bool

( default: false )

Only capture horizontal gestures.

captureVerticalGestures

bool

( default: false )

Only capture vertical gestures.

onLoad

void Function()

The callback when first time the chart is loaded and rendered.

Blog

Reactive Echarts Flutter Widget

A performance optimization of Flutter WebView


If you have any suggestions or requests, please open an issue.

The gallery GIF is from chenjiandongx

Note that the project description data, including the texts, logos, images, and/or trademarks, for each open source project belongs to its rightful owner. If you wish to add or remove any projects, please contact us at [email protected].