aylei / Aliyun Exporter
Programming Languages
Projects that are alternatives of or similar to Aliyun Exporter
Prometheus Exporter for Alibaba Cloud
Note: This repository has been archived due to lacking of human power.
- Features
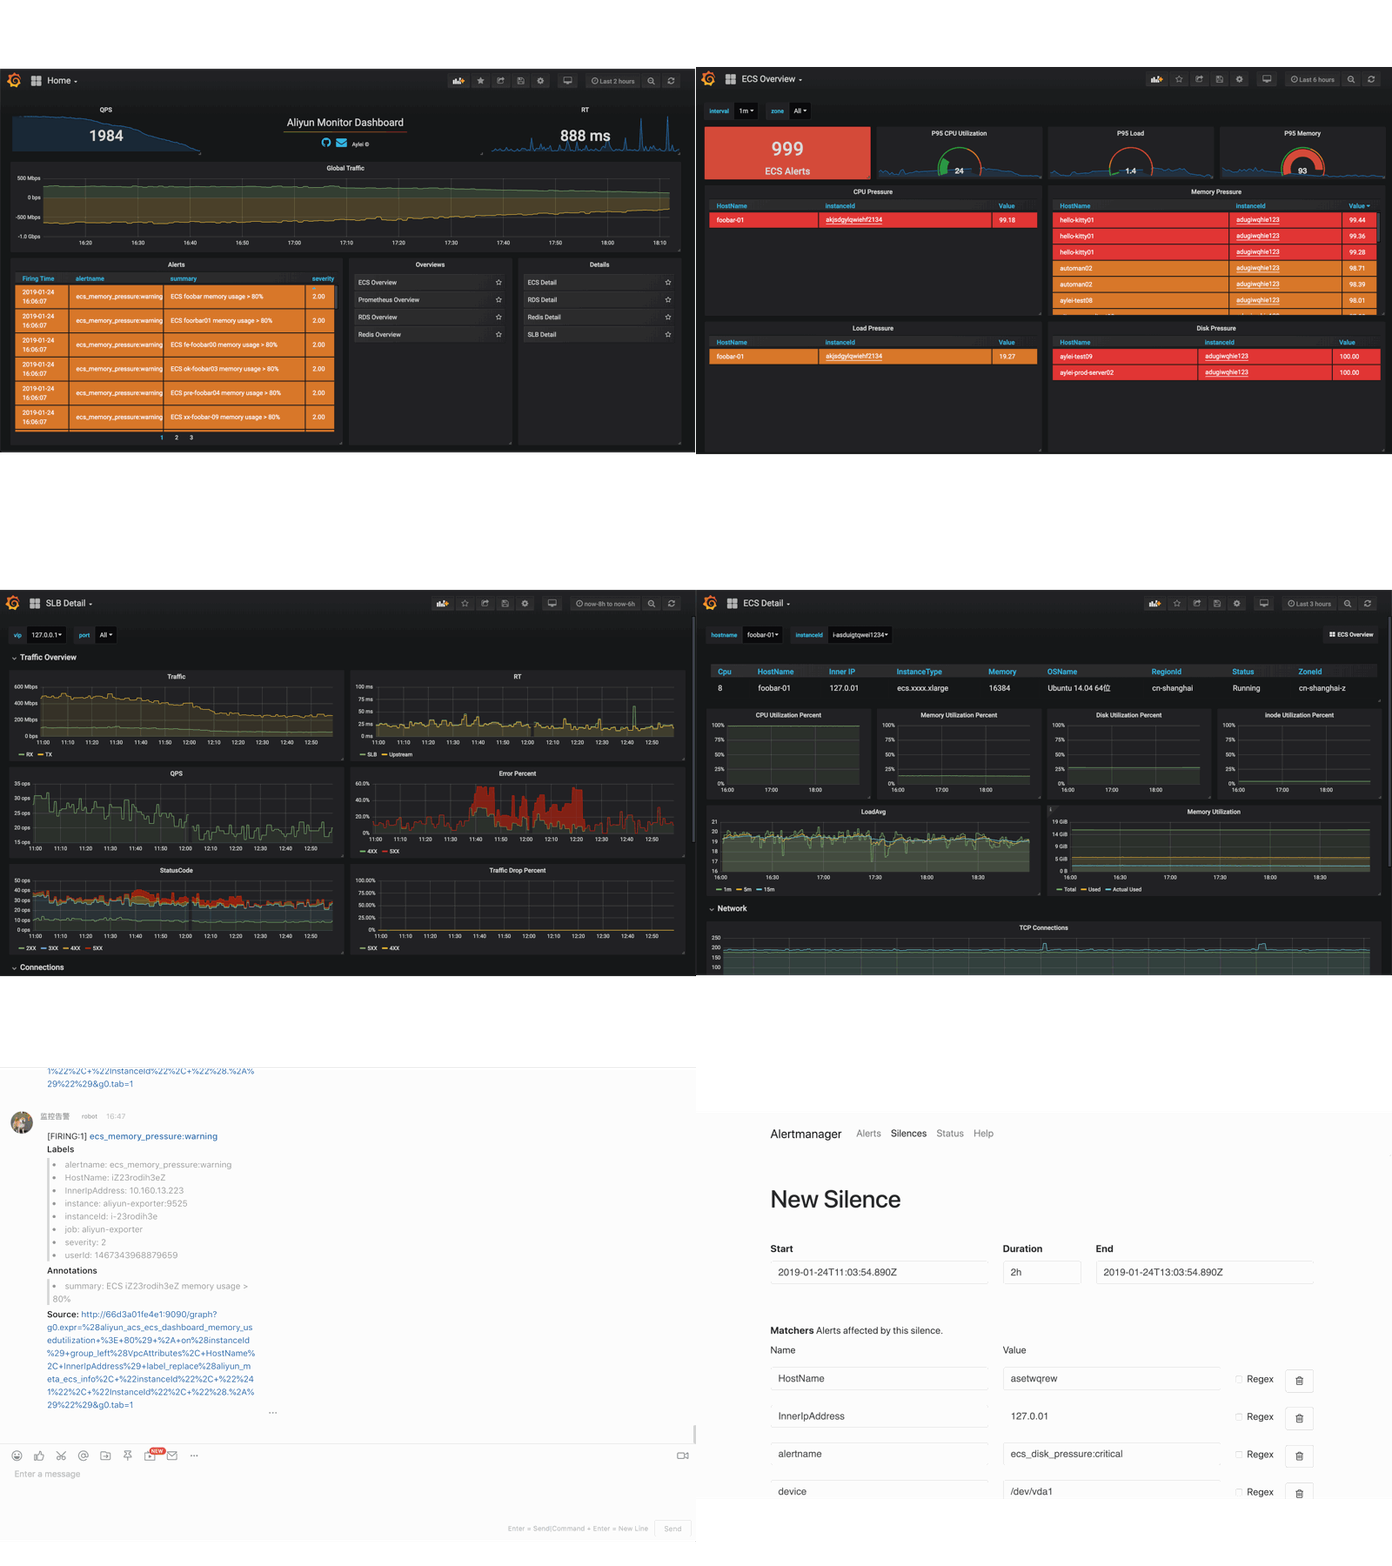
- Screenshots
- Quick Start
- Installation
- Usage
- Docker Image
- Configuration
- Metrics Meta
- Scale and HA Setup
- Contribute
This Prometheus exporter collects metrics from the CloudMonitor API of Alibaba Cloud. It can help you:
- integrate CloudMonitor to your Monitoring System.
- leverage the power of PromQL, Alertmanager and Grafana(see Screenshots).
- analyze metrics however you want.
- save money. Api invocation is far cheaper than other services provided by CloudMonitor.
This project also provides an out-of-box solution for full-stack monitoring of Alibaba Cloud, including dashboards, alerting and diagnosing.
Screenshots
Quick Start
A docker-compose stack is provided to launch the entire monitoring stack with Aliyun-Exporter, Prometheus, Grafana and Alertmanager.
Pre-requisites: docker 1.17+
git clone [email protected]:aylei/aliyun-exporter.git
cd docker-compose
ALIYUN_ACCESS_ID=YOUR_ACCESS_ID ALIYUN_ACCESS_SECRET=YOUR_ACCESS_KEY docker-compose up
Investigate dashboards in localhost:3000 (the default credential for Grafana is admin:admin).
For more details, see Docker Compose.
Installation
Python 3.5+ is required.
pip3 install aliyun-exporter
Usage
Config your credential and interested metrics:
credential:
  access_key_id: <YOUR_ACCESS_KEY_ID>
  access_key_secret: <YOUR_ACCESS_KEY_SECRET>
  region_id: <REGION_ID>

metrics:
  acs_cdn:
  - name: QPS
  acs_mongodb:
  - name: CPUUtilization
    period: 300
Run the exporter:
> aliyun-exporter -p 9525 -c aliyun-exporter.yml
The default port is 9525, default config file location is ./aliyun-exporter.yml.
Visit metrics in localhost:9525/metrics
Docker Image
Install
docker pull aylei/aliyun-exporter:0.3.1
To run the container, external configuration file is required:
docker run -p 9525:9525 -v $(pwd)/aliyun-exporter.yml:$(pwd)/aliyun-exporter.yml aylei/aliyun-exporter:0.3.1 -c $(pwd)/aliyun-exporter.yml
Configuration
rate_limit: 5 # request rate limit per second. default: 10
credential:
  access_key_id: <YOUR_ACCESS_KEY_ID> # required
  access_key_secret: <YOUR_ACCESS_KEY_SECRET> # required
  region_id: <REGION_ID> # default: 'cn-hangzhou'

metrics: # required, metrics specifications
  acs_cdn: # required, Project Name of CloudMonitor
  - name: QPS # required, Metric Name of CloudMonitor, belongs to a certain Project
    rename: qps # rename the related prometheus metric. default: same as the 'name'
    period: 60 # query period. default: 60
    measure: Average # measure field in the response. default: Average

info_metrics:
  - ecs
  - rds
  - redis
Notes:
- Find your target metrics using Metrics Meta
- CloudMonitor API has an rate limit, tuning the
rate_limitconfiguration if the requests are rejected. - CloudMonitor API also has an monthly quota for invocations (AFAIK, 5,000,000 invocations / month for free). Plan your usage in advance.
Given that you have 50 metrics to scrape with 60s scrape interval, about 2,160,000 requests will be sent by the exporter for 30 days.
Special Project
Some metrics are not included in the Cloud Monitor API. For these metrics, we keep the configuration abstraction consistent by defining special projects.
Special Projects:
-
rds_performance: RDS performance metrics, available metric names: Performance parameter table
An example configuration file of special project is provided as
special-projects.yml
Note: special projects invokes different API with ordinary metrics, so it will not consume your Cloud Monitor API invocation quota. But the API of special projects could be slow, so it is recommended to separate special projects into a standalone exporter instance.
Metrics Meta
aliyun-exporter shipped with a simple site hosting the metrics meta from the CloudMonitor API. You can visit the metric meta in localhost:9525 after launching the exporter.
-
host:portwill host all the available monitor projects -
host:port/projects/{project}will host the metrics meta of a certain project -
host:port/yaml/{project}will host a config YAML of the project's metrics
you can easily navigate in this pages by hyperlink.
Docker Compose
From 0.3.1, we provide a docker-compose stack to help users building monitoring stack from scratch. The stack contains:
- aliyun-exporter (this project): Retrieving metrics (and instance information) from Alibaba Cloud.
- Prometheus: Metric storage and alerting calculation.
- Alertmanager: Alert routing and notifying.
- Grafana: Dashboards.
- prometheus-webhook-dingtalk: DingTalk (a.k.a. DingDing) notification integrating.
Here's a detailed launch guide:
# config prometheus external host
export PROMETHEUS_HOST=YOUR_PUBLIC_IP_OR_HOSTNAME
# config dingtalk robot token
export DINGTALK_TOKEN=YOUR_DINGTALK_ROBOT_TOEKN
# config aliyun-exporter credential
export ALIYUN_REGION=YOUR_REGION
export ALIYUN_ACCESS_ID=YOUR_ID
export ALIYUN_ACCESS_SECRET=YOUR_SECRET
docker-compose up -d
After launching, you can access:
- grafana: http://localhost:3000
- prometheus: http://localhost:9090
- alertmanager: http://localhost:9093
You may customize the configuration of this components by editing the configuration files in ./docker-compose/{component}
Telemetry
Request success summary and failure summary are exposed in cloudmonitor_request_latency_seconds and cloudmonitor_failed_request_latency_seconds.
Each Project-Metric pair will have a corresponding metric named aliyun_{project}_{metric}_up, which indicates whether this metric are successfully scraped.
Scale and HA Setup
The CloudMonitor API could be slow if you have large amount of resources. You can separate metrics over multiple exporter instances to scale.
For HA setup, simply duplicate your deployments: 2 * prometheus, and 2 * exporter for each prometheus.
HA Setup will double your requests, which may run out your quota.
Contribute
Feel free to open issues and pull requests, any feedback will be highly appreciated!
Please check the help wanted label to find issues that are good for getting started.
Besides, contributing to new alert rules, new dashboards is also welcomed!


