Strech / Sidekiq Prometheus Exporter
Programming Languages
Projects that are alternatives of or similar to Sidekiq Prometheus Exporter
Sidekiq Prometheus Exporter
— Hey! Sidekiq dashboard stats looks like a Prometheus metrics!?
— Indeed ... 🤔
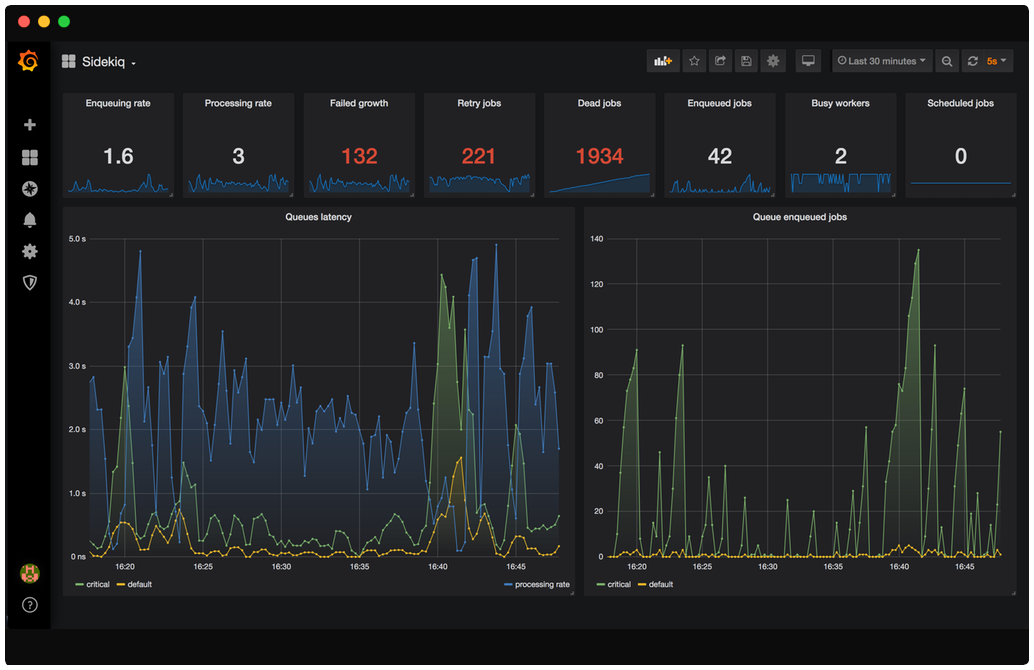
Open dashboard example file (grafana 7), then open https://<your grafana-url>/dashboard/import and paste the content of the file.
If you like the project and want to support me on my sleepless nights, you can
Available metrics
(starting Sidekiq v3.3.1)
Standard
| Name | Type | Description |
|---|---|---|
| sidekiq_processed_jobs_total | counter | The total number of processed jobs |
| sidekiq_failed_jobs_total | counter | The total number of failed jobs |
| sidekiq_workers | gauge | The number of workers across all the processes |
| sidekiq_processes | gauge | The number of processes |
| sidekiq_busy_workers | gauge | The number of workers performing the job |
| sidekiq_enqueued_jobs | gauge | The number of enqueued jobs |
| sidekiq_scheduled_jobs | gauge | The number of jobs scheduled for a future execution |
| sidekiq_retry_jobs | gauge | The number of jobs scheduled for the next try |
| sidekiq_dead_jobs | gauge | The number of jobs being dead |
| sidekiq_queue_latency_seconds | gauge | The number of seconds between oldest job being pushed to the queue and current time (labels: name) |
| sidekiq_queue_max_processing_time_seconds | gauge | The number of seconds between oldest job of the queue being executed and current time (labels: name) |
| sidekiq_queue_enqueued_jobs | gauge | The number of enqueued jobs in the queue (labels: name) |
Click to expand for all available contribs
Scheduler
| Name | Type | Description |
|---|---|---|
| sidekiq_scheduler_jobs | gauge | The number of recurring jobs |
| sidekiq_scheduler_enabled_jobs | gauge | The number of enabled recurring jobs |
| sidekiq_scheduler_time_since_last_run_minutes | gauge | The number of minutes since the last recurring job was executed and current time (labels: name) |
Cron
| Name | Type | Description |
|---|---|---|
| sidekiq_cron_jobs | gauge | The number of cron jobs |
Installation
Add this line to your application's Gemfile:
gem 'sidekiq-prometheus-exporter', '~> 0.1'
And then execute:
$ bundle
Or install it yourself as:
$ gem install sidekiq-prometheus-exporter -v '~> 0.1'
Rack application
For a fresh new application to expose metrics create config.ru file with
next code inside
require 'sidekiq'
require 'sidekiq/prometheus/exporter'

Sidekiq.configure_client do |config|
  config.redis = {url: 'redis://<your-redis-host>:6379/0'}
end

run Sidekiq::Prometheus::Exporter.to_app
Use your favorite server to start it up, like this
$ bundle exec rackup -p9292 -o0.0.0.0
and then curl https://0.0.0.0:9292/metrics
Rails application
When you have rails application, it's possible to mount exporter
as a rack application in your routes.rb
Rails.application.routes.draw do
  # ... omitted ...

  # For more information please check here
  # https://api.rubyonrails.org/v5.1/classes/ActionDispatch/Routing/Mapper/Base.html#method-i-mount
  require 'sidekiq/prometheus/exporter'
  mount Sidekiq::Prometheus::Exporter => '/metrics'
end
Use rails server from bin folder to start it up, like this
$ ./bin/rails s -p 9292 -b 0.0.0.0
and then curl https://0.0.0.0:9292/metrics
Sidekiq Web (extream)
If you are ok with metrics being exposed via Sidekiq web dashboard because
you have it inside your private network or only Prometheus scraper will have access
to a machine/port/etc, then add a few lines into your web config.ru
require 'sidekiq/web'
require 'sidekiq/prometheus/exporter'

Sidekiq::Web.register(Sidekiq::Prometheus::Exporter)
and then curl https://<your-sidekiq-web-uri>/metrics
Docker
If we are talking about isolation you can run already prepared official rack application in the Docker container by using the public image (check out this README for more)
$ docker run -it --rm \
             -p 9292:9292 \
             -e REDIS_URL=redis://<your-redis-host>:6379/0 \
             strech/sidekiq-prometheus-exporter
and then curl https://0.0.0.0:9292/metrics
Helm
And finally the cloud solution (who don't these days). Easy to install, easy to use. A fully-functioning Helm-package based on official Docker image, comes with lots of configuration options
$ helm repo add strech https://strech.github.io/sidekiq-prometheus-exporter
"strech" has been added to your repositories

$ helm install strech/sidekiq-prometheus-exporter --name sidekiq-metrics
to curl your metrics, please follow the post-installation guide
Tips&Tricks
If you want to see at the exporter startup time a banner about which exporters
are enabled add this call to your config.ru (but after exporter configure statement)
require 'sidekiq/prometheus/exporter'

puts Sidekiq::Prometheus::Exporter.banner
💢 if you don't see your banner try to output into STDERR instead of
STDOUT
Sidekiq Contribs
By default we try to detect as many as possible sidekiq contribs and add their metrics to the output. But you can change this behaviour by configuring exporters setting
require 'sidekiq/prometheus/exporter'

# Keep the default auto-detect behaviour
Sidekiq::Prometheus::Exporter.configure do |config|
  config.exporters = :auto_detect
end

# Keep only standard (by default) and cron metrics
Sidekiq::Prometheus::Exporter.configure do |config|
  config.exporters = %i(cron)
end
💡 if you did't find the contrib you would like to see, don't hesitate to open an issue and describe what do you think we should export.
Contributing
Bug reports and pull requests to support earlier versions of Sidekiq are welcome on GitHub at https://github.com/Strech/sidekiq-prometheus-exporter/issues.
If you are missing your favourite Sidekiq contrib and want to contribute, please make sure that you are following naming conventions from Prometheus.
License
Please see LICENSE for licensing details.


