t-makaro / Animatplot
Licence: mit
A python package for animating plots build on matplotlib.
Stars: ✭ 359
Programming Languages
python
139335 projects - #7 most used programming language
Projects that are alternatives of or similar to Animatplot
Scottplot
Interactive Plotting Library for .NET
Stars: ✭ 736 (+105.01%)
Mutual labels: data-visualization, plotting
Clip
Create charts from the command line
Stars: ✭ 5,111 (+1323.68%)
Mutual labels: data-visualization, plotting
Joypy
Joyplots in Python with matplotlib & pandas 📈
Stars: ✭ 322 (-10.31%)
Mutual labels: data-visualization, plotting
Corner.py
Make some beautiful corner plots
Stars: ✭ 327 (-8.91%)
Mutual labels: data-visualization, plotting
Sjplot
sjPlot - Data Visualization for Statistics in Social Science
Stars: ✭ 432 (+20.33%)
Mutual labels: data-visualization, plotting
Uplot
📈 A small, fast chart for time series, lines, areas, ohlc & bars
Stars: ✭ 6,808 (+1796.38%)
Mutual labels: data-visualization, plotting
Bubbly
A python package for plotting animated and interactive bubble charts using Plotly
Stars: ✭ 37 (-89.69%)
Mutual labels: data-visualization, plotting
Gr.rb
Ruby wrapper for the GR framework
Stars: ✭ 60 (-83.29%)
Mutual labels: data-visualization, plotting
Tablesaw
Java dataframe and visualization library
Stars: ✭ 2,785 (+675.77%)
Mutual labels: data-visualization, plotting
Cmasher
Scientific colormaps for making accessible, informative and 'cmashing' plots
Stars: ✭ 149 (-58.5%)
Mutual labels: data-visualization, plotting
Orange3
🍊 📊 💡 Orange: Interactive data analysis
Stars: ✭ 3,152 (+777.99%)
Mutual labels: data-visualization, plotting
Dash Docs
📖 The Official Dash Userguide & Documentation
Stars: ✭ 338 (-5.85%)
Mutual labels: data-visualization
Swiftplot
Swift library for Data Visualization 📊
Stars: ✭ 319 (-11.14%)
Mutual labels: data-visualization
Housepricing
HousePricing旨在提供房价的可视化预测,帮助用户更好的评估房产和预测未来的价格(dev)
Stars: ✭ 314 (-12.53%)
Mutual labels: data-visualization
Honeypot
Low interaction honeypot that displays real time attacks
Stars: ✭ 348 (-3.06%)
Mutual labels: data-visualization
Geoviews
Simple, concise geographical visualization in Python
Stars: ✭ 338 (-5.85%)
Mutual labels: plotting
Pyart
The Python-ARM Radar Toolkit. A data model driven interactive toolkit for working with weather radar data.
Stars: ✭ 312 (-13.09%)
Mutual labels: data-visualization
Pix Plot
A WebGL viewer for UMAP or TSNE-clustered images
Stars: ✭ 306 (-14.76%)
Mutual labels: data-visualization
animatplot
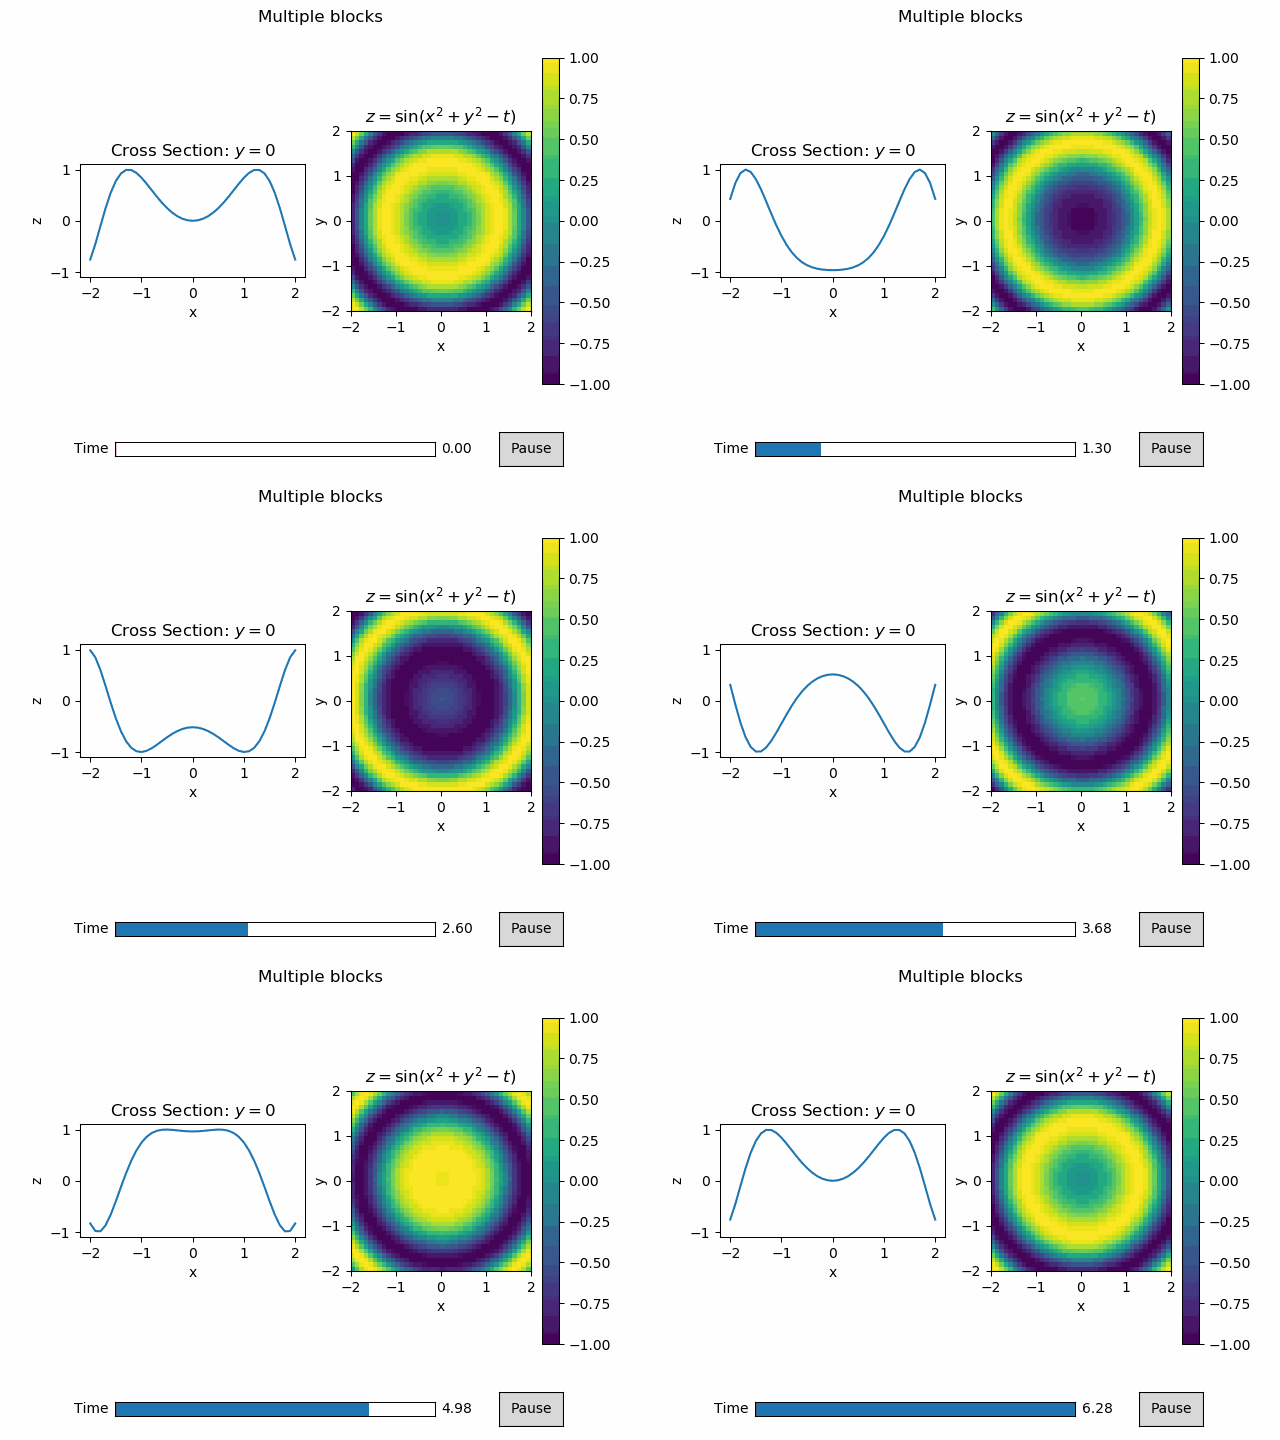
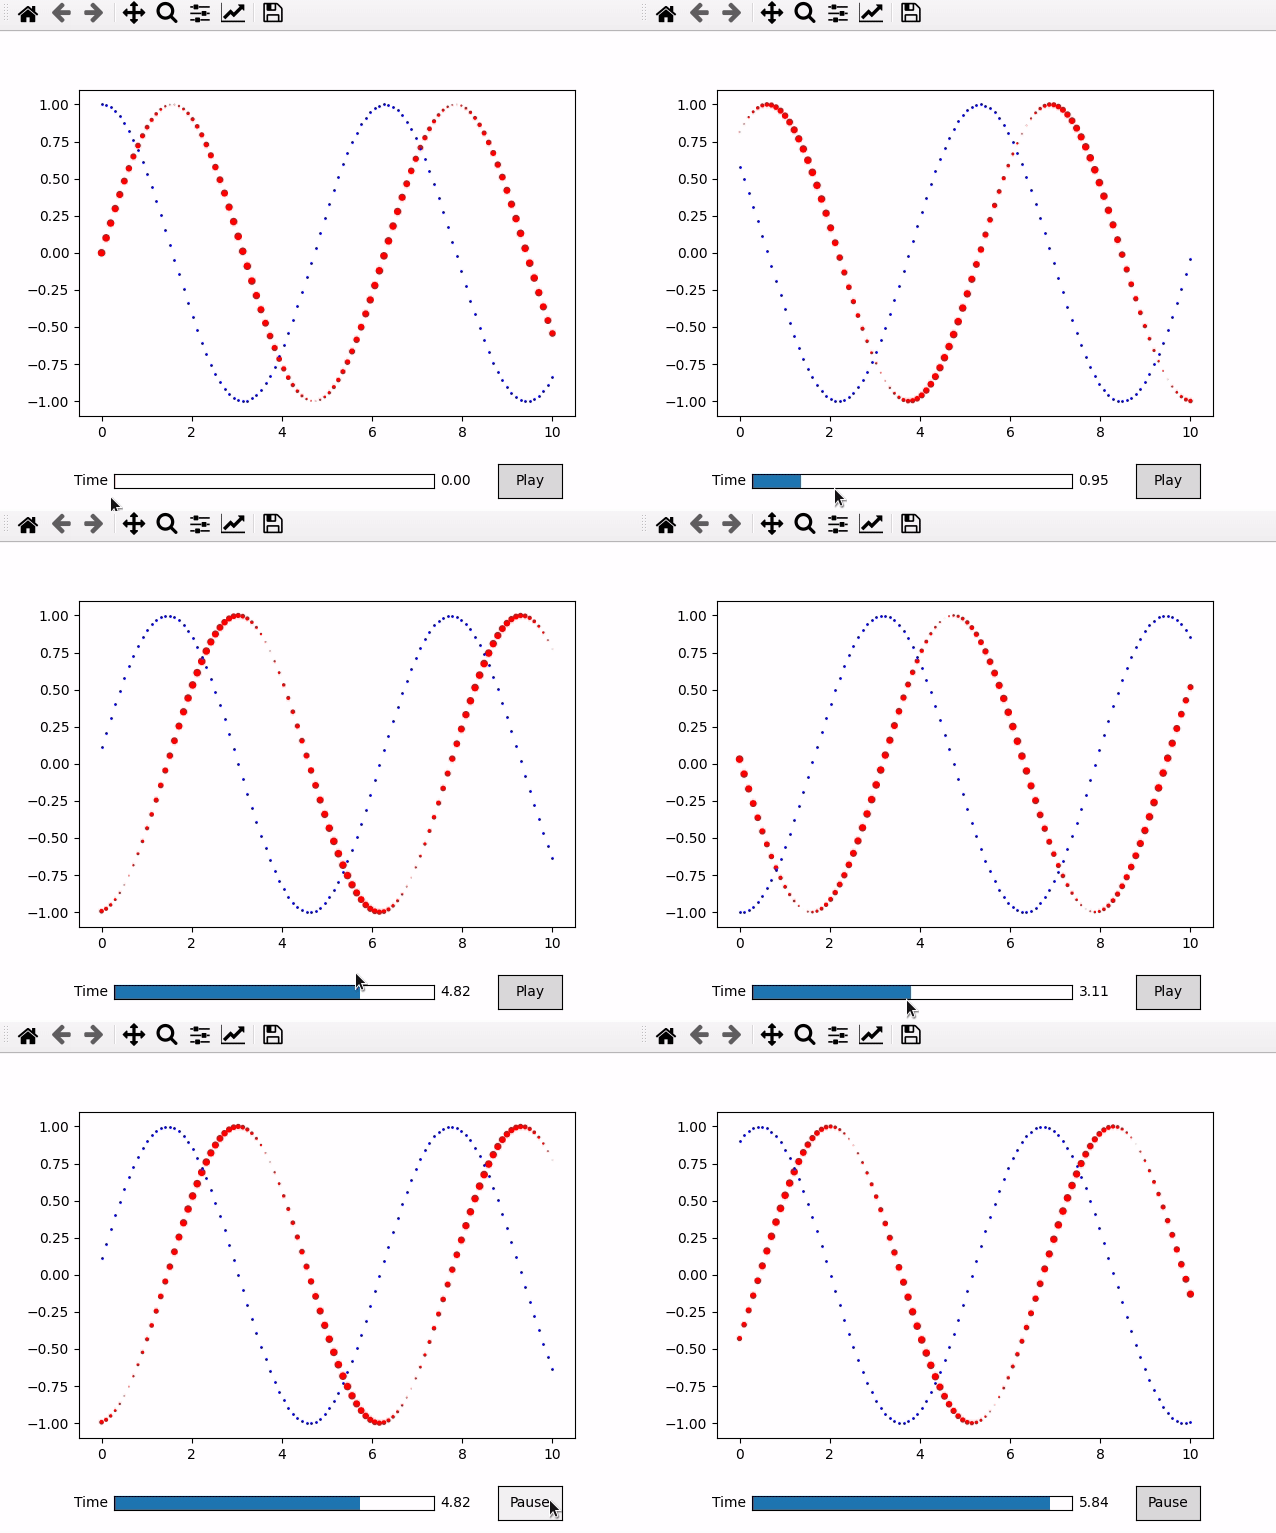
A python package for making interactive as well as animated plots with matplotlib.
Requires
- Python >= 3.5
- Matplotlib >= 2.2 (because sliders have discrete values)
Installation
pip install animatplot
or using conda
conda install animatplot -c conda-forge
Documentation
Documentation can be found here
Dev Install
git clone https://github.com/t-makaro/animatplot.git
pip install -e .
This project uses pycodestyle for linting. For testing, pytest is used.
Note that the project description data, including the texts, logos, images, and/or trademarks,
for each open source project belongs to its rightful owner.
If you wish to add or remove any projects, please contact us at [email protected].


