All Projects → ScottPlot → Scottplot

ScottPlot / Scottplot

Licence: mit
Interactive Plotting Library for .NET

Projects that are alternatives of or similar to Scottplot

Ggplotnim
A port of ggplot2 for Nim
Stars: ✭ 95 (-87.09%)
Mutual labels:  data-visualization, plotting, plot
Uplot
📈 A small, fast chart for time series, lines, areas, ohlc & bars
Stars: ✭ 6,808 (+825%)
Mutual labels:  data-visualization, plotting, plot
Termplotlib
Plotting on the command line
Stars: ✭ 294 (-60.05%)
Mutual labels:  plotting, plot
Joypy
Joyplots in Python with matplotlib & pandas 📈
Stars: ✭ 322 (-56.25%)
Mutual labels:  data-visualization, plotting
Ggthemr
Themes for ggplot2.
Stars: ✭ 697 (-5.3%)
Mutual labels:  data-visualization, plotting
charter
DSL and C Library to generate SVG Plot
Stars: ✭ 39 (-94.7%)
Mutual labels:  plot, plotting
svg plot
Plot data in SVG format using C++ (header only) library .
Stars: ✭ 20 (-97.28%)
Mutual labels:  plot, plotting
Animatplot
A python package for animating plots build on matplotlib.
Stars: ✭ 359 (-51.22%)
Mutual labels:  data-visualization, plotting
Aachartkit Swift
📈📊📱💻🖥️An elegant modern declarative data visualization chart framework for iOS, iPadOS and macOS. Extremely powerful, supports line, spline, area, areaspline, column, bar, pie, scatter, angular gauges, arearange, areasplinerange, columnrange, bubble, box plot, error bars, funnel, waterfall and polar chart types. 极其精美而又强大的跨平台数据可视化图表框架,支持柱状图、条形图、…
Stars: ✭ 1,962 (+166.58%)
Mutual labels:  data-visualization, plot
Lets Plot
An open-source plotting library for statistical data.
Stars: ✭ 531 (-27.85%)
Mutual labels:  data-visualization, plot
Plotly
Plotly for Rust
Stars: ✭ 433 (-41.17%)
Mutual labels:  data-visualization, plot
Gramm
Gramm is a complete data visualization toolbox for Matlab. It provides an easy to use and high-level interface to produce publication-quality plots of complex data with varied statistical visualizations. Gramm is inspired by R's ggplot2 library.
Stars: ✭ 541 (-26.49%)
Mutual labels:  data-visualization, plot
Orange3
🍊 📊 💡 Orange: Interactive data analysis
Stars: ✭ 3,152 (+328.26%)
Mutual labels:  data-visualization, plotting
Tablesaw
Java dataframe and visualization library
Stars: ✭ 2,785 (+278.4%)
Mutual labels:  data-visualization, plotting
sr graph
A simple, one-file, header-only, C++ utility for graphs, curves and histograms.
Stars: ✭ 67 (-90.9%)
Mutual labels:  plot, plotting
Cmasher
Scientific colormaps for making accessible, informative and 'cmashing' plots
Stars: ✭ 149 (-79.76%)
Mutual labels:  data-visualization, plotting
Corner.py
Make some beautiful corner plots
Stars: ✭ 327 (-55.57%)
Mutual labels:  data-visualization, plotting
Wesanderson
A Wes Anderson color palette for R
Stars: ✭ 1,343 (+82.47%)
Mutual labels:  data-visualization, plot
Covid19 Dashboard
🦠 Django + Plotly Coronavirus dashboard. Powerful data driven Python web-app, with an awesome UI. Contributions welcomed! Featured on 🕶Awesome-list
Stars: ✭ 100 (-86.41%)
Mutual labels:  data-visualization, plot
Sjplot
sjPlot - Data Visualization for Statistics in Social Science
Stars: ✭ 432 (-41.3%)
Mutual labels:  data-visualization, plotting

ScottPlot

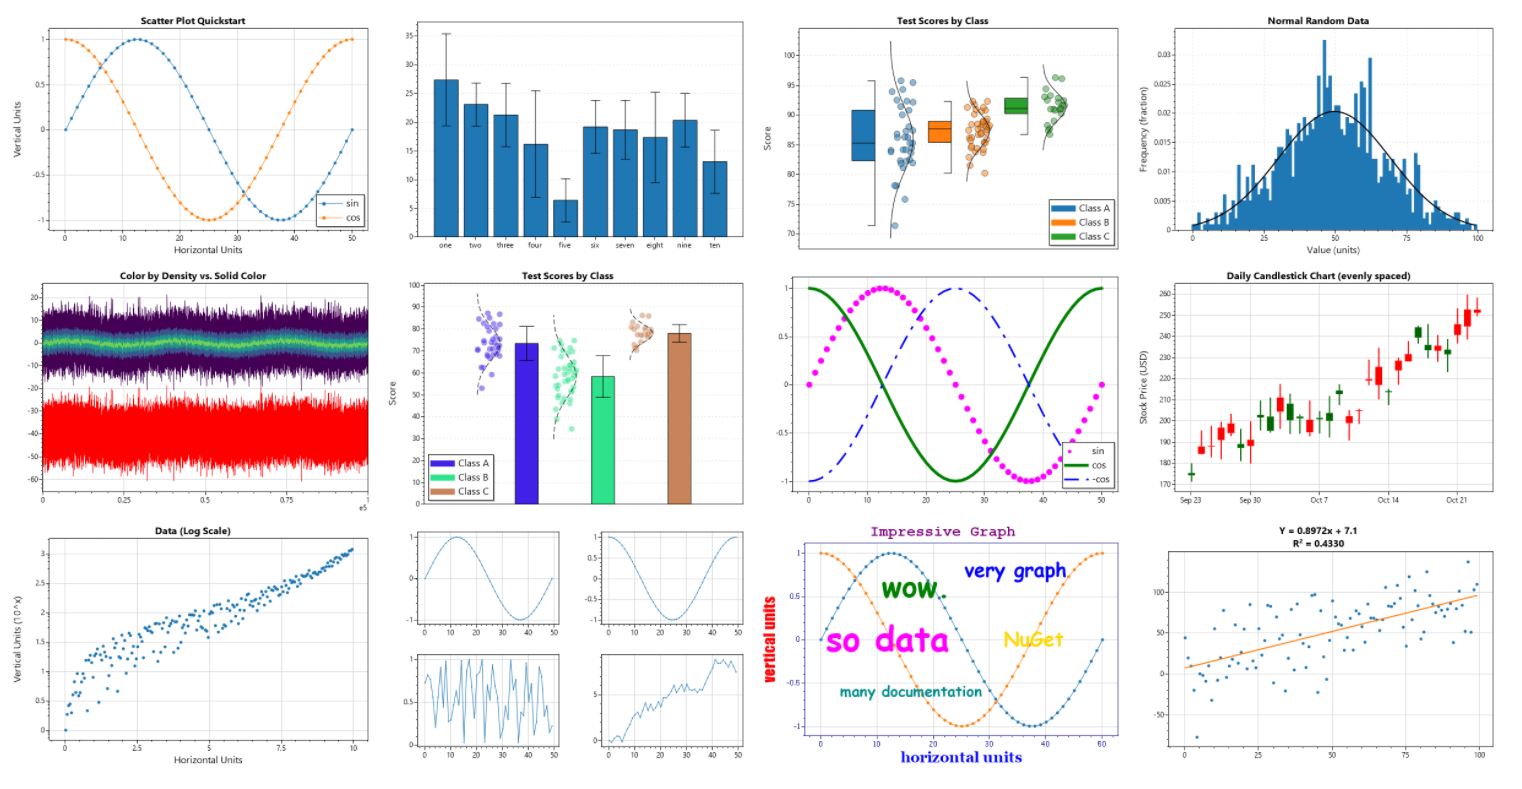
ScottPlot is a free and open-source plotting library for .NET that makes it easy to interactively display large datasets. The ScottPlot Cookbook demonstrates how to create line plots, bar charts, pie graphs, scatter plots, and more with just a few lines of code.

Questions and Feedback

Major Versions

  • See Releases for source code and notes for all versions

  • ScottPlot 4.1 is being actively-developed and is currently available as a pre-release package on NuGet. This version is faster than 4.0, supports multiple axes, and has a simpler API and a much better cookbook.

  • ScottPlot 4.0 is stable, available on NuGet, and has its own branch for continued bug fixes and refinements. However, new features are no longer being developed for this version.

Plot in the Cloud

This figure is an example of ScottPlot running in the cloud. Once daily an Azure Function logs the number of stars this repository has and creates a graph of the star history using ScottPlot. Since the output is simply a static image accessible by a URL, it can be displayed in places where JavaScript is not permitted like in this readme file. Rendering plots server-side allows automatically-updating plots to be displayed in many interesting places. Source code can be found in the StarGraph repository.

Developer Notes

  • Minimum Supported Platforms: .NET Core 2.0 and .NET Framework 4.6.1 (see details)

  • The ScottPlot Roadmap summarizes ScottPlot's origins and tracks development goals. If there is a pinned Triaged Tasks and Features issue on the issues page, it likely indicates what I am currently working on.

  • Contributions are welcome! See contributing.md to get started

About ScottPlot

ScottPlot was created by Scott W Harden (with many contributions from the open-source community) and is provided under the permissive MIT license.

Note that the project description data, including the texts, logos, images, and/or trademarks, for each open source project belongs to its rightful owner. If you wish to add or remove any projects, please contact us at [email protected].