All Projects → carbon-design-system → Carbon Charts

carbon-design-system / Carbon Charts

Licence: apache-2.0
📊 📈⠀Robust dataviz framework implemented using D3 & typescript

Programming Languages

typescript
32286 projects

Projects that are alternatives of or similar to Carbon Charts

Ngx Charts
📊 Declarative Charting Framework for Angular
Stars: ✭ 4,057 (+1313.59%)
Mutual labels:  hacktoberfest, dataviz, d3, d3js
Nivo
nivo provides a rich set of dataviz components, built on top of the awesome d3 and React libraries
Stars: ✭ 9,550 (+3227.53%)
Mutual labels:  dataviz, charts, d3js
proteic
Streaming and static data visualization for the modern web.
Stars: ✭ 37 (-87.11%)
Mutual labels:  d3, charts, dataviz
Keen Dataviz.js
Data Visualization Charting Library
Stars: ✭ 215 (-25.09%)
Mutual labels:  dataviz, charts, d3
silky-charts
A silky smooth D3/React library
Stars: ✭ 38 (-86.76%)
Mutual labels:  d3, charts, dataviz
Vue D3 Workshop
Workshop content material and excercises for Suncoast Developers
Stars: ✭ 63 (-78.05%)
Mutual labels:  dataviz, d3, d3js
leaflet heatmap
简单的可视化湖州通话数据 假设数据量很大,没法用浏览器直接绘制热力图,把绘制热力图这一步骤放到线下计算分析。使用Apache Spark并行计算数据之后,再使用Apache Spark绘制热力图,然后用leafletjs加载OpenStreetMap图层和热力图图层,以达到良好的交互效果。现在使用Apache Spark实现绘制,可能是Apache Spark不擅长这方面的计算或者是我没有设计好算法,并行计算的速度比不上单机计算。Apache Spark绘制热力图和计算代码在这 https://github.com/yuanzhaokang/ParallelizeHeatmap.git .
Stars: ✭ 13 (-95.47%)
Mutual labels:  d3, dataviz, d3js
Dex
Dex : The Data Explorer -- A data visualization tool written in Java/Groovy/JavaFX capable of powerful ETL and publishing web visualizations.
Stars: ✭ 1,238 (+331.36%)
Mutual labels:  dataviz, d3, d3js
Plotly.js
Open-source JavaScript charting library behind Plotly and Dash
Stars: ✭ 14,268 (+4871.43%)
Mutual labels:  hacktoberfest, charts, d3
V Chart Plugin
Easily bind a chart to the data stored in your Vue.js components.
Stars: ✭ 188 (-34.49%)
Mutual labels:  hacktoberfest, d3, d3js
ddplot
Create D3 based SVG graphics easily from R
Stars: ✭ 43 (-85.02%)
Mutual labels:  d3, dataviz, d3js
D3 Parliament
A parliament chart based on D3js
Stars: ✭ 44 (-84.67%)
Mutual labels:  dataviz, d3, d3js
Flask jsondash
🐍 📊 📈 Build complex dashboards without any front-end code. Use your own endpoints. JSON config only. Ready to go.
Stars: ✭ 3,215 (+1020.21%)
Mutual labels:  dataviz, charts, d3
Reaviz
📊 Data visualization library for React based on D3
Stars: ✭ 1,141 (+297.56%)
Mutual labels:  dataviz, charts, d3js
Reaviz
📊 Data visualization library for React based on D3
Stars: ✭ 215 (-25.09%)
Mutual labels:  charts, d3, d3js
d3-gridding
grids for rapid D3 charts mockups
Stars: ✭ 100 (-65.16%)
Mutual labels:  d3, dataviz, d3js
datalith
Simple, batteries included, components to build beautiful data visualizations
Stars: ✭ 29 (-89.9%)
Mutual labels:  d3, charts, dataviz
reusable-d3-charts
Reusable charts built with D3. Built on Web standards, fully customisable.
Stars: ✭ 33 (-88.5%)
Mutual labels:  d3, charts, dataviz
aws-mlu-explain
Visual, Interactive Articles About Machine Learning: https://mlu-explain.github.io/
Stars: ✭ 46 (-83.97%)
Mutual labels:  d3, dataviz
align covid
Coronavirus time series aligned by number of cases, not date.
Stars: ✭ 22 (-92.33%)
Mutual labels:  d3, d3js

Carbon Charts

Carbon Charts

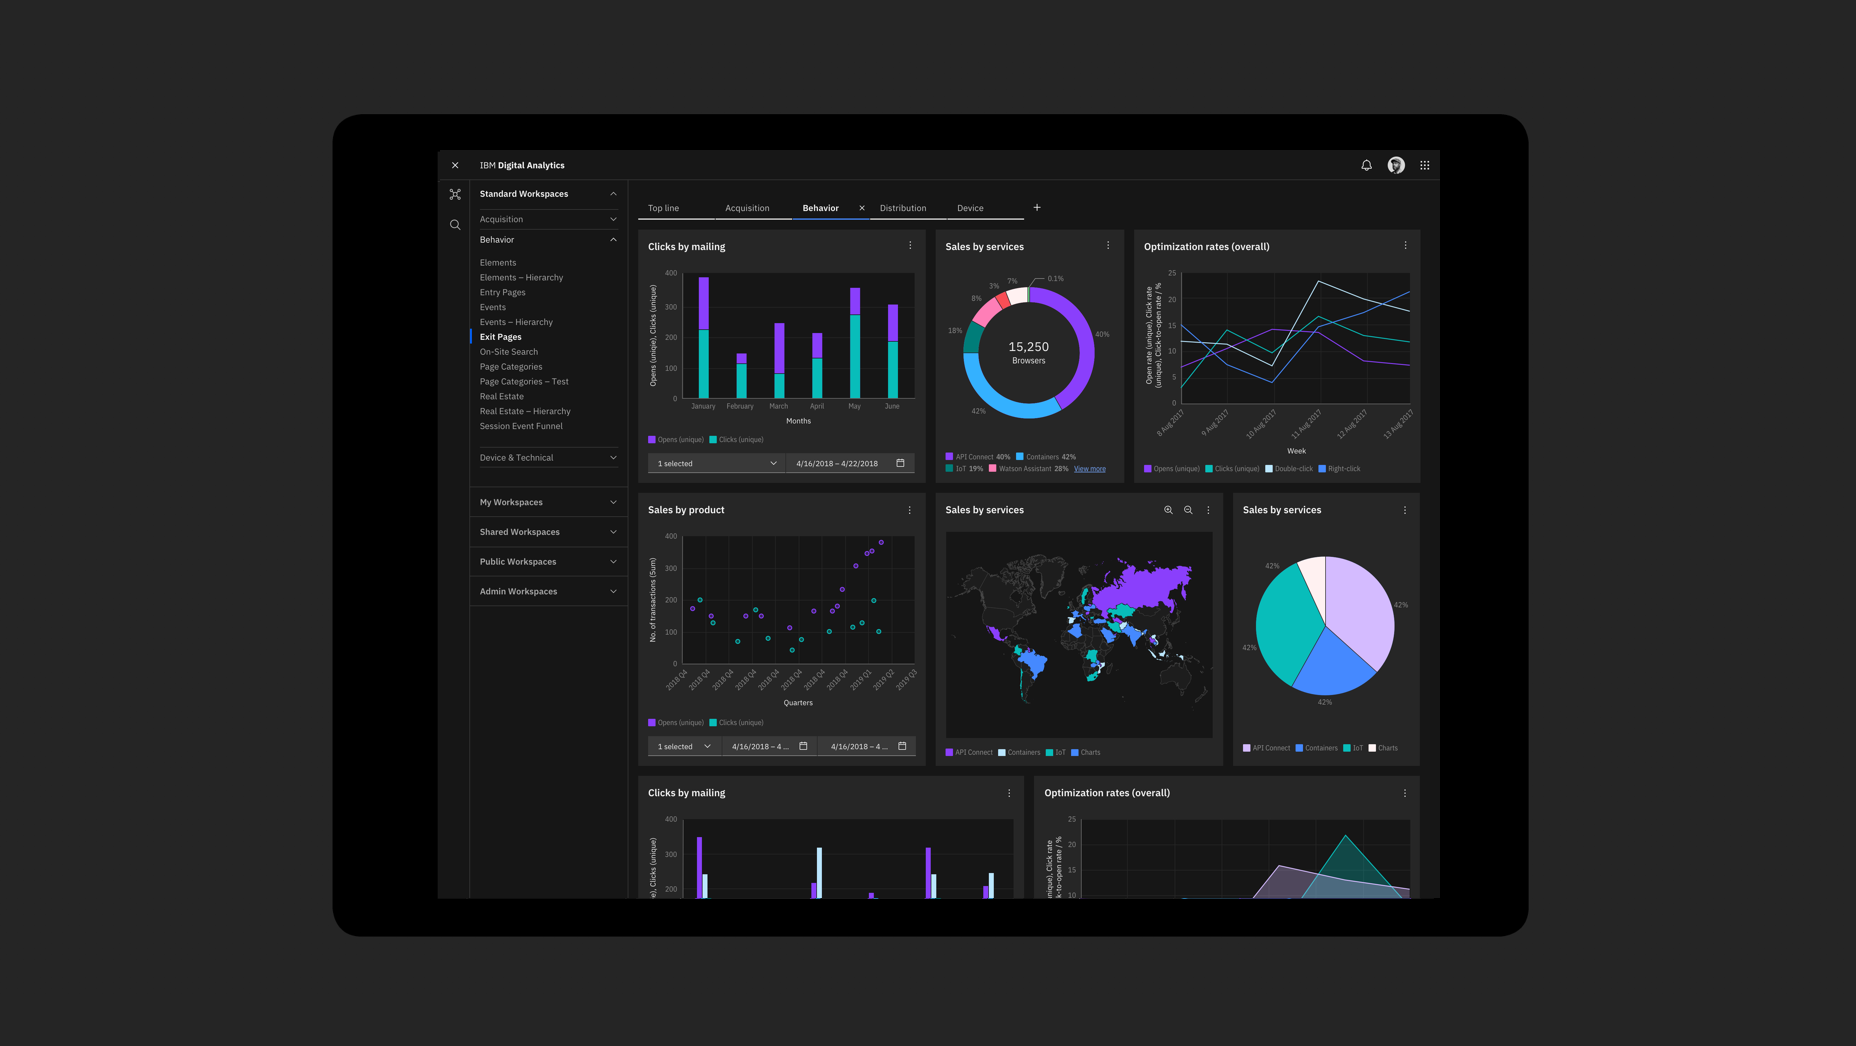
A reusable framework-agnostic D3 charting library.

semantic-versioning semantic-versioning

Packages

Design specifications

Carbon data visualization design specifications can be found here.

CHANGELOG

Read the release change logs here

Component status

✅ Stable ⏳ In progress

Component Vanilla Angular React Vue Svelte
Simple Bar
Grouped Bar
Stacked Bar
Donut
Line
Curved Line
Pie
Step
Scatter
Radar
Area
Gauge
Meter
Sparkline
Treemap
Combo

Bugs and feature requests

Have a bug or a feature request? First read the issue guidelines and search for existing and closed issues. If your problem or idea is not addressed yet, open a new issue.

Contributing

See our contributing guidelines. Included are instructions for opening issues, coding guidelines, and submitting pull requests.

Versioning

We use the semantic-release library to automatically version our releases within the guidelines of Semantic Versioning Semantic Versioning guidelines.

See our release change logs for the changelog of each version of Charts.

Core Team

Eliad Moosavi
Eliad Moosavi

💻 📖 💡 🚇
natashadecoste
natashadecoste

💻 📖 💡
Zvonimir Fras
Zvonimir Fras

💻 📖 👀
Callum Smith
Callum Smith

💻 📖 👀

Contributors

shixiedesign
shixiedesign

🎨
cameroncalder
cameroncalder

🎨
Diana Tran
Diana Tran

🎨 📖
nicoleroppel
nicoleroppel

🎨 📖
Scott Dickerson
scottdickerson

💻
ZrianinaMariia
ZrianinaMariia

💻
moores2
moores2

💻
stanislavgeorgiev
stanislavgeorgiev

💻
jendowns
jendowns

💻
Thomas Mullen
Thomas Mullen

💻
Jaime Stockton
Jaime Stockton

🎨 📖
Pablo Lopez Domowicz

🎨 📖
John Peng
John Peng

💻

Code of Conduct

Read our code of conduct here

Note that the project description data, including the texts, logos, images, and/or trademarks, for each open source project belongs to its rightful owner. If you wish to add or remove any projects, please contact us at [email protected].