All Projects → PatMartin → Dex

PatMartin / Dex

Licence: apache-2.0
Dex : The Data Explorer -- A data visualization tool written in Java/Groovy/JavaFX capable of powerful ETL and publishing web visualizations.

Programming Languages

javascript
184084 projects - #8 most used programming language
java
68154 projects - #9 most used programming language
groovy
2714 projects

Projects that are alternatives of or similar to Dex

leaflet heatmap
简单的可视化湖州通话数据 假设数据量很大,没法用浏览器直接绘制热力图,把绘制热力图这一步骤放到线下计算分析。使用Apache Spark并行计算数据之后,再使用Apache Spark绘制热力图,然后用leafletjs加载OpenStreetMap图层和热力图图层,以达到良好的交互效果。现在使用Apache Spark实现绘制,可能是Apache Spark不擅长这方面的计算或者是我没有设计好算法,并行计算的速度比不上单机计算。Apache Spark绘制热力图和计算代码在这 https://github.com/yuanzhaokang/ParallelizeHeatmap.git .
Stars: ✭ 13 (-98.95%)
Mutual labels:  d3, dataviz, data-analysis, d3js, datavisualization
Just Dashboard
📊 📋 Dashboards using YAML or JSON files
Stars: ✭ 1,511 (+22.05%)
Mutual labels:  data-science, data-visualization, d3, d3js
Data Science Resources
👨🏽‍🏫You can learn about what data science is and why it's important in today's modern world. Are you interested in data science?🔋
Stars: ✭ 171 (-86.19%)
Mutual labels:  data-science, data-analysis, data-mining, data-visualization
Deepgraph
Analyze Data with Pandas-based Networks. Documentation:
Stars: ✭ 232 (-81.26%)
Mutual labels:  data-science, data-analysis, data-mining, data-visualization
Model Describer
model-describer : Making machine learning interpretable to humans
Stars: ✭ 22 (-98.22%)
Mutual labels:  data-science, data-analysis, data-mining, data-visualization
Datascience
Curated list of Python resources for data science.
Stars: ✭ 3,051 (+146.45%)
Mutual labels:  data-science, data-analysis, data-mining, data-visualization
Amazing Feature Engineering
Feature engineering is the process of using domain knowledge to extract features from raw data via data mining techniques. These features can be used to improve the performance of machine learning algorithms. Feature engineering can be considered as applied machine learning itself.
Stars: ✭ 218 (-82.39%)
Mutual labels:  data-science, data-analysis, data-mining, data-visualization
Data Science With Ruby
Practical Data Science with Ruby based tools.
Stars: ✭ 549 (-55.65%)
Mutual labels:  data-science, data-analysis, data-mining, data-visualization
Pydataroad
open source for wechat-official-account (ID: PyDataLab)
Stars: ✭ 302 (-75.61%)
Mutual labels:  data-science, data-analysis, data-mining, data-visualization
Plotly Graphing Library For Matlab
Plotly Graphing Library for MATLAB®
Stars: ✭ 234 (-81.1%)
Mutual labels:  data-science, data-visualization, d3, d3js
Cookbook 2nd Code
Code of the IPython Cookbook, Second Edition, by Cyrille Rossant, Packt Publishing 2018 [read-only repository]
Stars: ✭ 541 (-56.3%)
Mutual labels:  data-science, data-analysis, data-mining, data-visualization
Cookbook 2nd
IPython Cookbook, Second Edition, by Cyrille Rossant, Packt Publishing 2018
Stars: ✭ 704 (-43.13%)
Mutual labels:  data-science, data-analysis, data-mining, data-visualization
Dataflowjavasdk
Google Cloud Dataflow provides a simple, powerful model for building both batch and streaming parallel data processing pipelines.
Stars: ✭ 854 (-31.02%)
Mutual labels:  data-science, data-analysis, data-mining
Socrat
A Dynamic Web Toolbox for Interactive Data Processing, Analysis, and Visualization
Stars: ✭ 26 (-97.9%)
Mutual labels:  data-science, data-analysis, data-visualization
Awesome Business Intelligence
Actively curated list of awesome BI tools. PRs welcome!
Stars: ✭ 1,157 (-6.54%)
Mutual labels:  data-science, data-analysis, data-visualization
Data Science On Gcp
Source code accompanying book: Data Science on the Google Cloud Platform, Valliappa Lakshmanan, O'Reilly 2017
Stars: ✭ 864 (-30.21%)
Mutual labels:  data-science, data-analysis, data-visualization
Vectorbt
Ultimate Python library for time series analysis and backtesting at scale
Stars: ✭ 855 (-30.94%)
Mutual labels:  data-analysis, data-mining, data-visualization
My Journey In The Data Science World
📢 Ready to learn or review your knowledge!
Stars: ✭ 1,175 (-5.09%)
Mutual labels:  data-science, data-analysis, data-visualization
D3 Parliament
A parliament chart based on D3js
Stars: ✭ 44 (-96.45%)
Mutual labels:  dataviz, d3, d3js
Data Science Lunch And Learn
Resources for weekly Data Science Lunch & Learns
Stars: ✭ 49 (-96.04%)
Mutual labels:  data-science, data-analysis, data-visualization

Dex

Dex : The data explorer is a powerful tool for data science. It is written in Groovy and Java on top of JavaFX and offers the ability to:

  • Read in data from a variety of sources such files, programs and a variety of databases.
  • Transform the data in a powerful ways.
  • Apply powerful machine learning to the data via SMILE and R integration.
  • Visualize the data in over 50 distinct ways.
  • Output the data to a variety of databases and file formats.
  • Extend Dex from within via templates and internal scripting. Save the extensions to reuse later.

Other Resources

Requirements

  • Java 8

Installation

There are 2 main ways to install Dex.

  1. Install via Git by following the instructions below.
  2. Download a stable release

The packaged release tends to lag significantly behind the Git version.

Via Git

Download:

git clone https://github.com/PatMartin/Dex.git

Run

cd Dex
java -jar Dex.jar

Example Visualizations

The following are a small sample of the 50+ data visualizations Dex is capable of generating.
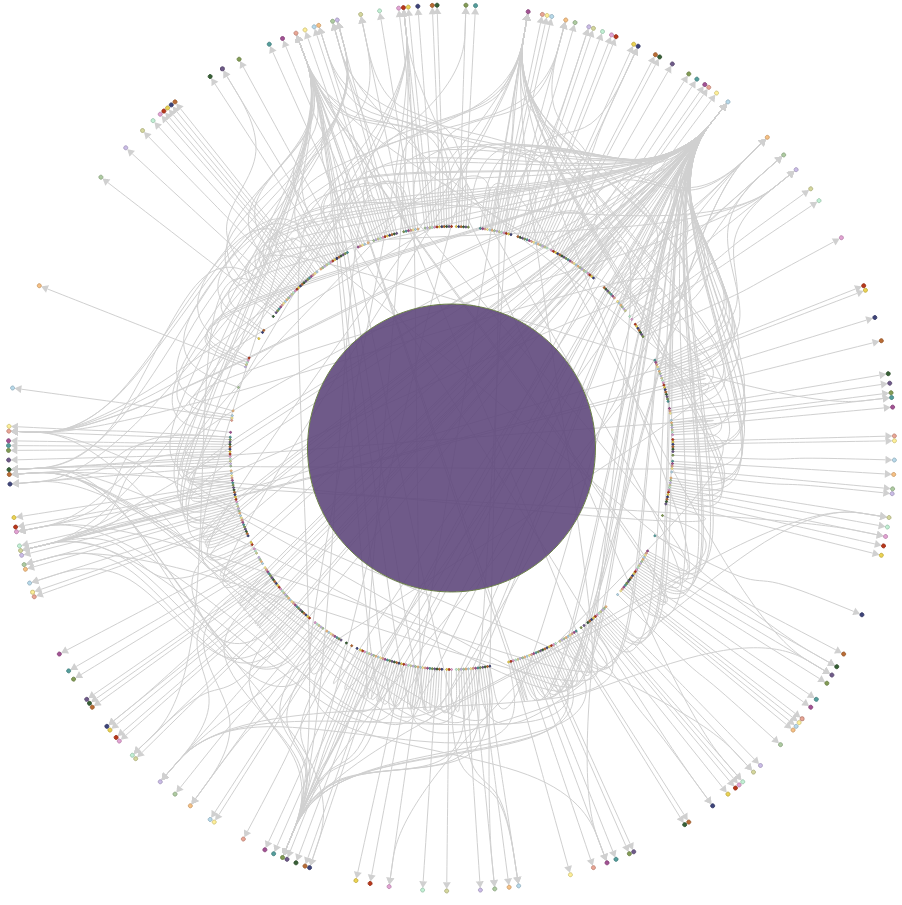
Ring Network

This visualization was created with Dex to visualize the relationships between Dr Who villans and motivations.
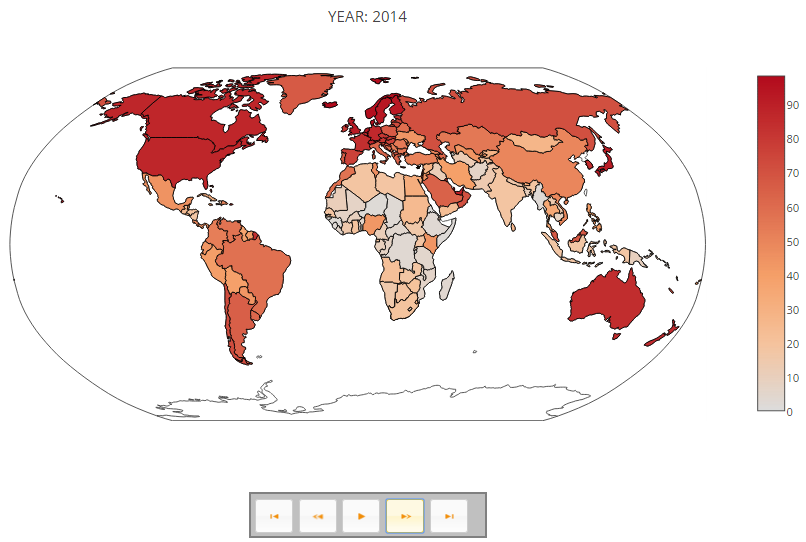
Maps

This visualization was created with Dex to visualize internet use across the world over the past 20 years.
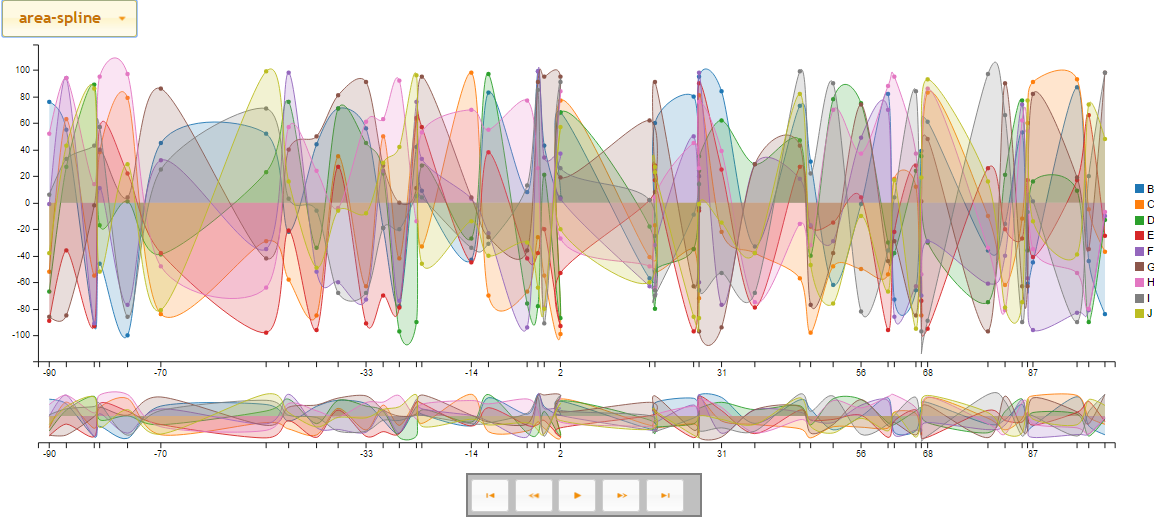
Time Visualizations

This visualization depicts a small series over time.

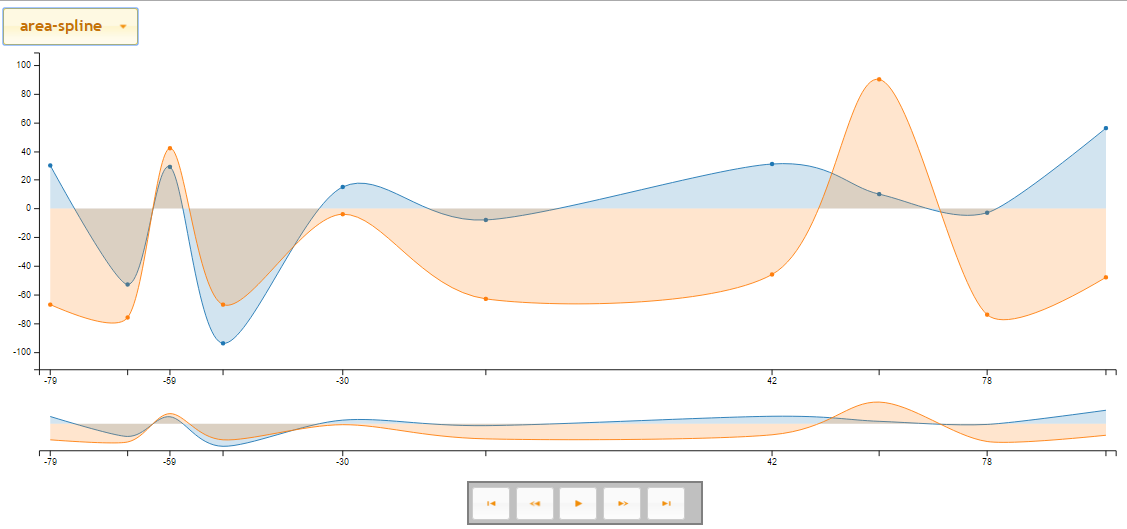
This visualization depicts a more complex series over time.

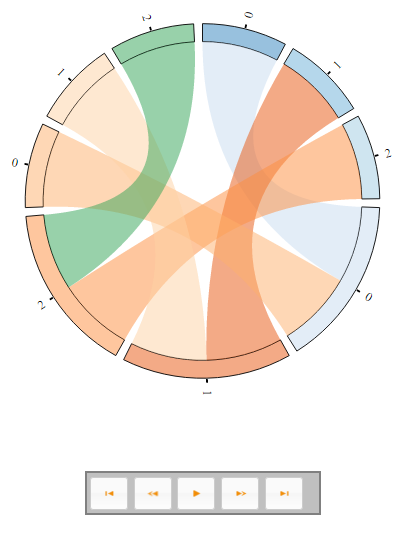
Chord Visualizations

This visualization depicts relationships via a Chord diagram over time.
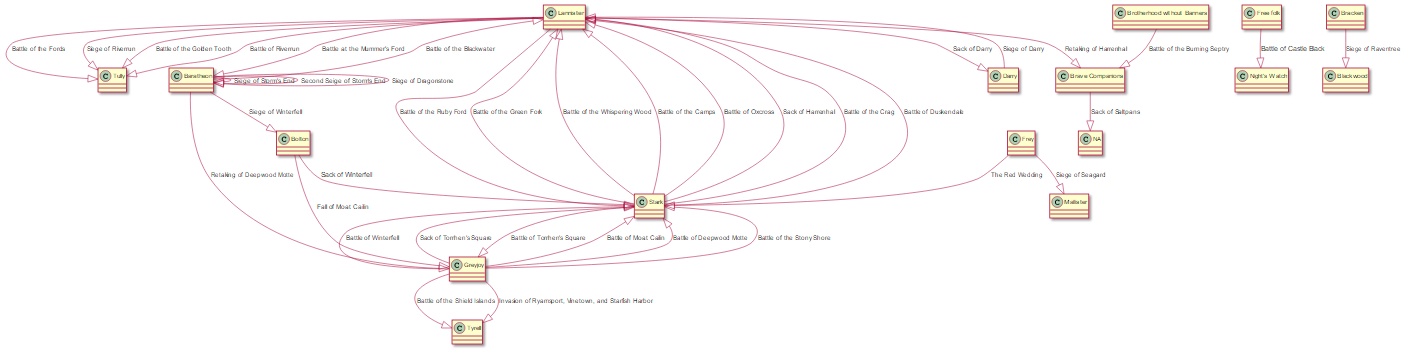
UML Visualizations

A Class Diagram of the various battles within the Game of Thrones.

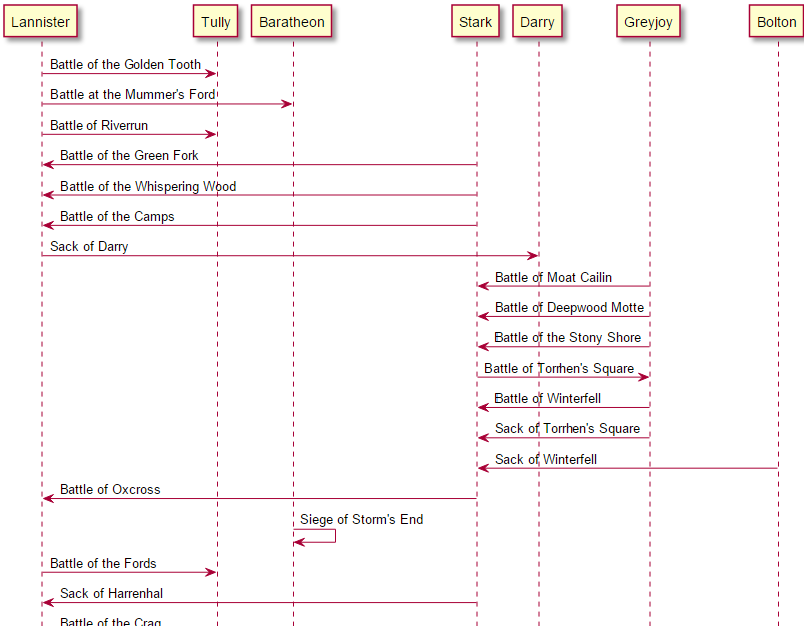
A Sequence Diagram of the various battles within the Game of Thrones.

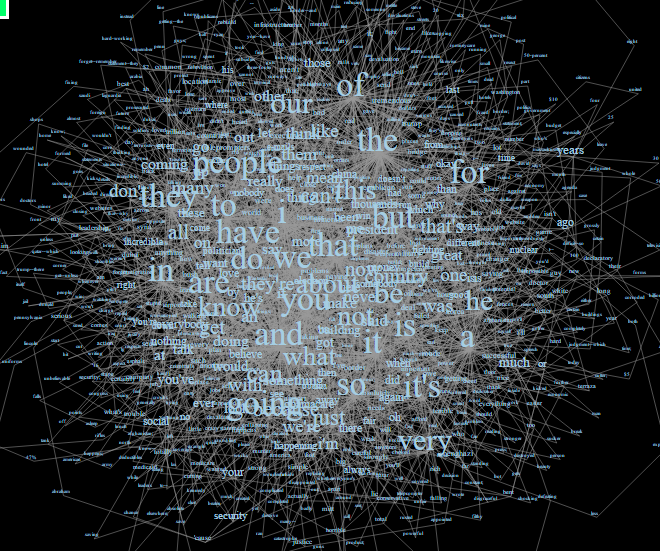
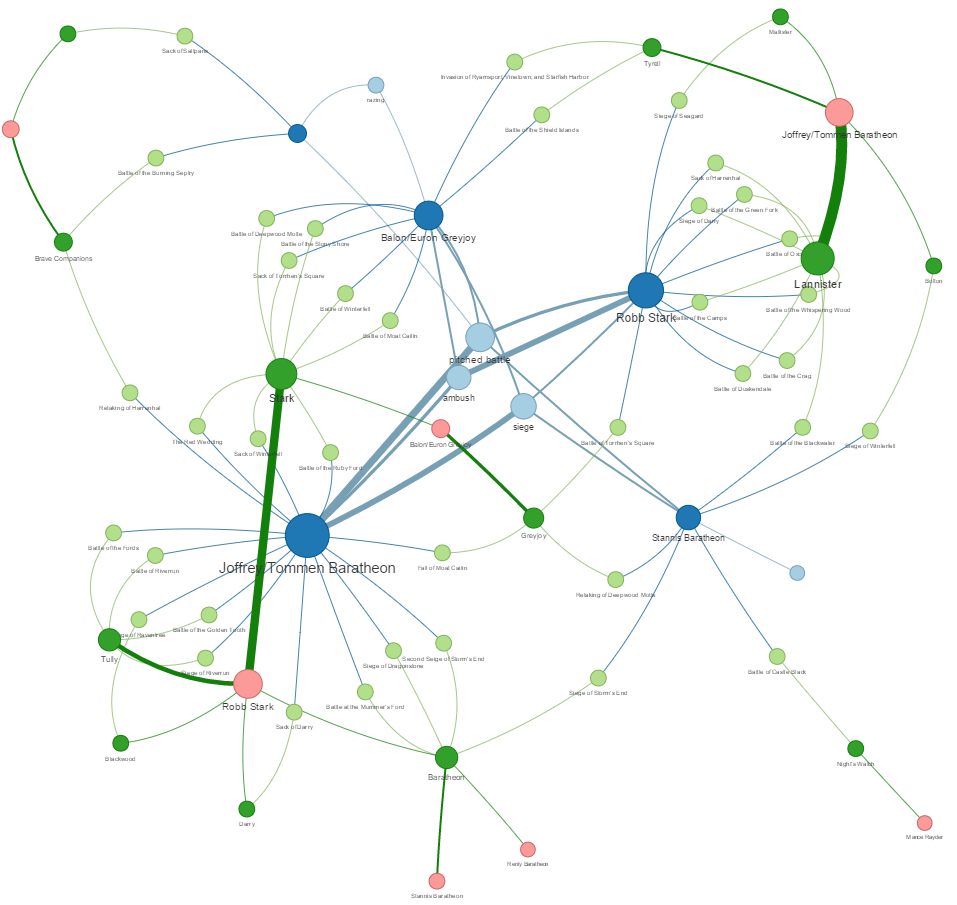
Network Visualizations

A large network comprised of every word spoken by Donald trump connected by the next word within the Iowa speech. This network visualization is founded on the high performance VivaGraph.

A vis.js visualization of the battles between the various houses within the Game of Thrones.
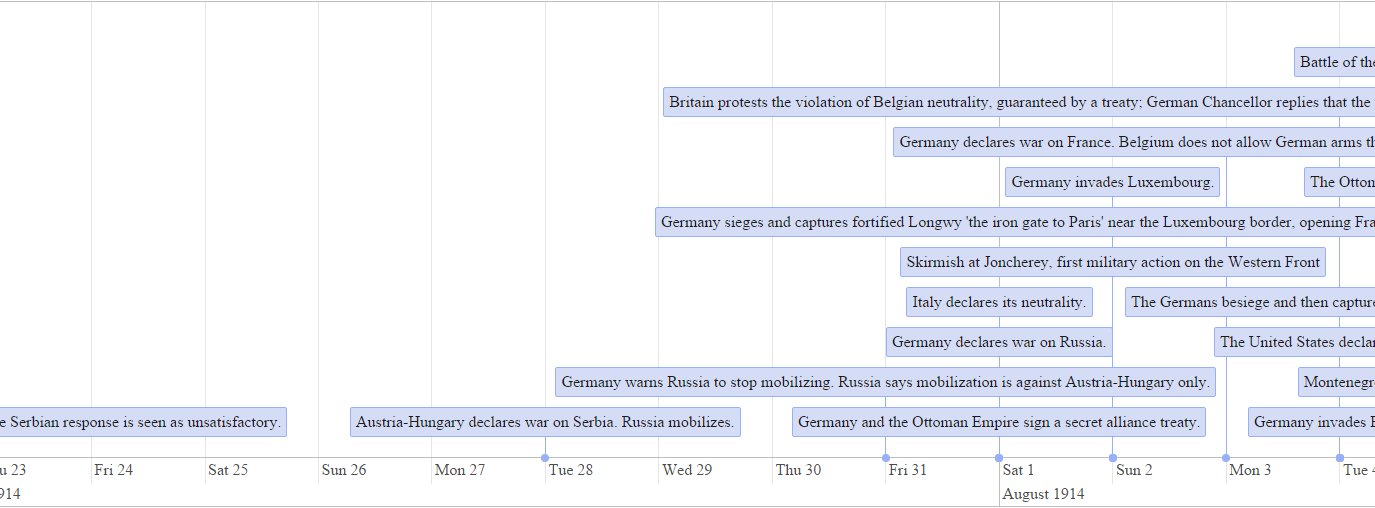
Timelines

A vis.js timeline visualization of the sequence of events that lead up to, and occurred during World War I.
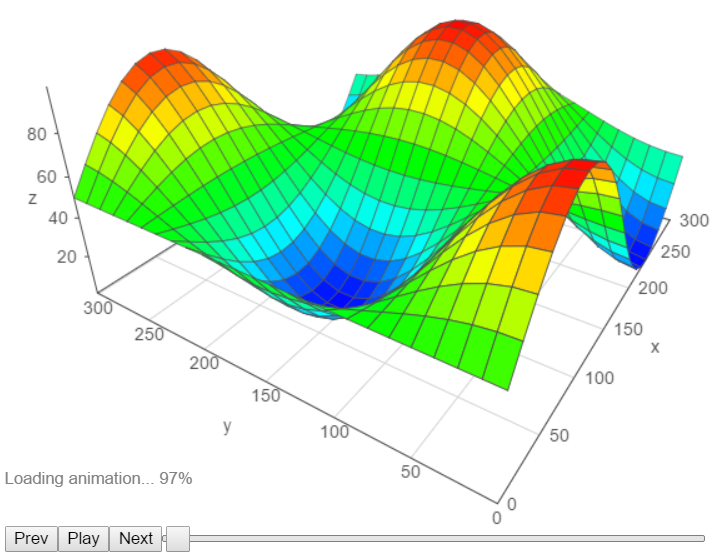
3D Graphs

A 3D graph of some data generated via Dex using a vis.js visual.

Note that the project description data, including the texts, logos, images, and/or trademarks, for each open source project belongs to its rightful owner. If you wish to add or remove any projects, please contact us at [email protected].