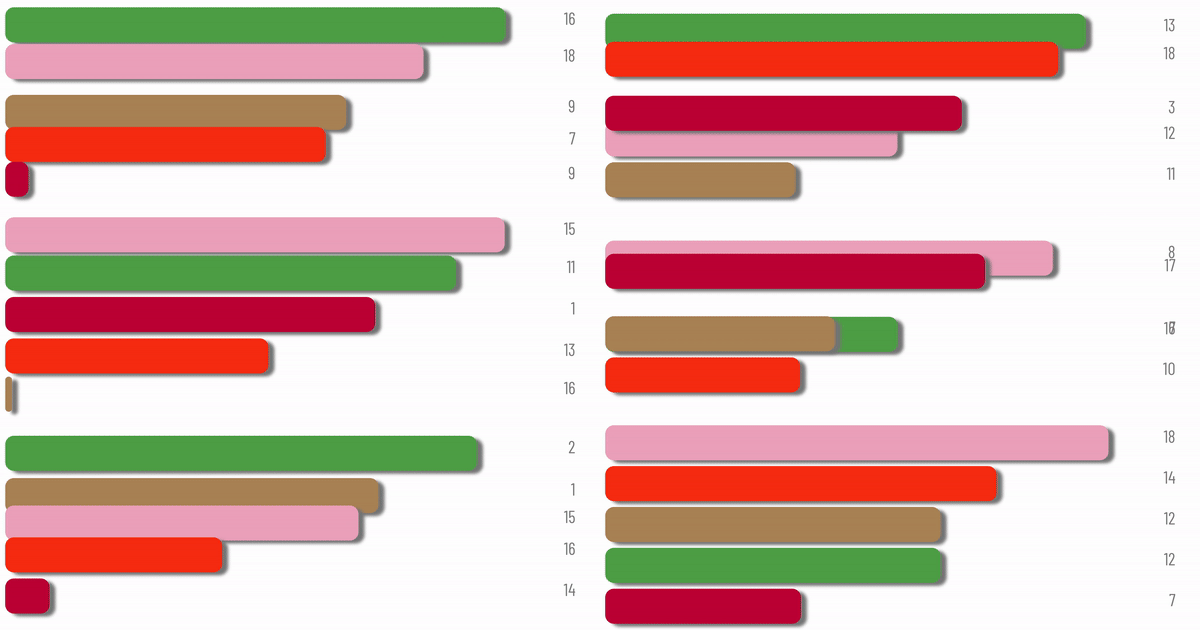
bchao1 / Chart Race React
Licence: mit
📊 Seamless bar chart race component for React.
Stars: ✭ 406
Programming Languages
javascript
184084 projects - #8 most used programming language
Projects that are alternatives of or similar to Chart Race React
Uiw
⚛️ @uiwjs A high quality UI Toolkit, A Component Library for React 16+.
Stars: ✭ 531 (+30.79%)
Mutual labels: ui-components, react-component, frontend
Base
React-UI-Kit - frontend library with ReactJS components
Stars: ✭ 18 (-95.57%)
Mutual labels: ui-components, react-component, frontend
React Multi Select
A Multi Select component built with and for React
Stars: ✭ 111 (-72.66%)
Mutual labels: ui-components, react-component, frontend
light-ui
A lightly React UI library
Stars: ✭ 38 (-90.64%)
Mutual labels: react-component, ui-components
Reaviz
📊 Data visualization library for React based on D3
Stars: ✭ 215 (-47.04%)
Mutual labels: data-visualization, chart
Tablesaw
Java dataframe and visualization library
Stars: ✭ 2,785 (+585.96%)
Mutual labels: data-visualization, chart
Ej2 Angular Ui Components
Syncfusion Angular UI components library offer more than 50+ cross-browser, responsive, and lightweight angular UI controls for building modern web applications.
Stars: ✭ 159 (-60.84%)
Mutual labels: data-visualization, ui-components
Awesome Dataviz
📈 A curated list of awesome data visualization libraries and resources.
Stars: ✭ 2,905 (+615.52%)
Mutual labels: data-visualization, chart
Datagear
数据可视化分析平台,使用Java语言开发,采用浏览器/服务器架构,支持SQL、CSV、Excel、HTTP接口、JSON等多种数据源
Stars: ✭ 266 (-34.48%)
Mutual labels: data-visualization, chart
Oruga
🐛 Oruga is a lightweight library of UI components without CSS framework dependency
Stars: ✭ 297 (-26.85%)
Mutual labels: ui-components, frontend
Gradio
Create UIs for your machine learning model in Python in 3 minutes
Stars: ✭ 4,358 (+973.4%)
Mutual labels: data-visualization, ui-components
Visx
🐯 visx | visualization components
Stars: ✭ 14,544 (+3482.27%)
Mutual labels: data-visualization, chart
Clchart
A fast, simple and cross-platform(html5 react-native weex wechat-applet) stock chart library created using canvas.
Stars: ✭ 250 (-38.42%)
Mutual labels: data-visualization, chart
Graphic
A Flutter data visualization library based on Grammar of Graphics.
Stars: ✭ 173 (-57.39%)
Mutual labels: data-visualization, chart
Ej2 Javascript Ui Controls
Syncfusion JavaScript UI controls library offer more than 50+ cross-browser, responsive, and lightweight HTML5 UI controls for building modern web applications.
Stars: ✭ 256 (-36.95%)
Mutual labels: data-visualization, ui-components
Metatron Discovery
Powerful & Easy way for big data discovery
Stars: ✭ 297 (-26.85%)
Mutual labels: data-visualization, chart
Uix Kit
A free UI toolkit based on some common libraries for building beautiful responsive website, compatible with Bootstrap v4.
Stars: ✭ 318 (-21.67%)
Mutual labels: ui-components, frontend
React Vis Force
d3-force graphs as React Components.
Stars: ✭ 372 (-8.37%)
Mutual labels: data-visualization, chart
Sunburst Chart
A sunburst interactive chart web component for visualizing hierarchical data
Stars: ✭ 140 (-65.52%)
Mutual labels: data-visualization, chart
chart-race-react
📊 Seamless & fully customizable bar chart race component for React.
| Colors | |||
| Style | |||
| Speed | |||
Quick Start
npm install --save chart-race-react
import BarChart from 'chart-race-react';
You should wrap BarChart inside a container div that acts as a sandbox. The width of the BarChart fits the container width.
<div style={{width: "500px"}}>
    <BarChart />
</div>
Usage
Passing props.
You will need to pass your own props to the BarChart component. Refer to examples for more information.
| Prop | Type | Explanation |
|---|---|---|
| start | Boolean | Defines whether the bar chart race has started. Default is true and the chart race will start as the component mounts. |
| data | Object | An object with keys being the data field name and value being Array data. data[key].length should be equal to len. |
| timeline | Array | An array defining the time indices. Length should be equal to len. |
| labels | Object | An object with keys being the data field name and value being a HTML element that acts as the data field's label. |
| colors | Object | An object with keys being the data field name and value being the color the data bar. |
| timeout | Integer | Transition time between adjacent time indices (in ms). |
| delay | Integer | Waiting time between adjacent time indices (in ms). |
| timelineStyle | Object | CSS style objects for time indices. |
| textBoxStyle | Object | CSS style objects for data text. |
| barStyle | Object | CSS style object defining the style of all the bars. It is advised to use height to define the thickness and marginTop to define the distance between adjacent bars. |
| width | Array | Defines the width allocation for label, bar, and text box. Values in width should add up to 100. |
| maxItems | Integer | Defines the maximum number of items to show in the chart. Should be less or equal to Object.keys(data).length. |
More Demo
Easibly define custom data, text styles, colors, duration, and layout.
Add images to data labels.
Plugin your own data.
Note that the project description data, including the texts, logos, images, and/or trademarks,
for each open source project belongs to its rightful owner.
If you wish to add or remove any projects, please contact us at [email protected].

