All Projects → marianogappa → Chart

marianogappa / Chart

Licence: mit
Quick & smart charting for STDIN

Programming Languages

go
31211 projects - #10 most used programming language

Projects that are alternatives of or similar to Chart

Chartkick.py
Create beautiful Javascript charts with minimal code
Stars: ✭ 695 (+33.4%)
Mutual labels:  chart, charting-library, chartjs
React Jsx Highcharts
Highcharts built with proper React components
Stars: ✭ 336 (-35.51%)
Mutual labels:  chart, graphs, charting-library
Django Jchart
📈 A Django package for plotting charts using the excellent Chart.JS library.
Stars: ✭ 115 (-77.93%)
Mutual labels:  chart, charting-library, chartjs
React Chartjs 2
React components for Chart.js, the most popular charting library
Stars: ✭ 4,667 (+795.78%)
Mutual labels:  chart, charting-library, chartjs
Timeline Plus
Timeline - chronological visualization of your data
Stars: ✭ 140 (-73.13%)
Mutual labels:  chart, graphs, charting-library
ipychart
The power of Chart.js with Python
Stars: ✭ 48 (-90.79%)
Mutual labels:  charting-library, chartjs
SwiftCharts
Easy to use and highly customizable charts library for iOS
Stars: ✭ 2,405 (+361.61%)
Mutual labels:  chart, graphs
HCLineChartView
HCLineChartView is a beautiful iOS library for drawing line charts. It is highly customizable and easy to use.
Stars: ✭ 22 (-95.78%)
Mutual labels:  chart, charting-library
Chartjs Chart Financial
Chart.js module for charting financial securities
Stars: ✭ 469 (-9.98%)
Mutual labels:  chart, charting-library
Chart.js-Rounded-Bar-Charts
Rounded Rectangles in Bar Charts
Stars: ✭ 48 (-90.79%)
Mutual labels:  chart, chartjs
asciichart-sharp
C# port of asciichart
Stars: ✭ 27 (-94.82%)
Mutual labels:  chart, charting-library
Go Chart
go chart is a basic charting library in go.
Stars: ✭ 3,254 (+524.57%)
Mutual labels:  chart, charting-library
Mermaid
Provides a parser function to generate diagrams and flowcharts with the help of the mermaid script language
Stars: ✭ 27 (-94.82%)
Mutual labels:  chart, graphs
chartjs-chart-graph
Chart.js Graph-like Charts (tree, force directed)
Stars: ✭ 103 (-80.23%)
Mutual labels:  graphs, chartjs
live-chart
A real-time charting library for Vala and GTK3 based on Cairo
Stars: ✭ 47 (-90.98%)
Mutual labels:  chart, charting-library
chartjs-chart-timeline
Google-like timeline chart for Chart.js.
Stars: ✭ 44 (-91.55%)
Mutual labels:  chart, chartjs
Plottable
📊 A library of modular chart components built on D3
Stars: ✭ 2,834 (+443.95%)
Mutual labels:  chart, charting-library
Vue Chartjs
📊 Vue.js wrapper for Chart.js
Stars: ✭ 4,554 (+774.09%)
Mutual labels:  chart, chartjs
Aachartkit
📈📊🚀🚀🚀An elegant modern declarative data visualization chart framework for iOS, iPadOS and macOS. Extremely powerful, supports line, spline, area, areaspline, column, bar, pie, scatter, angular gauges, arearange, areasplinerange, columnrange, bubble, box plot, error bars, funnel, waterfall and polar chart types. 极其精美而又强大的跨平台数据可视化图表框架,支持柱状图、条形图、折…
Stars: ✭ 4,358 (+736.47%)
Mutual labels:  chart, charting-library
chart
📊📉 Add beautiful and reusable charts with one line of ruby for Rails 5.x
Stars: ✭ 42 (-91.94%)
Mutual labels:  chart, chartjs

chart Build Status Coverage Status GitHub license Go Report Card

Quick & smart charting for STDIN

Blogpost

Chart example use

Learn by example!

Cheatsheet

Syntax

chart [options]
  • pie: render a pie chart
  • bar: render a bar chart
  • line: render a line chart
  • scatter: render a scatter plot chart
  • log: use logarithmic scale (bar chart only)
  • legacy-color: use legacy colors
  • gradient: use color gradients
  • ' '|';'|','|'\t': this character separates columns on each line (\t = default)
  • -t|--title: title for the chart
  • -x: label for the x axis
  • -y: label for the y axis
  • --date-format: Sets the date format, according to https://golang.org/src/time/format.go
  • --debug: Use to make sure to double-check the chart is showing what you expect.
  • -h|--help: Show help
  • --zero-based: Makes y-axis begin at zero

Installation

go get -u github.com/marianogappa/chart

or get the latest binary for your OS in the Releases section.

Example use cases

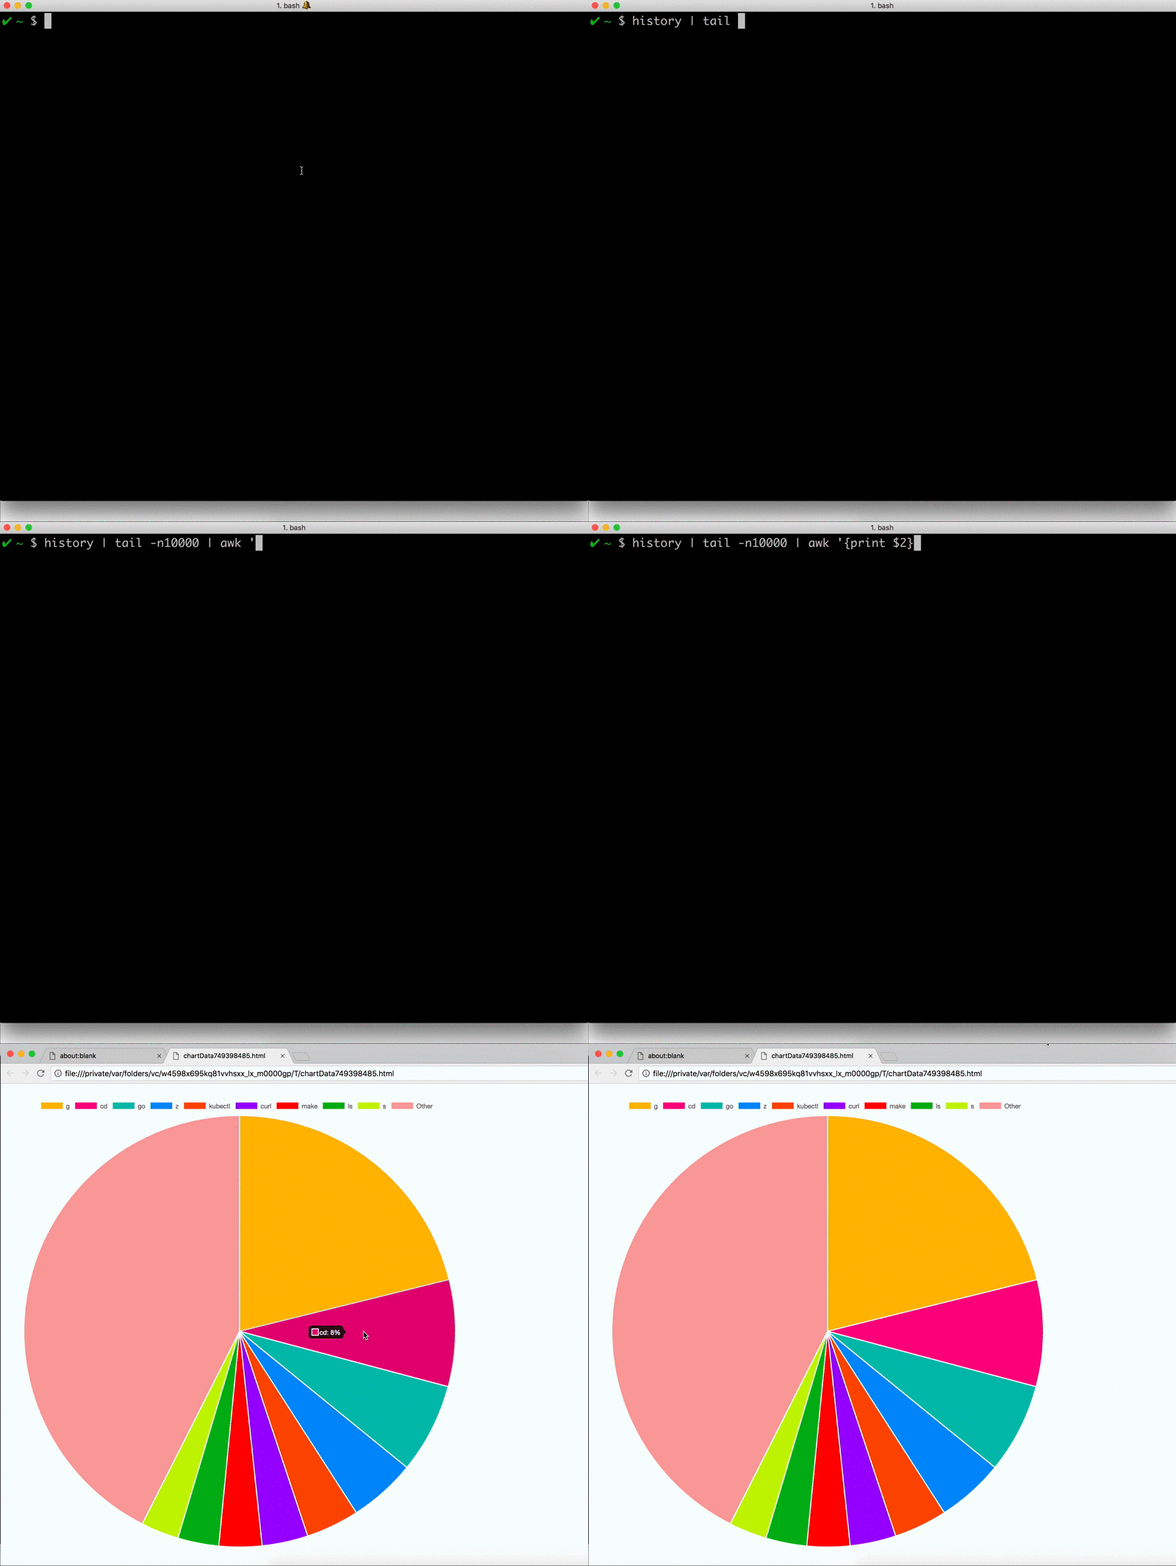
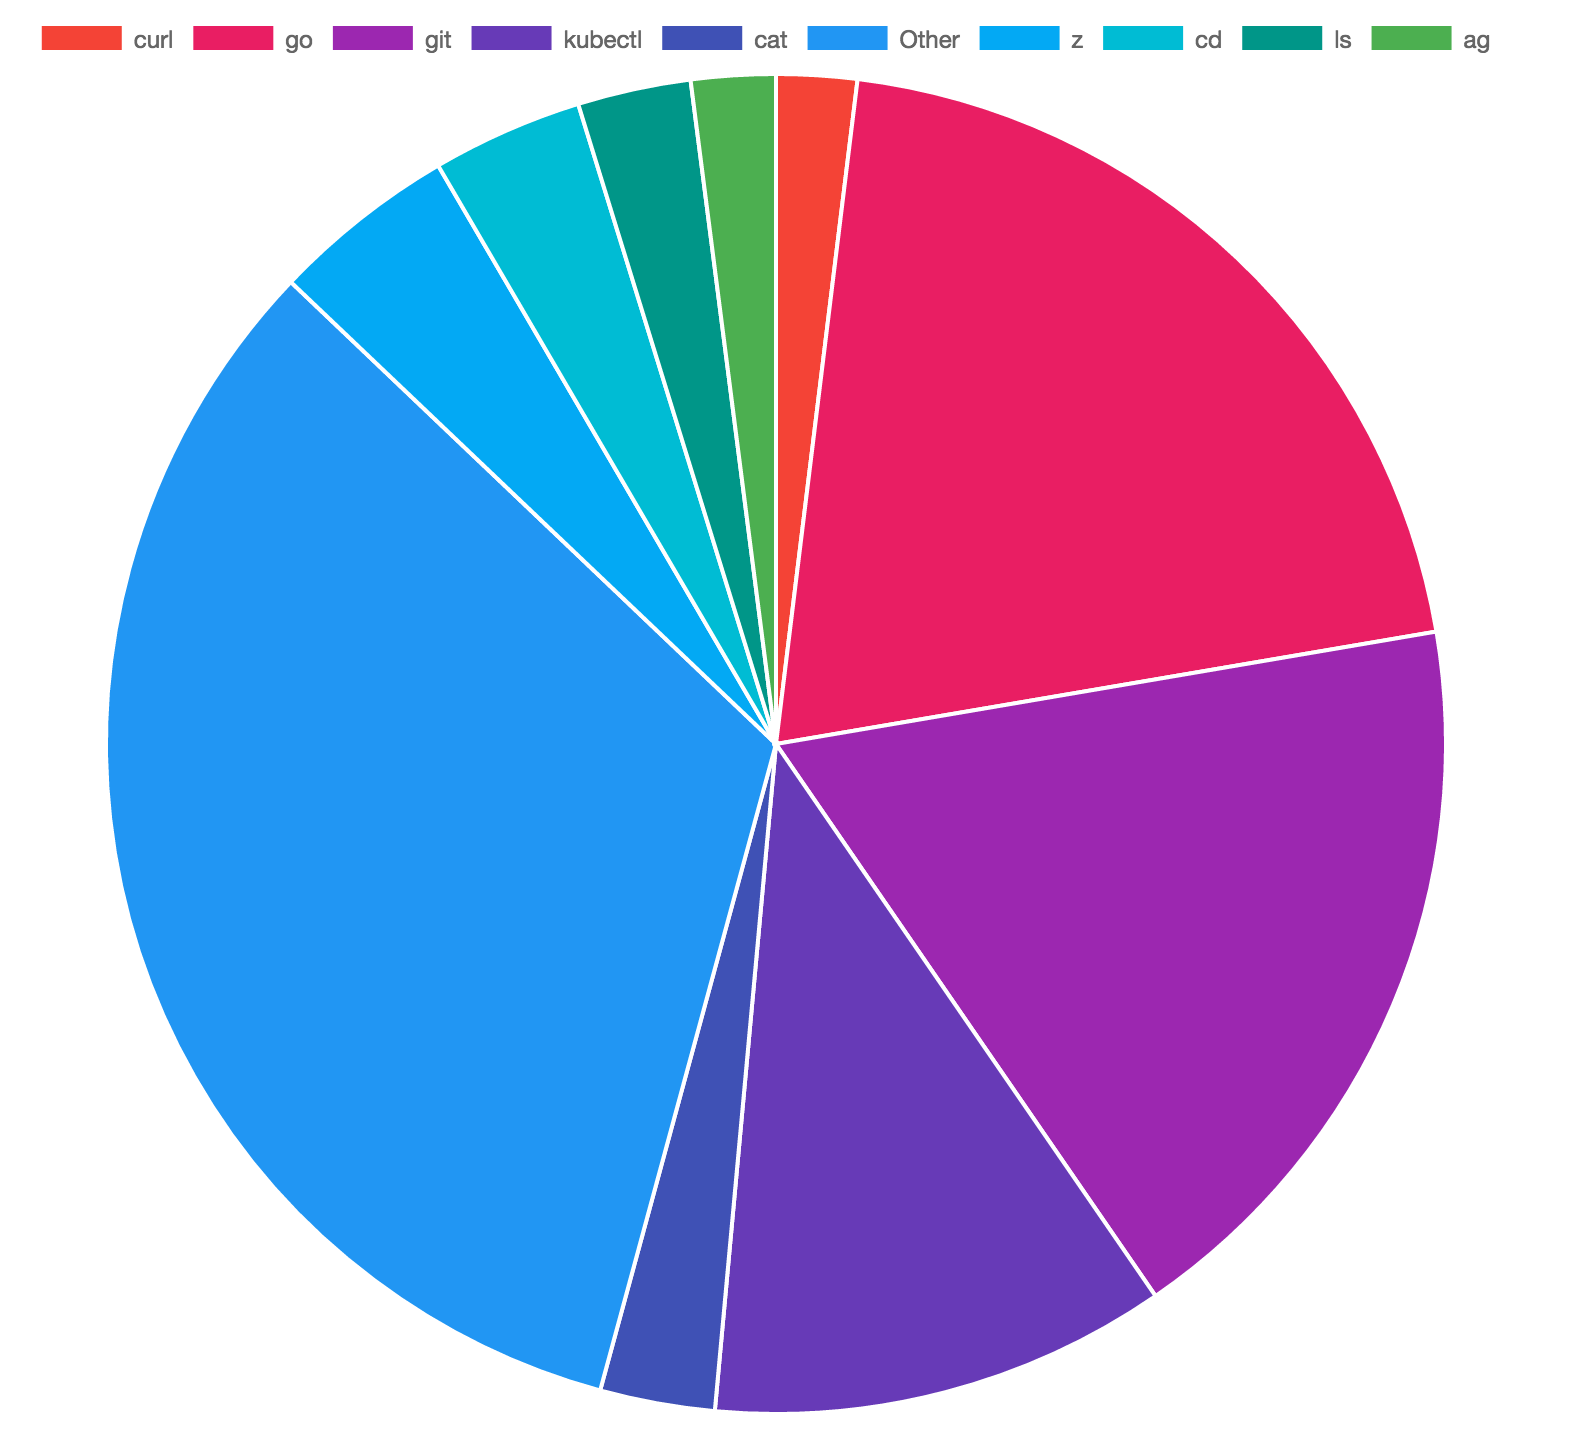
  • Pie chart of your most used terminal commands
history | awk '{print $2}' | chart

Pie chart of your most used terminal commands

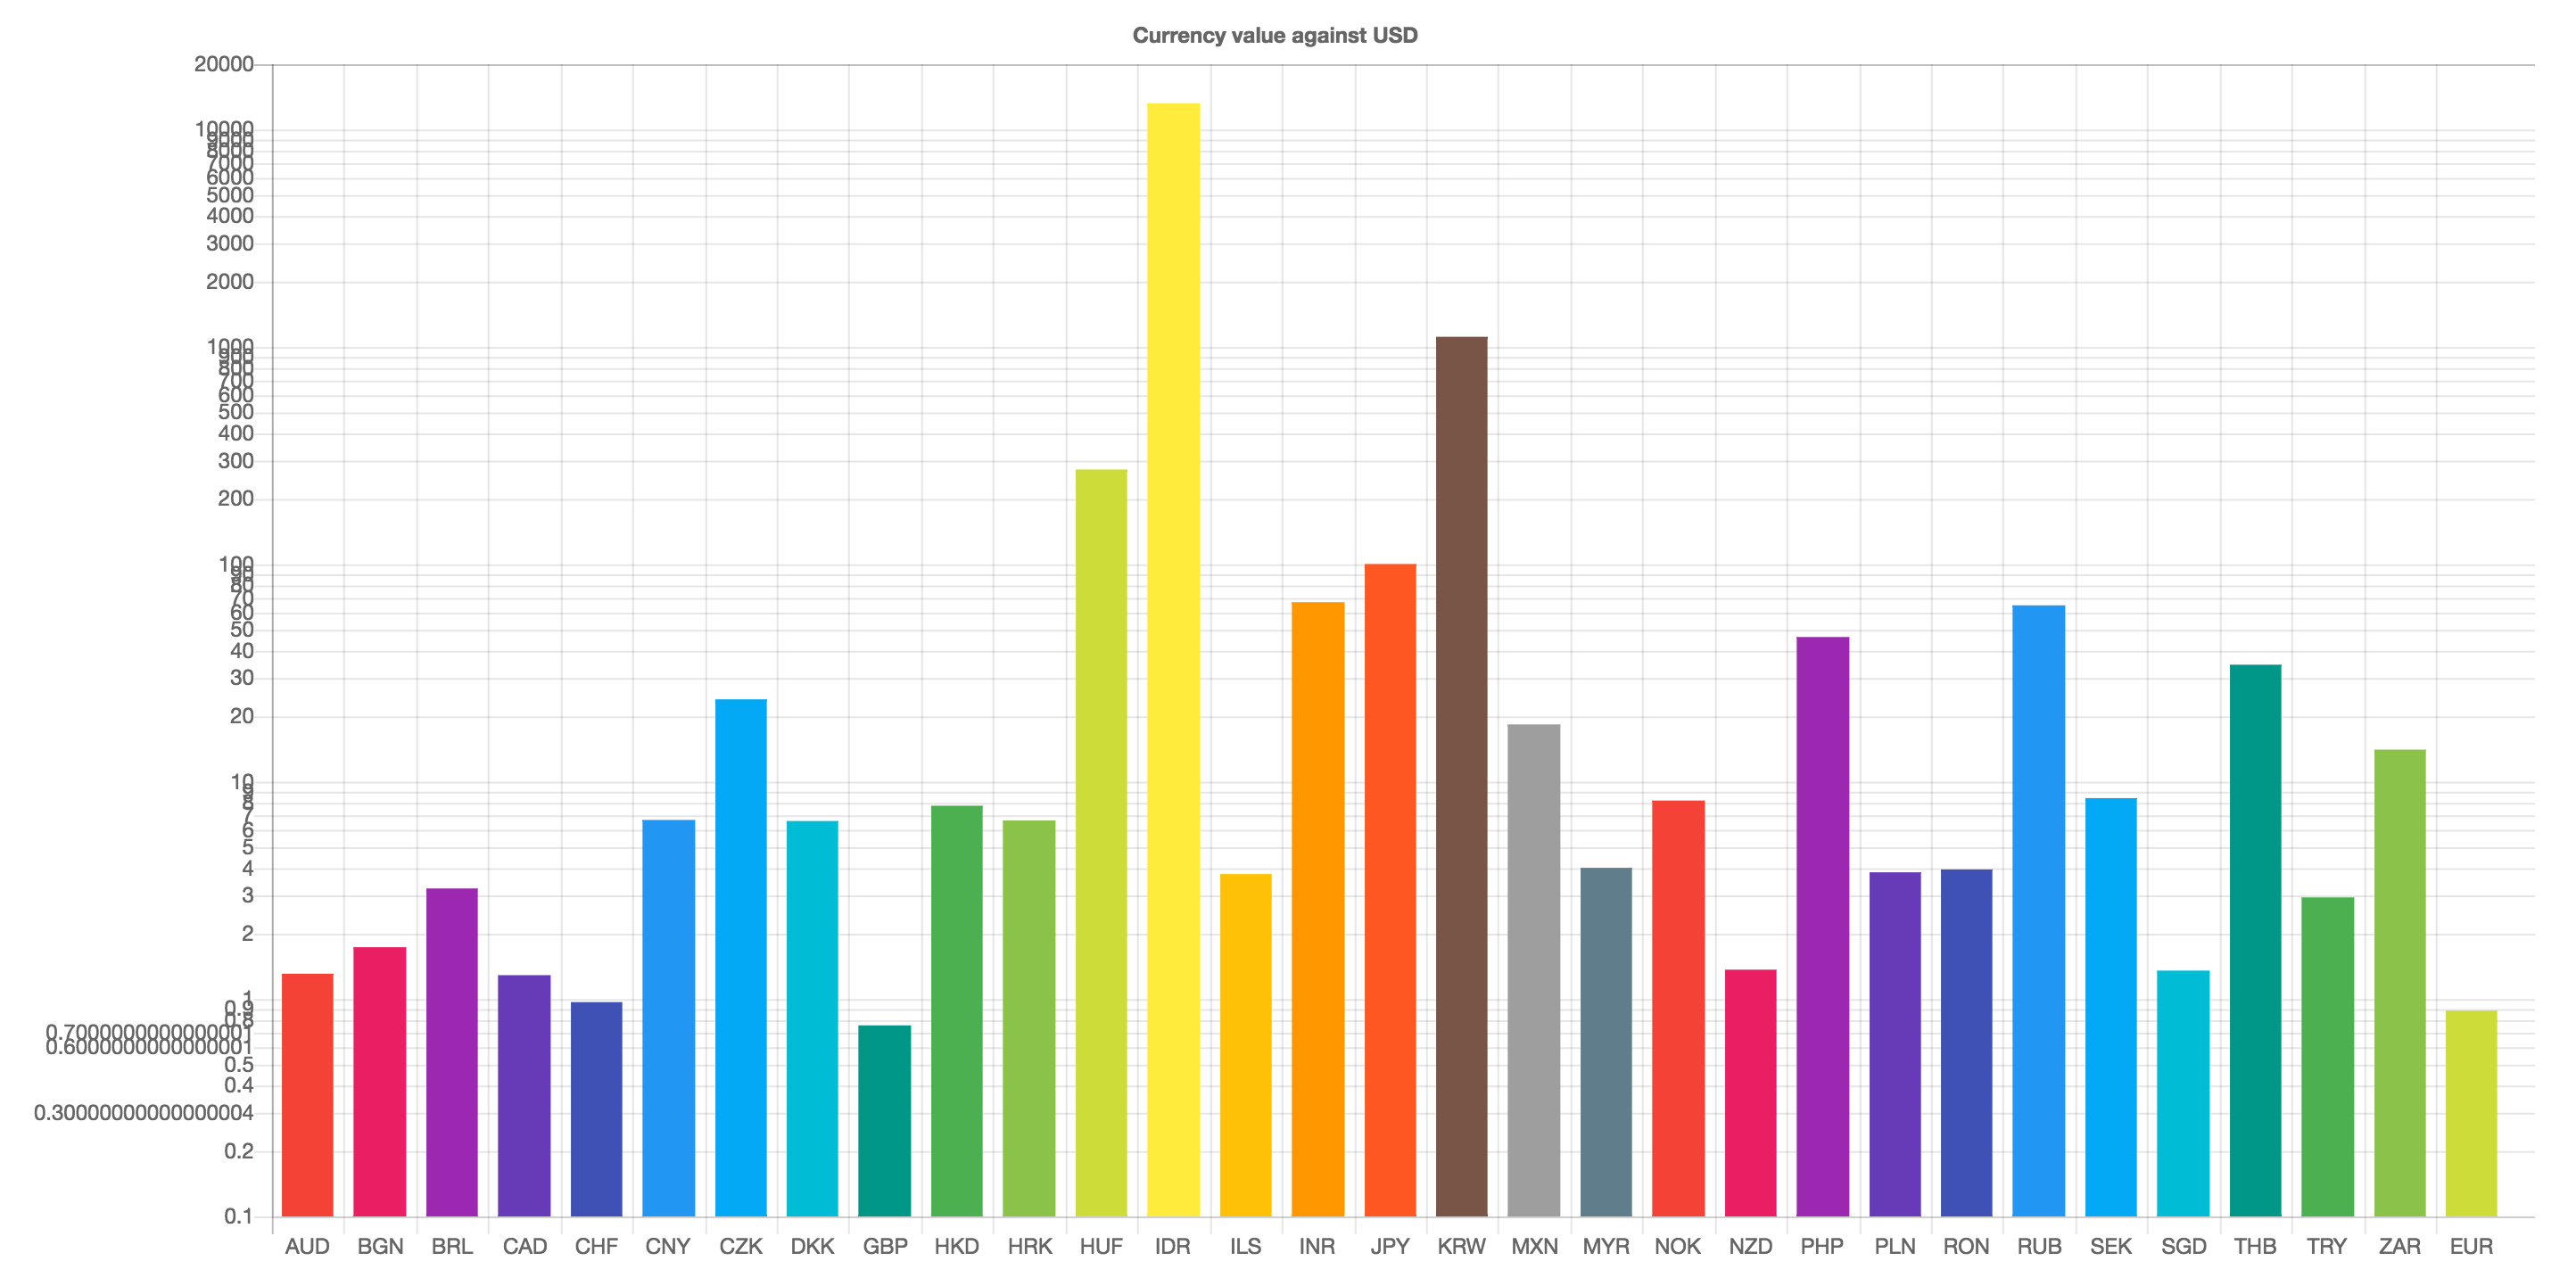
  • Bar chart of today's currency value against USD, in logarithmic scale
curl -s http://api.fixer.io/latest?base=USD | jq -r ".rates | to_entries| \
    map(\"\(.key)\t\(.value|tostring)\")|.[]" | chart bar log -t "Currency value against USD"

Bar chart of today's currency value against USD, in logarithmic scale

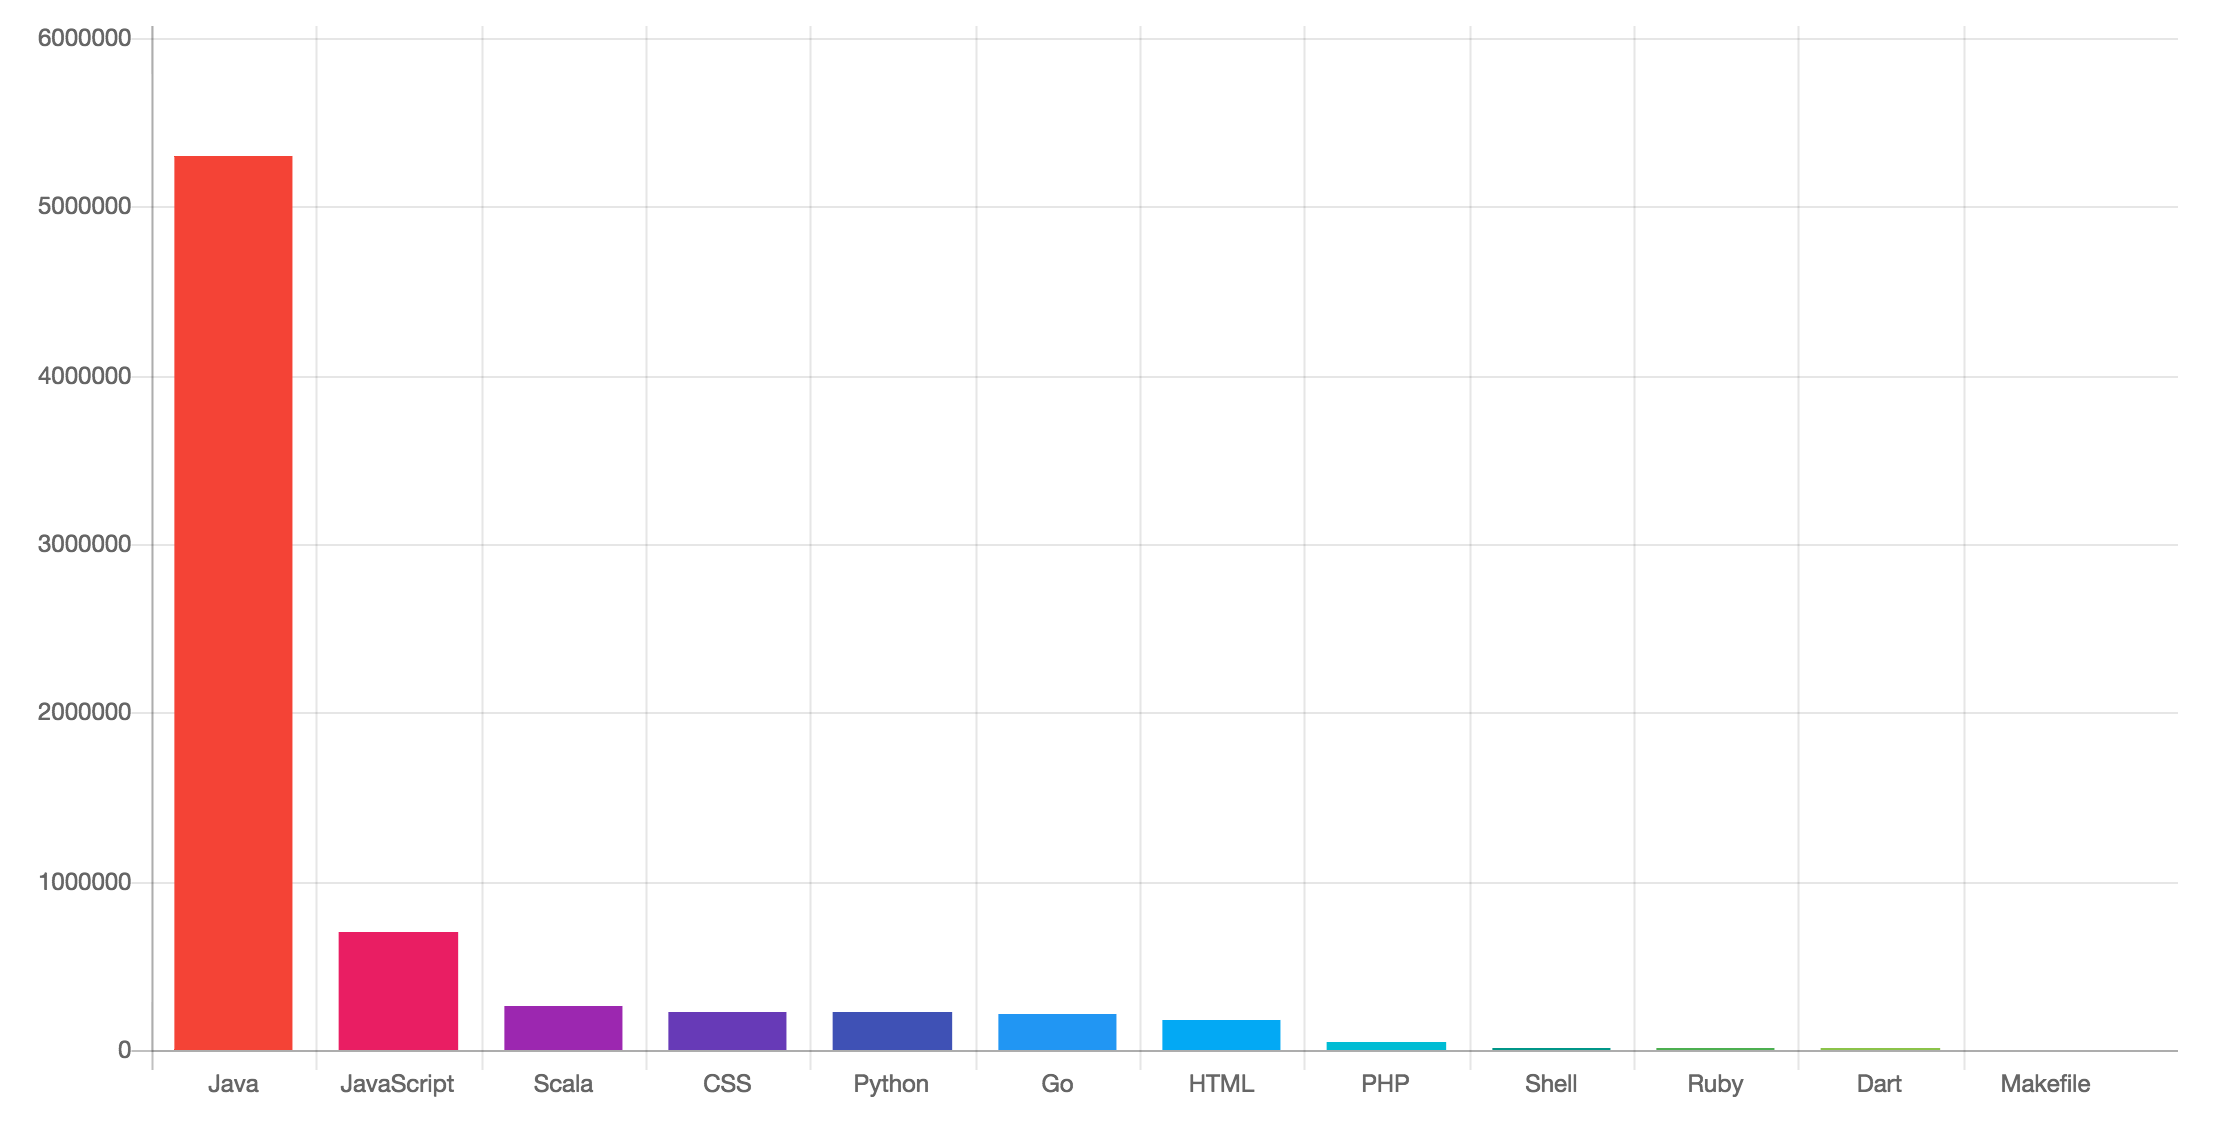
  • Bar chart of a Github user's lines of code per language (requires setting up an Access Token)
USER=???
ACCESS_TOKEN=???
curl -u $USER:$ACCESS_TOKEN -s "https://api.github.com/user/repos" | \
    jq -r 'map(.languages_url) | .[]' | xargs curl -s -u $USER:$ACCESS_TOKEN | \
    jq -r '. as $in| keys[] | [.+ " "]+[$in[.] | tostring] | add' | \
    awk '{arr[$1]+=$2} END {for (i in arr) {print i,arr[i]}}' | \
    awk '{print $2 "\t" $1}' | sort -nr | chart bar

Bar chart of a Github user's lines of code per language (requires setting up an Access Token)

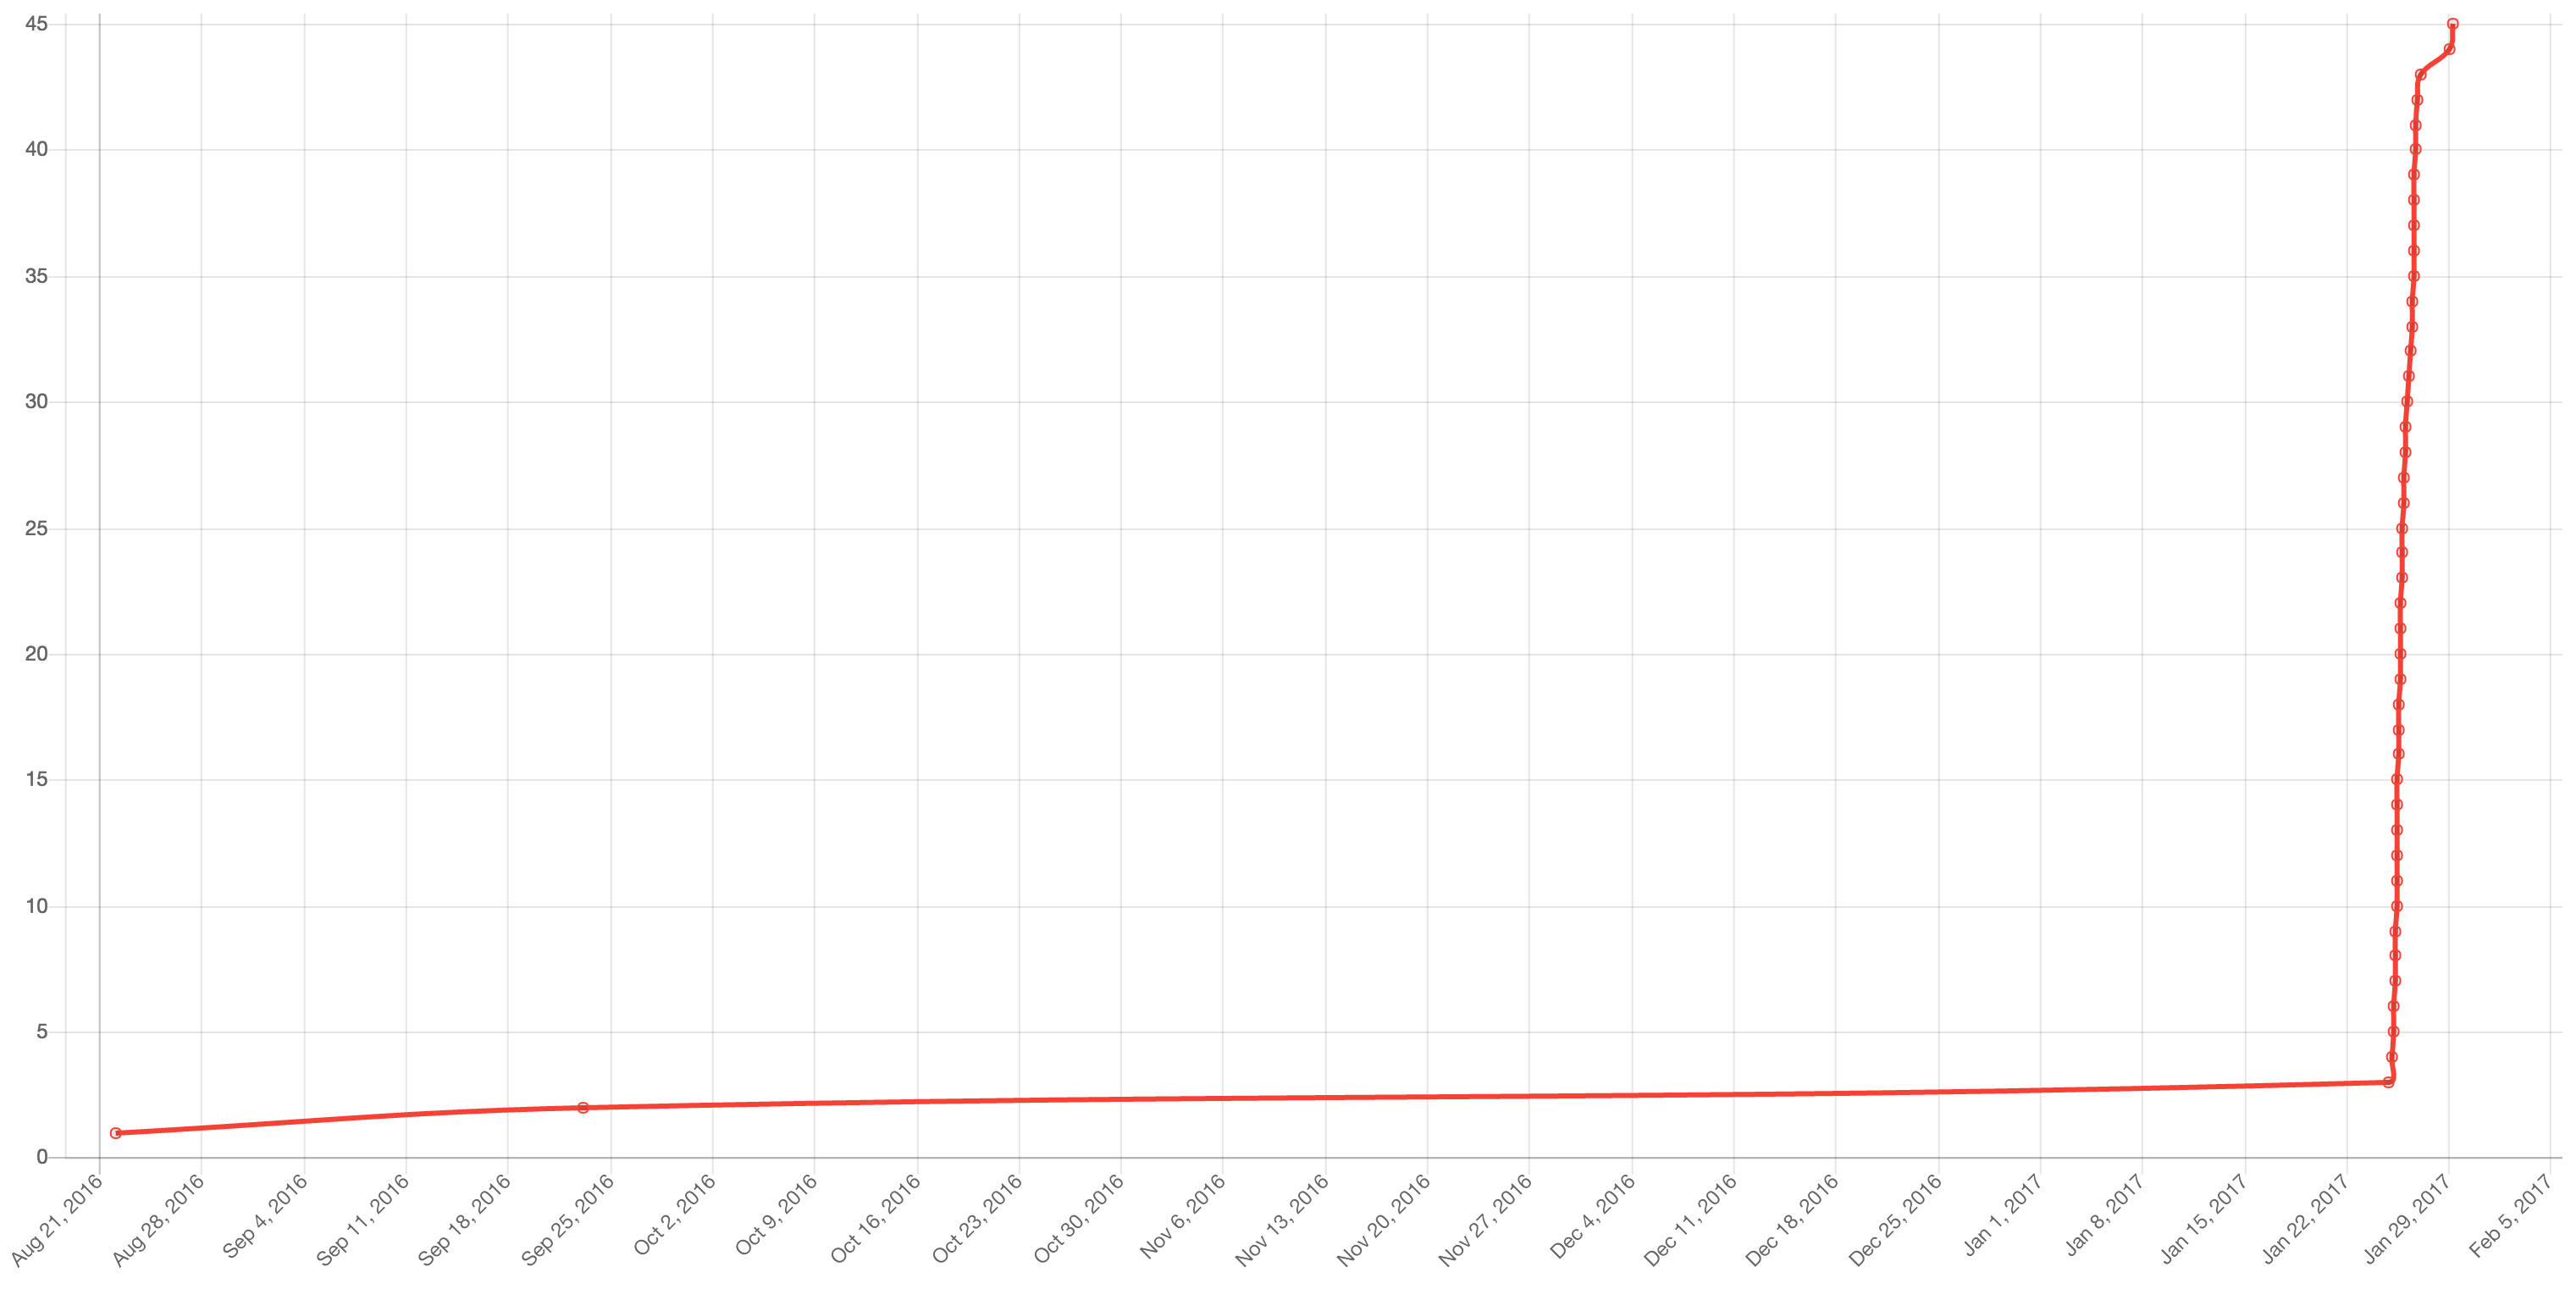
  • Line chart of the stargazers of this repo over time up to Jan 2017 (received some attention after the publication of this blogpost)
curl -s "https://api.github.com/repos/marianogappa/chart/stargazers?page=1&per_page=100" \
-H"Accept: application/vnd.github.v3.star+json" | \
jq --raw-output 'map(.starred_at) | .[]' | awk '{print NR "\t" $0}' | \
chart line --date-format 2006-01-02T15:04:05Z

Line chart of Github stargazers of this repo over time

Charting MySQL output

chart works great with sql, or with any mysql -Nsre '...' query.

I don't trust the chart is correct

Me neither. Add --debug to double-check (e.g. some rows could be being ignored due to parse failures, separator could be incorrect, column types could be inferred wrongly).

$ cat /tmp/c | ./chart bar --debug
Lines read  3
Line format inferred    ff
Lines used  3
Float column count  2
String column count 0
Date/Time column count  0
Chart type  bar
Scale type  linear
Separator   [tab]

Details

  • chart infers STDIN format by analysing line format on each line (doesn't infer separator though; defaults to \t) and computing the winner format.
  • it uses the awesome ChartJS library to plot the charts.
  • when input data is string-only, chart infers a "word frequency pie chart" use case.
  • should work on Linux/Mac/Windows thanks to open-golang.

Known issues

Contribute

PRs are greatly appreciated and are currently being merged. If you have a use case that is not supported by chart, I'd love to hear about it, but if it's too complex I'd recommend you to try gnuplot.

Development

  • Requires Go version >= 1.11 with module support for building and testing.

  • Requires Goreleaser for building and publishing releases.

  • See Makefile for build and test commands.

Note that the project description data, including the texts, logos, images, and/or trademarks, for each open source project belongs to its rightful owner. If you wish to add or remove any projects, please contact us at [email protected].