y-takey / Chartjs Plugin Stacked100
Licence: mit
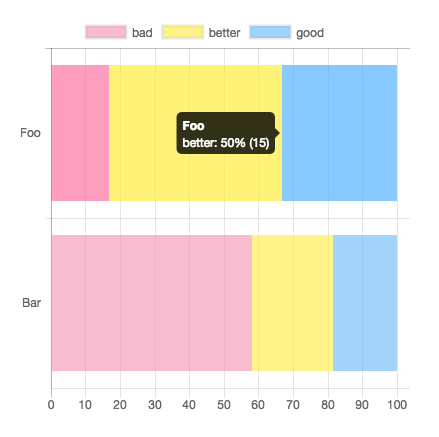
This plugin for Chart.js that makes your bar chart to 100% stacked bar chart.
Stars: ✭ 84
Programming Languages
javascript
184084 projects - #8 most used programming language
Labels
Projects that are alternatives of or similar to Chartjs Plugin Stacked100
Purpleadmin Free Admin Template
Purple Admin is one of the most stylish Bootstrap admin dashboard you can get hands on. With its beautifully crafted captivating design and well-structured code.
Stars: ✭ 473 (+463.1%)
Mutual labels: chartjs
Crypto Compare
Comparison chart between popular cryptocurrencies.
Stars: ✭ 21 (-75%)
Mutual labels: chartjs
Deep Viz
A React component library, providing concise and beautiful diversity charts with Canvas, SVG, E-map, WebGL, Dom, based on data visualization experience and commercial data display practice.
Stars: ✭ 55 (-34.52%)
Mutual labels: chartjs
Chartjs Plugin Datalabels
Chart.js plugin to display labels on data elements
Stars: ✭ 545 (+548.81%)
Mutual labels: chartjs
Vue Realtime Dashboard
a simple vuejs realtime dashboard with firebase, google maps & chartjs
Stars: ✭ 22 (-73.81%)
Mutual labels: chartjs
Laravel Chartjs
Simple package to facilitate and automate the use of charts in Laravel 5.x using Chartjs v2 library
Stars: ✭ 404 (+380.95%)
Mutual labels: chartjs
Third Stats
A Thunderbird 78+ add-on for beautifully visualized email account stats
Stars: ✭ 78 (-7.14%)
Mutual labels: chartjs
Awesome
A curated list of awesome Chart.js resources and libraries
Stars: ✭ 621 (+639.29%)
Mutual labels: chartjs
Chartkick.py
Create beautiful Javascript charts with minimal code
Stars: ✭ 695 (+727.38%)
Mutual labels: chartjs
Go Chartjs
golang library to make https://chartjs.org/ plots (this is vanilla #golang, not gopherjs)
Stars: ✭ 42 (-50%)
Mutual labels: chartjs
Chartjs Plugin Rough
Chart.js plugin to create charts with a hand-drawn, sketchy, appearance
Stars: ✭ 59 (-29.76%)
Mutual labels: chartjs
Chartjs
Drawing charts using version 1.x PLEASE CHECK version 2.x (Project Name: chartjs2)
Stars: ✭ 28 (-66.67%)
Mutual labels: chartjs
Chartjs Plugin Deferred
Chart.js plugin to defer initial chart updates
Stars: ✭ 65 (-22.62%)
Mutual labels: chartjs
chartjs-plugin-stacked100
This plugin for Chart.js that makes your bar chart to 100% stacked bar chart.
Demo: https://y-takey.github.io/chartjs-plugin-stacked100
Installation
npm install chartjs-plugin-stacked100 --save
Usage
Basic
specify plugin options with { stacked100: { enable: true } }.
Use your tooltip label
specify plugin options with { stacked100: { enable: true, replaceTooltipLabel: false } }.
and you can pass tooltip option.
new Chart(document.getElementById("my-chart"), {
  type: "bar",
  data: {},
  options: {
    tooltips: {
      callbacks: {
        label: (tooltipItem, data) => {
          const datasetIndex = tooltipItem.datasetIndex;
          const datasetLabel = data.datasets[datasetIndex].label;
          // You can use two type values.
          // `data.originalData` is raw values,
          // `data.calculatedData` is percentage values, e.g. 20.5 (The total value is 100.0)
          const originalValue = data.originalData[datasetIndex][tooltipItem.index];
          const rateValue = data.calculatedData[datasetIndex][tooltipItem.index];
          return `${datasetLabel}: ${rateValue}% (raw ${originalValue})`;
        }
      }
    },
    plugins: {
      stacked100: { enable: true, replaceTooltipLabel: false }
    }
  }
});
Specify the precision of the percentage value
You can pass precision option. (default value is 1 )
For example, when you pass { stacked100: { enable: true, precision: 3 } }, the result is 0.123% .
Examples
new Chart(document.getElementById("my-chart"), {
  type: "horizontalBar",
  data: {
    labels: ["Foo", "Bar"],
    datasets: [
      { label: "bad", data: [5, 25], backgroundColor: "rgba(244, 143, 177, 0.6)" },
      { label: "better", data: [15, 10], backgroundColor: "rgba(255, 235, 59, 0.6)" },
      { label: "good", data: [10, 8], backgroundColor: "rgba(100, 181, 246, 0.6)" }
    ]
  },
  options: {
    plugins: {
      stacked100: { enable: true }
    }
  }
});
Datapoints can be Objects
...
// line or bar charts
datasets: [
  { data: [{ y: 5 }, { y: 25 }] },
  { data: [{ y: 15 }, { y: 10 }] },
  { data: [{ y: 10 }, { y: 8 }] }
]

// horizontalBar charts
datasets: [
  { data: [{ x: 5 }, { x: 25 }] },
  { data: [{ x: 15 }, { x: 10 }] },
  { data: [{ x: 10 }, { x: 8 }] }
]
...
How to use datalabels plugin
new Chart(document.getElementById("my-chart"), {
  type: "horizontalBar",
  data: {},
  options: {
    plugins: {
      datalabels: {
        formatter: (_value, context) => {
          const data = context.chart.data;
          const { datasetIndex, dataIndex } = context;
          return `${data.calculatedData[datasetIndex][dataIndex]}% (${data.originalData[datasetIndex][dataIndex]})`;
        }
      },
      stacked100: { enable: true }
    }
  }
});
Supported chart types
- bar
- horizontalBar
- line (via @HoJSim, thanks!)
Contributing
Pull requests and issues are always welcome.
For bugs and feature requests, please create an issue.
- Fork it!
- Create your feature branch:
git checkout -b my-new-feature - Commit your changes:
git commit -am 'Add some feature' - Push to the branch:
git push origin my-new-feature - Submit a pull request!
Note that the project description data, including the texts, logos, images, and/or trademarks,
for each open source project belongs to its rightful owner.
If you wish to add or remove any projects, please contact us at [email protected].

